IMPORTANT: No additional bug fixes or documentation updates
will be released for this version. For the latest information, see the
current release documentation.
Inspect uptime duration anomalies
edit
IMPORTANT: This documentation is no longer updated. Refer to Elastic's version policy and the latest documentation.
Inspect uptime duration anomalies
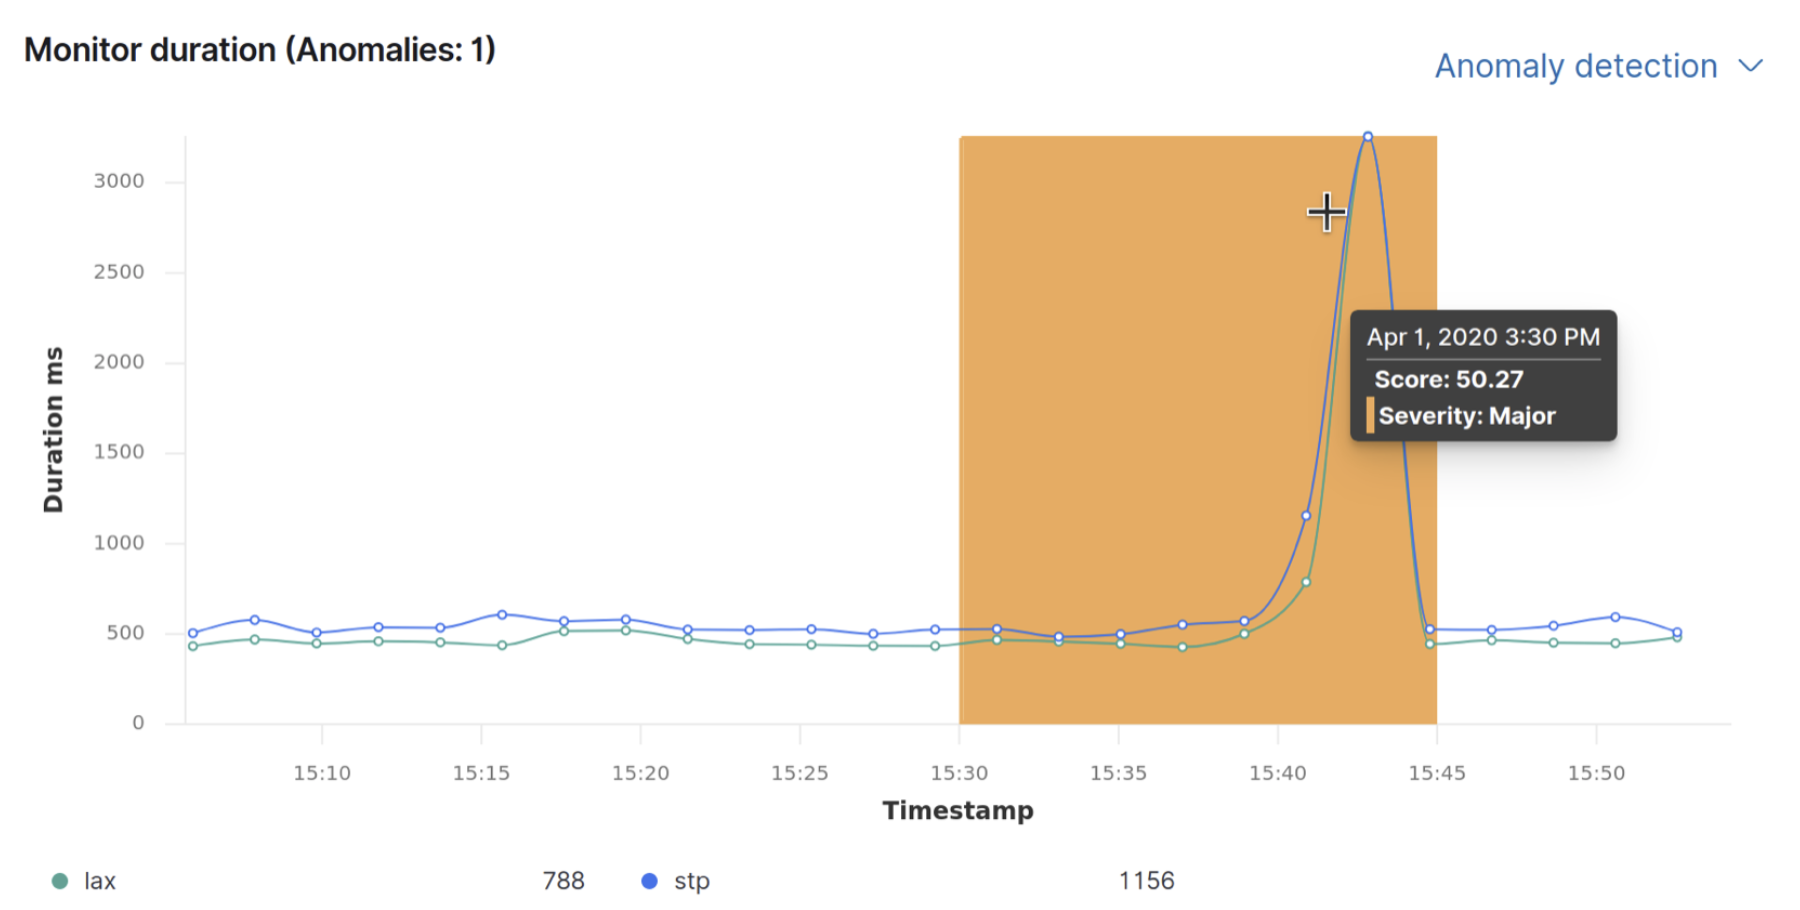
editEach monitor location is modeled, and when a monitor runs for an unusual amount of time, at a particular time, an anomaly is recorded and highlighted on the Monitor duration chart.
Enable uptime duration anomaly detection
editCreate a machine learning job to detect anomalous monitor duration rates automatically.
- To access this page, go to Observability > Uptime > Monitors, and then click a monitor to view its the details.
-
In the Monitor duration panel, click Enable anomaly detection.
If anomaly detection is already enabled, click Anomaly detection and select to view duration anomalies directly in the Machine Learning app, enable an anomaly rule, or disable the anomaly detection.
- You are prompted to create a response duration anomaly rule for the machine learning job which will carry out the analysis, and you can configure which severity level to create the rule for.
When an anomaly is detected, the duration is displayed on the Monitor duration chart, along with the duration times. The colors represent the criticality of the anomaly: red (critical) and yellow (minor).