Configure settings
editConfigure settings
editThe Settings page enables you to change which Heartbeat indices are displayed by the Uptime app, configure rule connectors, and set expiration/age thresholds for TLS certificates.
Uptime settings apply to the current space only. To segment different uptime use cases and domains, use different settings in other spaces.
- To access this page, go to Observability > Uptime.
-
At the top of the page, click Settings.
To modify items on this page, you must have the
allUptime privilege granted to your role.
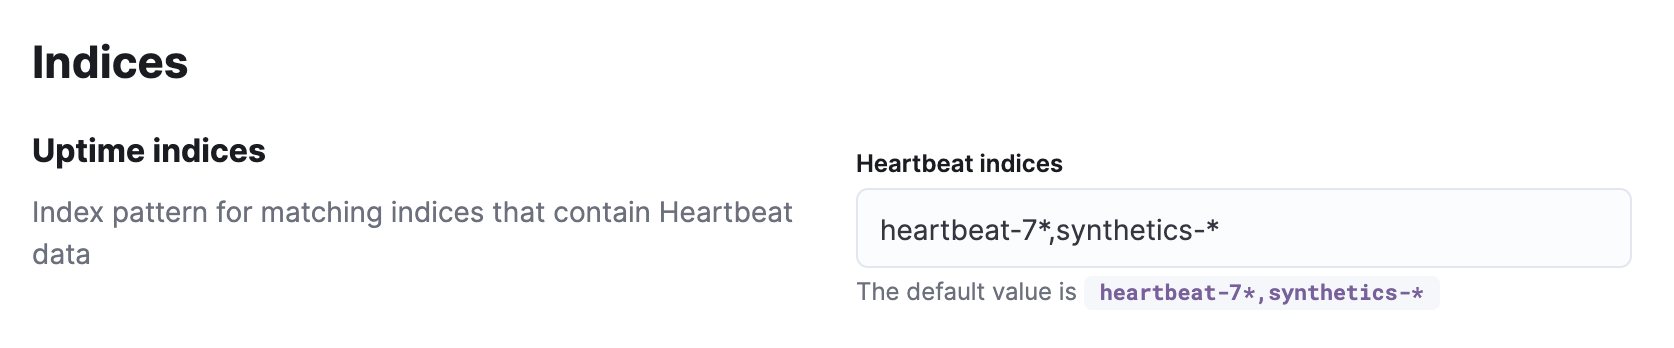
Configure indices
editSpecify a comma-separated list of index patterns to match indices in Elasticsearch that contain Heartbeat data.
The pattern set here only restricts what the Uptime app displays. You can still query Elasticsearch for data outside of this pattern.
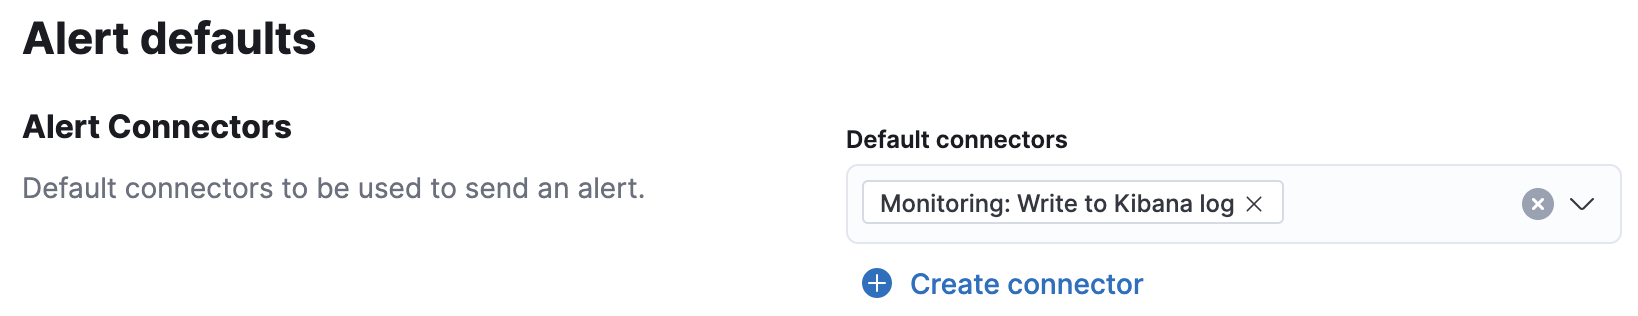
Configure connectors
editAlerts work by running checks on a schedule to detect conditions defined by a rule. When a condition is met, the rule tracks it as an alert and responds by triggering one or more actions. Actions typically involve interaction with Kibana services or third party integrations. Connectors allow actions to talk to these services and integrations.
Click Create connector and follow the prompts to select a connector type and configure its properties. After you create a connector, it’s available to you anytime you set up a rule action in the current space.
For more information about each connector, see action types and connectors.
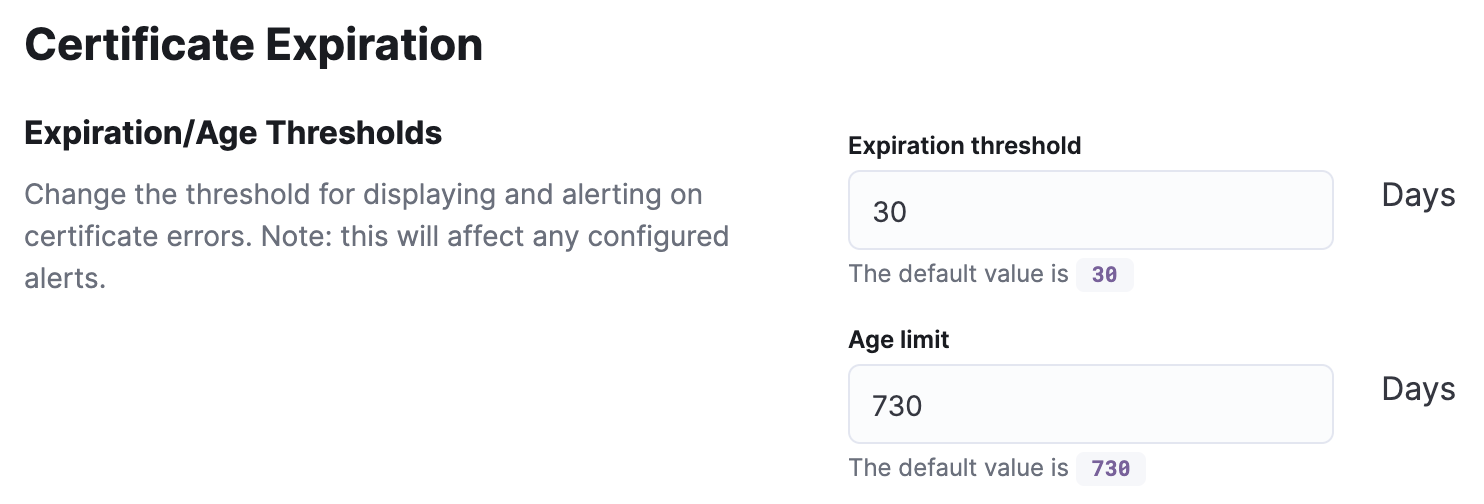
Configure certificate thresholds
editYou can modify certificate thresholds to control how Uptime displays your TLS values in the TLS Certificates page. These settings also determine which certificates are selected by any TLS rule you create.
Expiration threshold |
The |
Age limit |
The |
A standard security requirement is to make sure that your TLS certificates have not been
valid for longer than a year. To help you keep track of which certificates you may want to refresh,
modify the Age limit value to 365 days.