Monitor AWS Network Firewall logs
editMonitor AWS Network Firewall logs
editIn this section, you’ll learn how to send AWS Network Firewall log events from AWS to your Elastic stack using Amazon Data Firehose.
You will go through the following steps:
- Select a AWS Network Firewall-compatible resource
- Create a delivery stream in Amazon Data Firehose
- Set up logging to forward the logs to the Elastic stack using a Firehose stream
- Visualize your logs in Kibana
Before you begin
editWe assume that you already have:
- An AWS account with permissions to pull the necessary data from AWS.
- A deployment using our hosted Elasticsearch Service on Elastic Cloud. The deployment includes an Elasticsearch cluster for storing and searching your data, and Kibana for visualizing and managing your data. AWS Data Firehose works with Elastic Stack version 7.17 or greater, running on Elastic Cloud only.
AWS PrivateLink is not supported. Make sure the deployment is on AWS, because the Amazon Data Firehose delivery stream connects specifically to an endpoint that needs to be on AWS.
Step 1: Install AWS integration in Kibana
edit- In Kibana, navigate to Management > Integrations and browse the catalog to find the AWS integration.
- Navigate to the Settings tab and click Install AWS assets.
Step 2: Select a resource
edit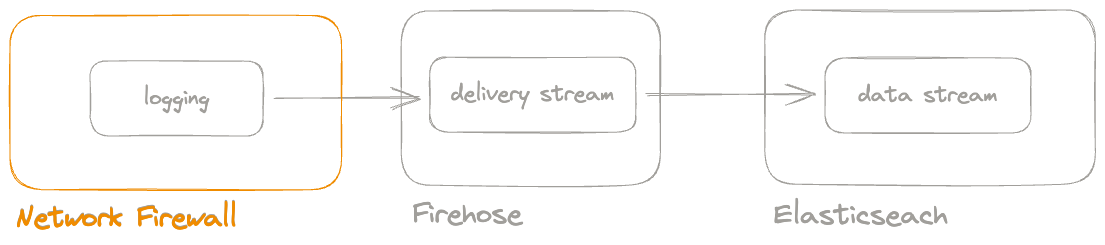
You can either use an existing AWS Network Firewall, or create a new one for testing purposes.
Creating a Network Firewall is not trivial and is beyond the scope of this guide. For more information, check the AWS documentation on the Getting started with AWS Network Firewall guide.
Step 3: Create a stream in Amazon Data Firehose
edit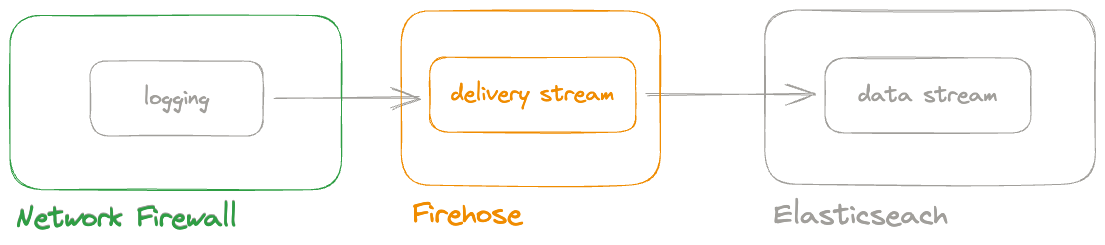
- Go to the AWS console and navigate to Amazon Data Firehose.
-
Click Create Firehose stream and choose the source and destination of your Firehose stream. Set source to
Direct PUTand destination toElastic. -
Collect Elasticsearch endpoint and API key from your deployment on Elastic Cloud.
- Elastic endpoint URL: Enter the Elasticsearch endpoint URL of your Elasticsearch cluster. To find the Elasticsearch endpoint, go to the Elastic Cloud console and select Connection details.
- API key: Enter the encoded Elastic API key. To create an API key, go to the Elastic Cloud console, select Connection details and click Create and manage API keys. If you are using an API key with Restrict privileges, make sure to review the Indices privileges to provide at least "auto_configure" and "write" permissions for the indices you will be using with this delivery stream.
-
Set up the delivery stream by specifying the following data:
- Elastic endpoint URL
- API key
- Content encoding: gzip
- Retry duration: 60 (default)
-
Parameter es_datastream_name =
logs-aws.firewall_logs-default - Backup settings: failed data only to s3 bucket
The Firehose stream is ready to send logs to our Elastic Cloud deployment.
Step 4: Enable logging
edit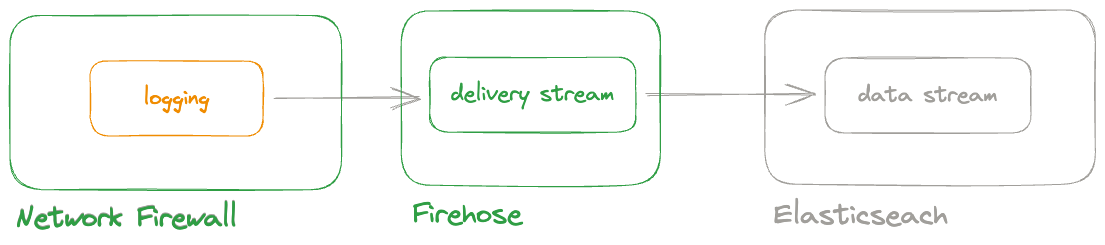
The AWS Network Firewall logs have built-in logging support. It can send logs to Amazon S3, Amazon CloudWatch, and Amazon Kinesis Data Firehose.
To enable logging to Amazon Data Firehose:
- In the AWS console, navigate to the AWS Network Firewall service.
- Select the firewall for which you want to enable logging.
- In the Logging section, click Edit.
- Select the Send logs to option and choose Kinesis Data Firehose.
- Select the Firehose stream you created in the previous step.
- Click Save.
At this point, the Network Firewall will start sending logs to the Firehose stream.
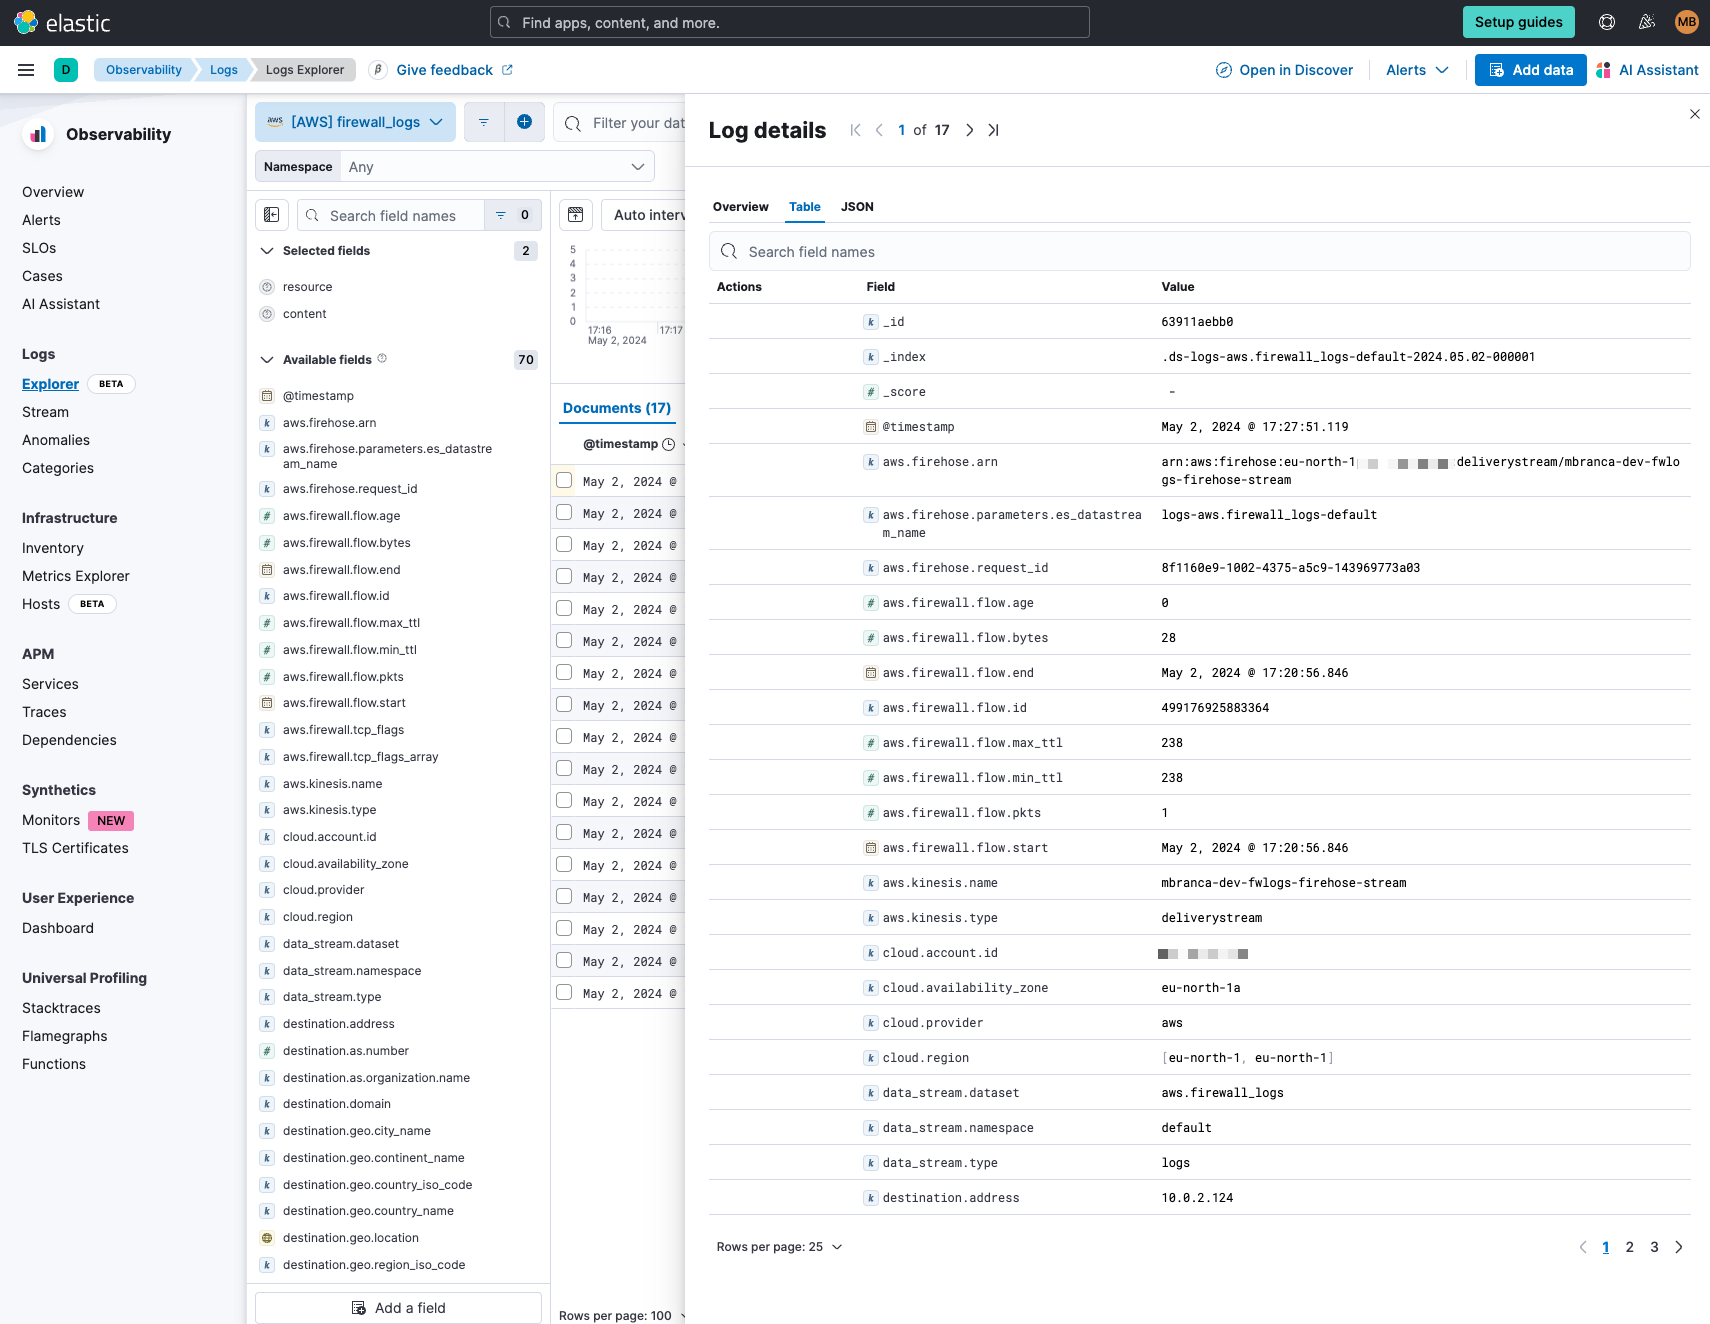
Step 5: Visualize your Network Firewall logs in Kibana
edit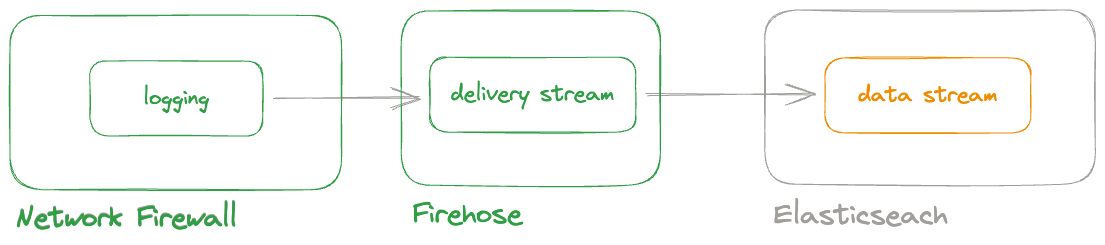
With the new logging settings in place, the Network Firewall starts sending log events to the Firehose stream.
Navigate to Kibana and choose Visualize your logs with Discover.