IMPORTANT: No additional bug fixes or documentation updates
will be released for this version. For the latest information, see the
current release documentation.
- Observability: other versions:
- What is Elastic Observability?
- What’s new in 8.15
- Get started
- Observability AI Assistant
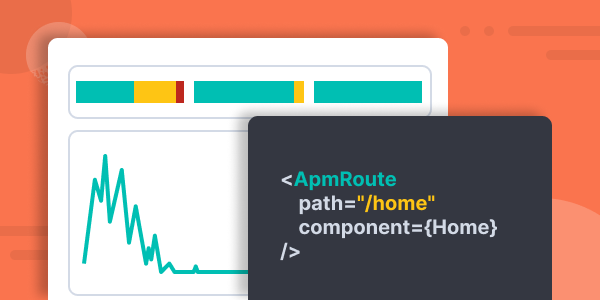
- Application performance monitoring (APM)
- Self manage APM Server
- Data Model
- Features
- Navigate the APM UI
- Perform common tasks in the APM UI
- Configure APM agents with central config
- Control access to APM data
- Create an alert
- Create and upload source maps (RUM)
- Create custom links
- Filter data
- Find transaction latency and failure correlations
- Identify deployment details for APM agents
- Integrate with machine learning
- Explore mobile sessions with Discover
- Observe Lambda functions
- Query your data
- Storage Explorer
- Track deployments with annotations
- Use OpenTelemetry
- Manage storage
- Configure
- Advanced setup
- Secure communication
- Monitor
- APM Server API
- APM UI API
- Troubleshoot
- Upgrade
- Release notes
- Known issues
- Log monitoring
- Infrastructure monitoring
- AWS monitoring
- Azure monitoring
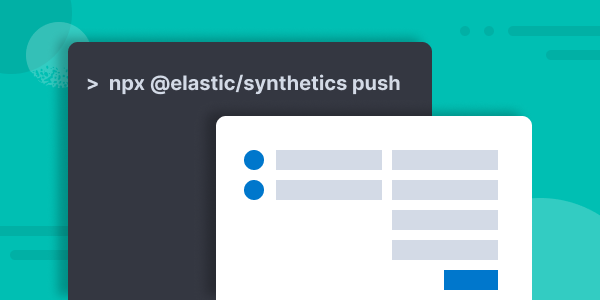
- Synthetic monitoring
- Get started
- Scripting browser monitors
- Configure lightweight monitors
- Manage monitors
- Work with params and secrets
- Analyze monitor data
- Monitor resources on private networks
- Use the CLI
- Configure projects
- Multi-factor Authentication
- Configure Synthetics settings
- Grant users access to secured resources
- Manage data retention
- Use Synthetics with traffic filters
- Migrate from the Elastic Synthetics integration
- Scale and architect a deployment
- Synthetics support matrix
- Synthetics Encryption and Security
- Troubleshooting
- Uptime monitoring
- Real user monitoring
- Universal Profiling
- Alerting
- Service-level objectives (SLOs)
- Cases
- CI/CD observability
- Troubleshooting
- Fields reference
- Tutorials
IMPORTANT: This documentation is no longer updated. Refer to Elastic's version policy and the latest documentation.
Rely on the most widely deployed observability solution, powered by machine learning and analytics, to converge metrics, logs, and traces that deliver unified visibility and actionable insights.
- Eliminate tool silos and efficiently store data
- Get visibility across hybrid and multi-cloud environments
- Monitor your digital experience — 24/7
What do you want to observe?
Use cases
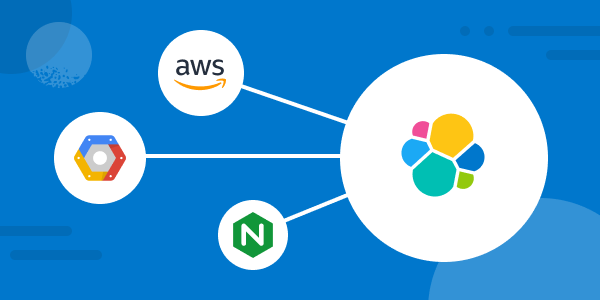
Cloud monitoring
Cross-platform and multi-cloud visibility and analytics.
- Monitor Amazon Web Services (AWS)
Learn how to monitor AWS logs (VPC Flow and S3 access) and metrics (billing and EC2). - Monitor Microsoft Azure
Learn how to monitor Azure billing metrics and activity logs.
DevOps
Observe your entire software lifecycle — from development to production.
- CI/CD
Get better visibility into your CI/CD pipelines. - ECS logging
Leverage the Elastic Common Schema logging libraries to automatically link application traces to their corresponding logs.
AIOps
Automate anomaly detection and accelerate root cause analysis.
- Root cause analysis with logs
Learn about Elastic’s artificial intelligence for IT operations and machine learning capabilities for root cause analysis. - APM Correlations
Automatically identify the probable causes of slow or failed transactions.
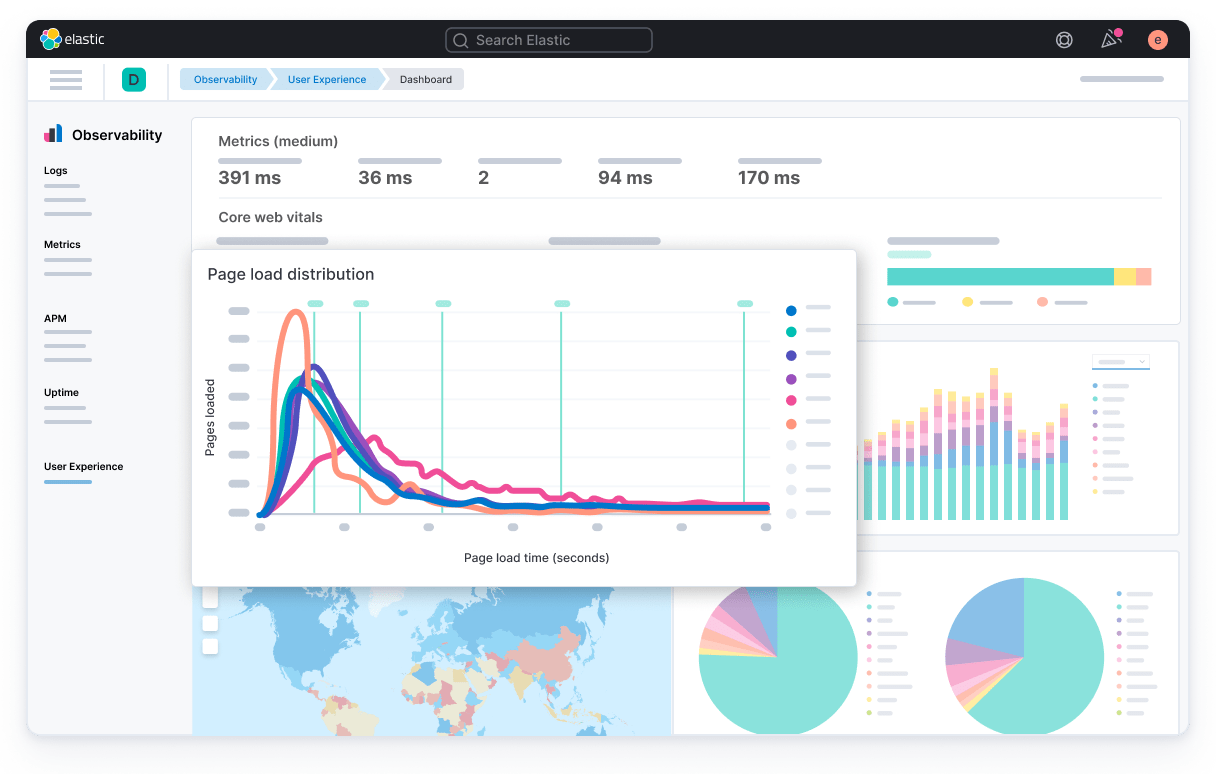
User experience
Measure, gauge, and improve your end users’ experience.
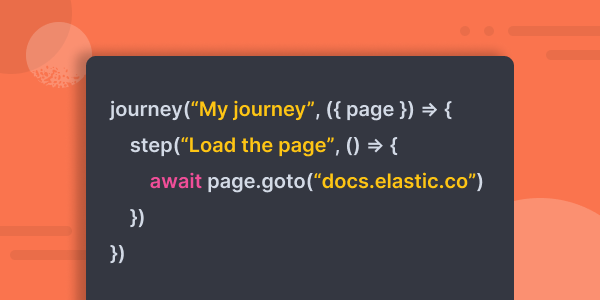
- Scripting browser monitors
Simulate critical user workflows on a regular interval to catch bugs before your users report them. - User experience
Learn how to track Core Web Vitals and how to use them to quantify the real-world user experience.