View alerts
editView alerts
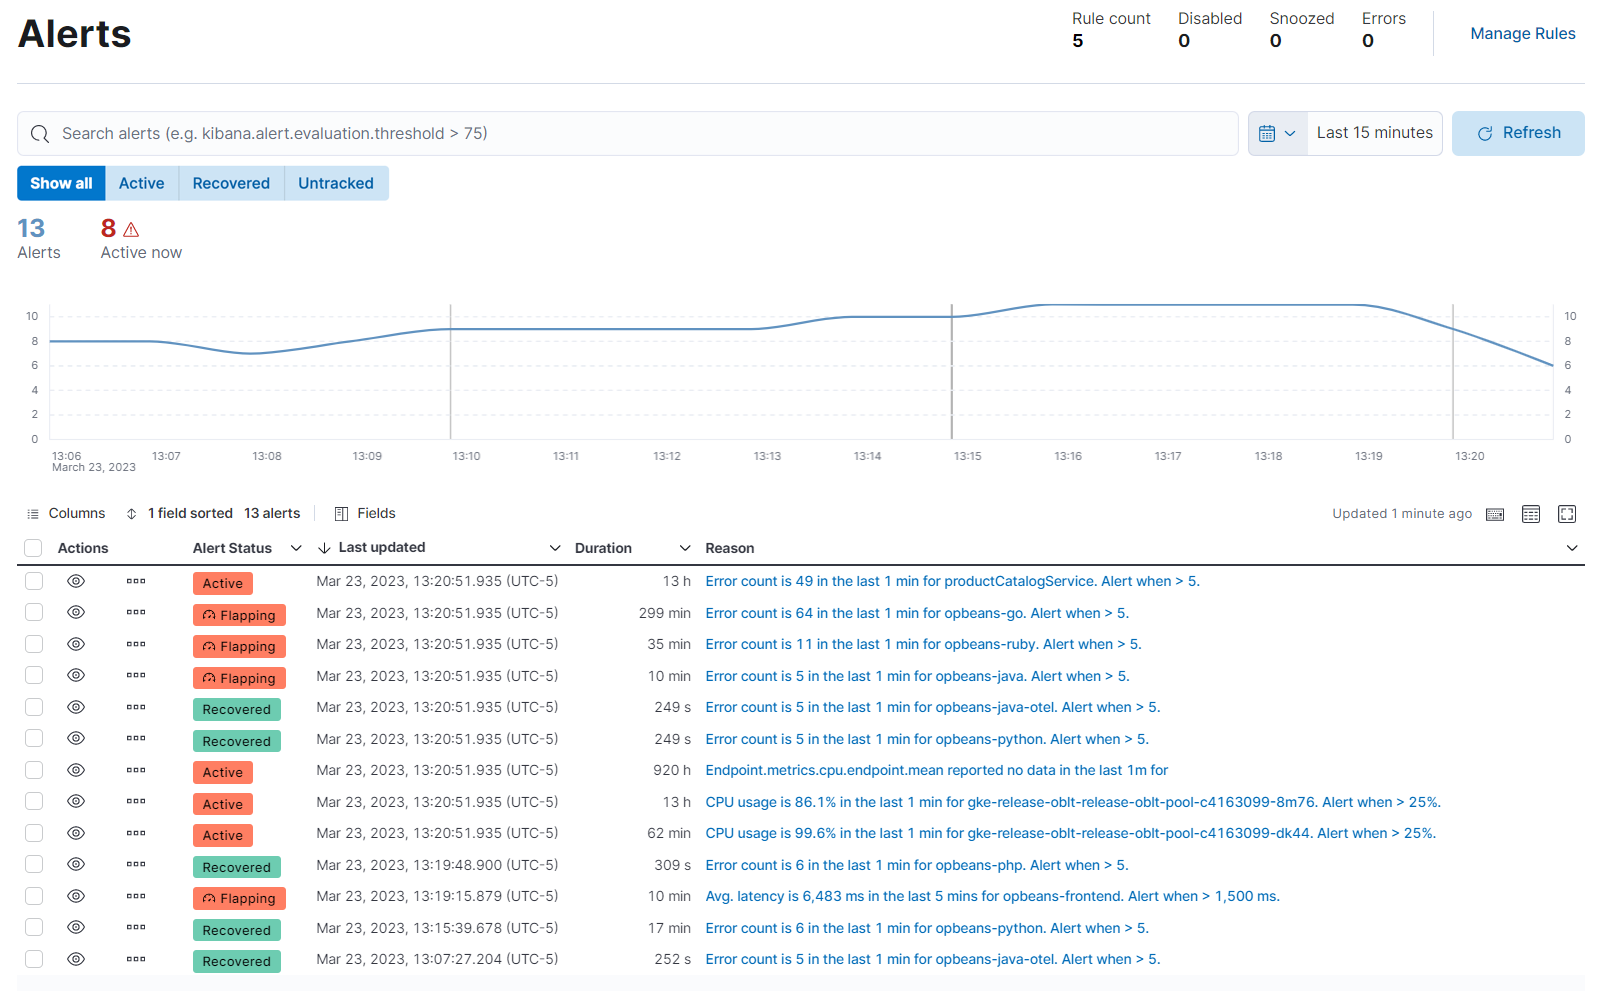
editThe Alerts page lists all the alerts that have met a condition defined by a rule you created using one of the Observability apps.
After alerts have been triggered, you can monitor their activity to verify they are functioning correctly. In addition, you can filter alerts and troubleshoot each alert in their respective app.
You can also add alerts to Cases to open and track potential infrastructure issues.
You can centrally manage rules from the Kibana Management UI that provides a set of built-in rule types and connectors for you to use. Click Manage Rules.

Filter alerts
editTo help you get started with your analysis faster, use the KQL bar to create structured queries using
Kibana Query Language. For example, kibana.alert.rule.name : <>.
You can use the time filter to define a specific date and time range. By default, this filter is set to search for the last 15 minutes.
You can also filter by alert status using the buttons below the KQL bar. By default, this filter is set to Show all alerts, but you can filter to show only Active, Recovered, or Untracked alerts.
An alert is "Active" when the condition defined in the rule currently matches.
An alert has "Recovered" when that condition, which previously matched, is currently no longer matching.
An alert is "Untracked" when its corresponding rule is disabled or you mark the alert as untracked.
To mark the alert as untracked, go to the Alerts table, click the icon to expand the "More actions" menu, and click Mark as untracked.
When an alert is marked as untracked, actions are no longer generated.
You can choose to move active alerts to this state when you disable or delete rules.
There is also a "Flapping" status, which means the alert is switching repeatedly between active and recovered states. This status is possible only if you have enabled alert flapping detection. For each space, you can choose a look back window and threshold that are used to determine whether alerts are flapping. For example, in Observability > Alerts > Settings you can specify that the alert must change status at least 6 times in the last 10 runs. If the rule has actions that run when the alert status changes, those actions are suppressed while the alert is flapping.
View alert details
editThere are a few ways to inspect the details for a specific alert.
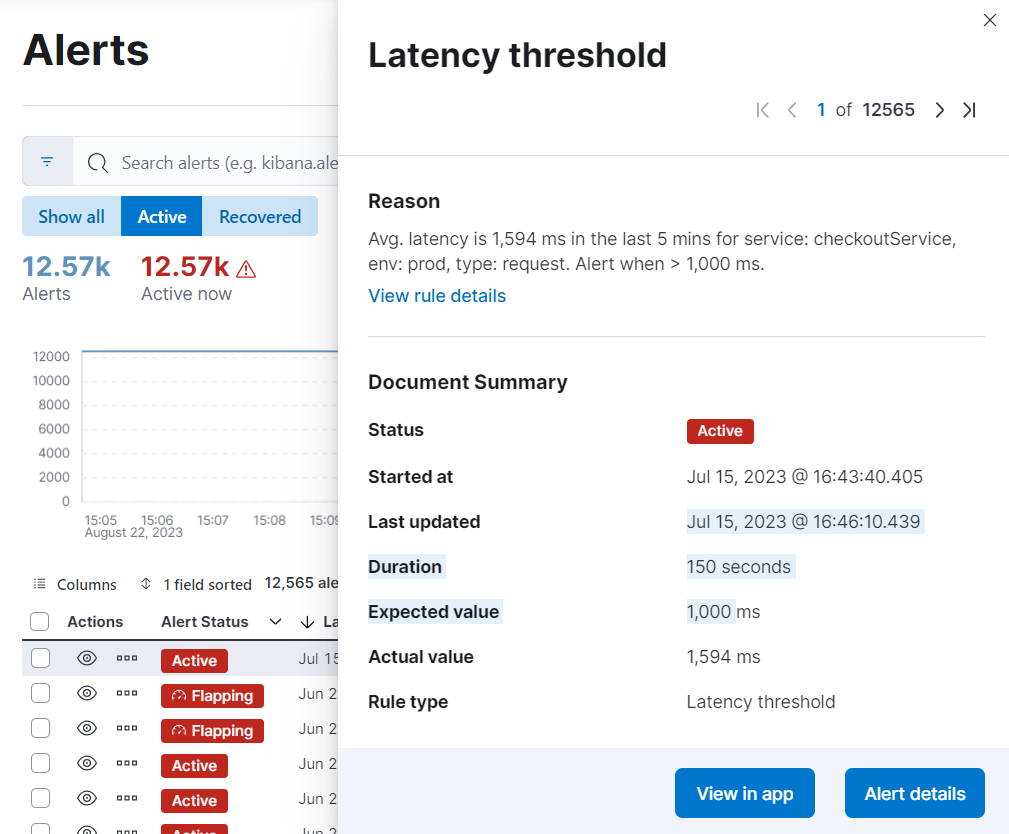
From the Alerts table, you can click the text in the Reason column to open the alert detail flyout to view a summary of the alert without leaving the page. There you’ll see the current status of the alert, its duration, and when it was last updated. To help you determine what caused the alert, you can view the expected and actual threshold values, and the rule that produced the alert.

To further inspect the alert:
- From the alert detail flyout, click Alert details.
-
From the Alerts table, click the
icon and select View alert details.
To further inspect the rule:
- From the alert detail flyout, click View rule details.
-
From the Alerts table, click the
icon and select View rule details.
To view the alert in the app that triggered it:
- From the alert detail flyout, click View in app.
-
From the Alerts table, click the
icon.
Customize the alerts table
editUse the toolbar buttons in the upper-left of the alerts table to customize the columns you want displayed:
- Columns: Reorder the columns.
- x fields sorted: Sort the table by one or more columns.
- Fields: Select the fields to display in the table.
For example, click Fields and choose the kibana.alert.maintenance_window_ids field.
If an alert was affected by a maintenance window, its identifier appears in the new column:

You can also use the toolbar buttons in the upper-right to customize the display options or view the table in full-screen mode.
Add alerts to cases
editFrom the Alerts table, you can add one or more alerts to a case. Click the icon
to add the alert to a new or existing case.
Each case can have a maximum of 1,000 alerts.
Add an alert to a new case
editTo add an alert to a new case:
- Select Add to new case.
- Enter a case name, add relevant tags, and include a case description.
- Under External incident management system, select a connector. If you’ve previously added one, that connector displays as the default selection. Otherwise, the default setting is No connector selected.
- After you’ve completed all of the required fields, click Create case. A notification message confirms you successfully created the case. To view the case details, click the notification link or go to the Cases page.
Add an alert to an existing case
editTo add an alert to an existing case:
- Select Add to existing case.
- From the Select case pane, select the case for which to attach an alert. A confirmation message displays with an option to view the updated case. To view the case details, click the notification link or go to the Cases page.