Create a monitor status rule
editCreate a monitor status rule
editThere are two types of monitor status rules:
- Synthetics monitor status for use with Elastic Synthetics.
-
[8.15.0] Deprecated in 8.15.0. Uptime monitor status for use with the Uptime app.
The Uptime app and the Uptime monitor status rule are deprecated as of version 8.15.0.
If you are using the Uptime monitor status rule with the Uptime app, you should migrate the Uptime monitor and the Uptime monitor status rule to Elastic Synthetics and the Synthetics monitor rule.
If you are using the Uptime monitor status rule with a monitor created with Elastic Synthetics, you should migrate the Uptime monitor status rule to the Synthetics monitor rule. Learn how in Migrate from the Uptime rule to the Synthetics rule.
Synthetics monitor status
editWithin the Synthetics UI, create a Monitor Status rule to receive notifications based on errors and outages.
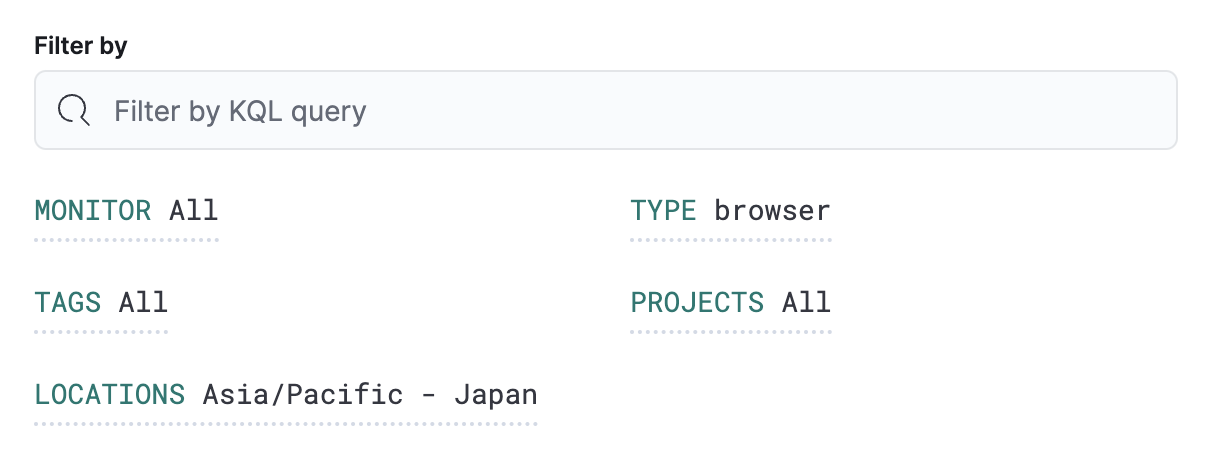
The Filter by section controls the scope of the rule.
The rule will only check monitors that match the filters defined in this section.
In this example, the rule will only alert on browser monitors located in Asia/Pacific - Japan.
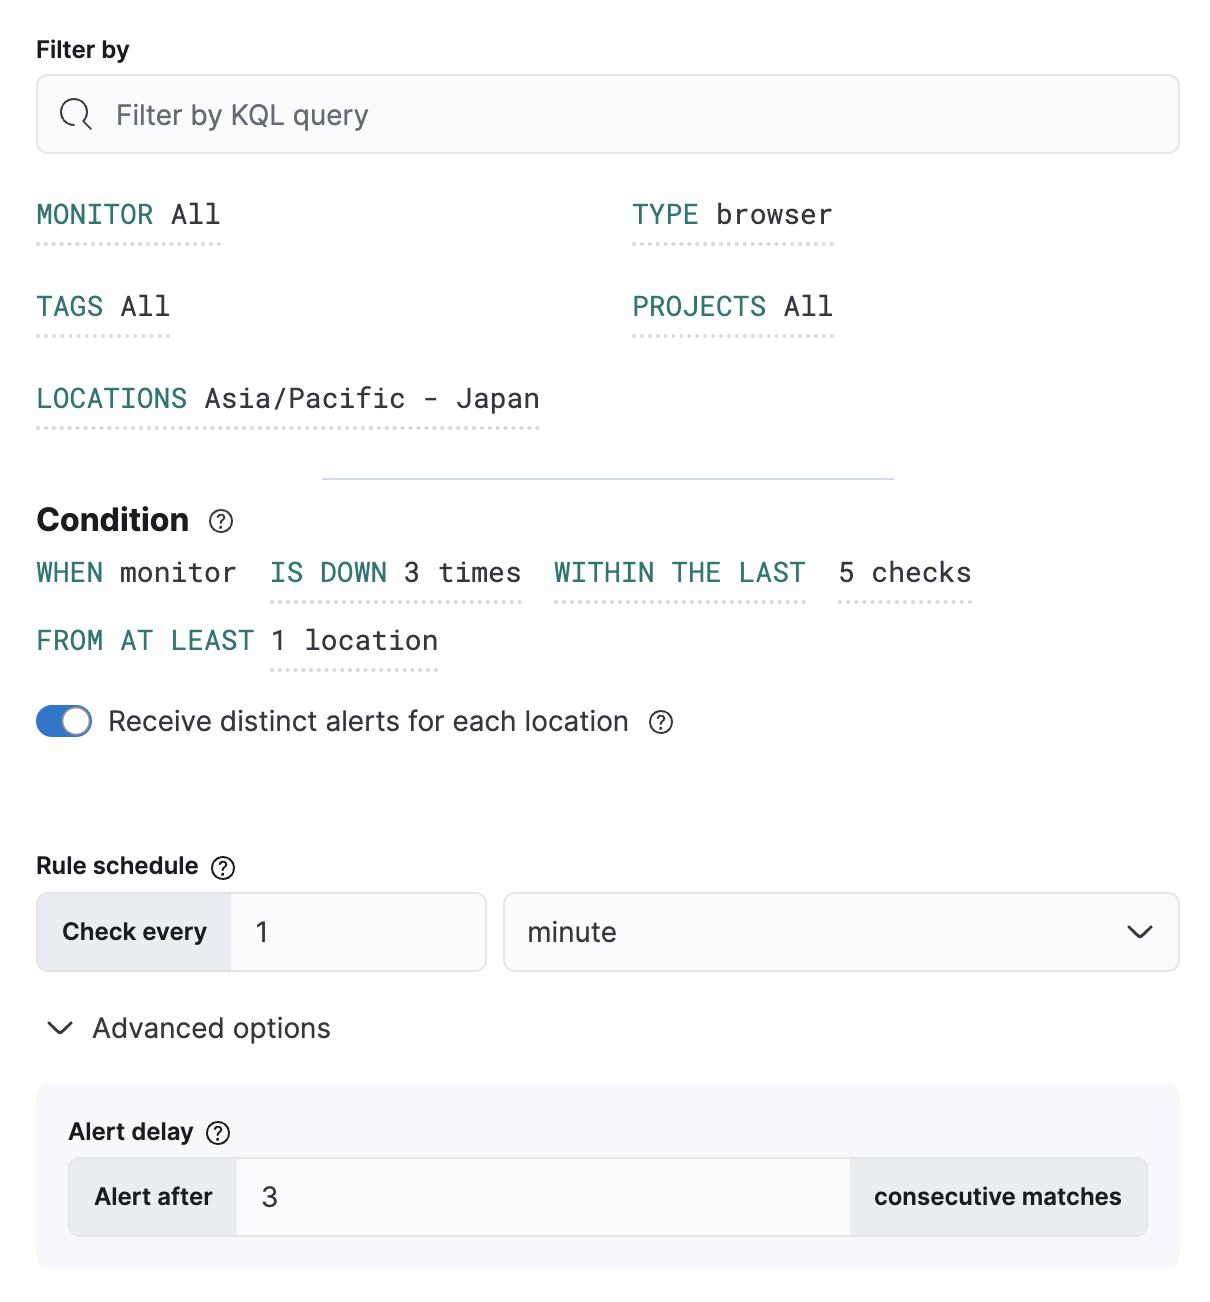
Conditions for each rule will be applied to all monitors that match the filters in the Filter by section. You can choose the number of times the monitor has to be down relative to either a number of checks run or a time range in which checks were run, and the minimum number of locations the monitor must be down in.
Retests are included in the number of checks.
The Rule schedule defines how often to evaluate the condition. Note that checks are queued, and they run as close to the defined value as capacity allows. For example, if a check is scheduled to run every 2 minutes, but the check takes longer than 2 minutes to run, a check will not run until the previous check has finished.
You can also set Advanced options such as the number of consecutive runs that must meet the rule conditions before an alert occurs.
In this example, the conditions will be met any time a browser monitor is down 3 of the last 5 times
the monitor ran across any locations that match the filter. These conditions will be evaluated every minute,
and you will only receive an alert when the conditions are met three times consecutively.
Extend your rules by connecting them to actions that use the following supported built-in integrations.
Some connector types are paid commercial features, while others are free. For a comparison of the Elastic subscription levels, go to the subscription page.
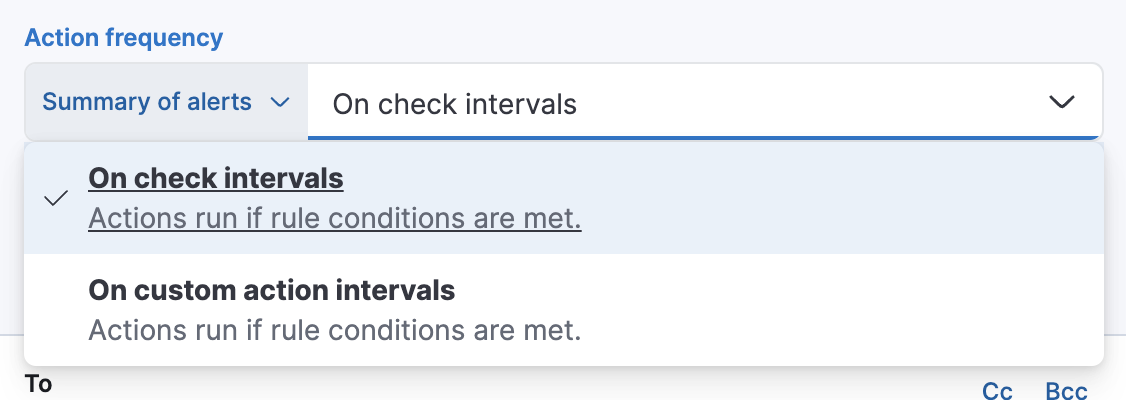
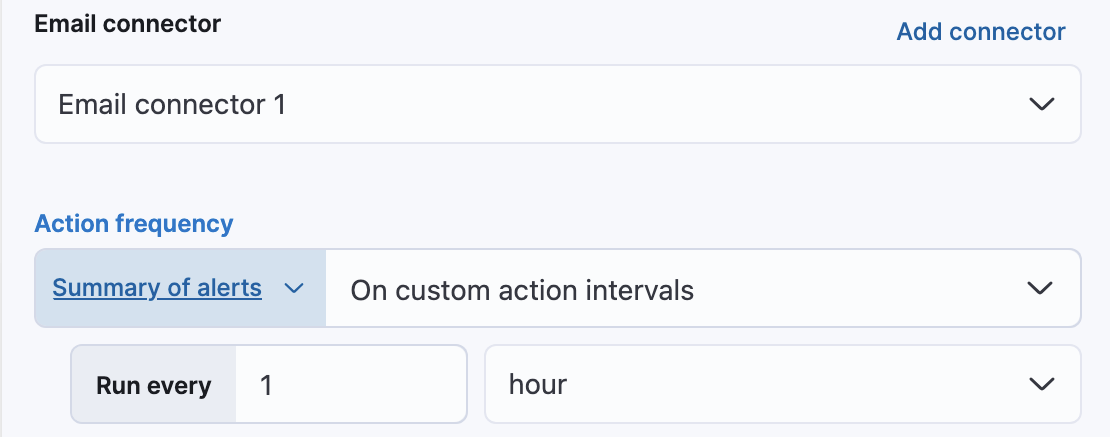
After you select a connector, you must set the action frequency. You can choose to create a summary of alerts on each check interval or on a custom interval. For example, send email notifications that summarize the new, ongoing, and recovered alerts each hour:
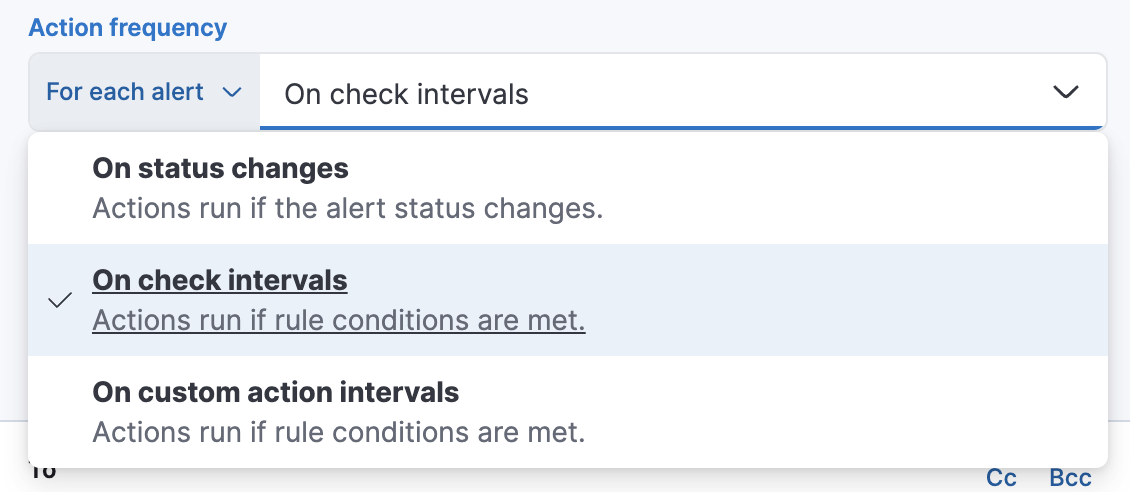
Alternatively, you can set the action frequency such that you choose how often the action runs (for example, at each check interval, only when the alert status changes, or at a custom action interval). In this case, you must also select the specific threshold condition that affects when actions run: the Synthetics monitor status changes or when it is Recovered (went from down to up).
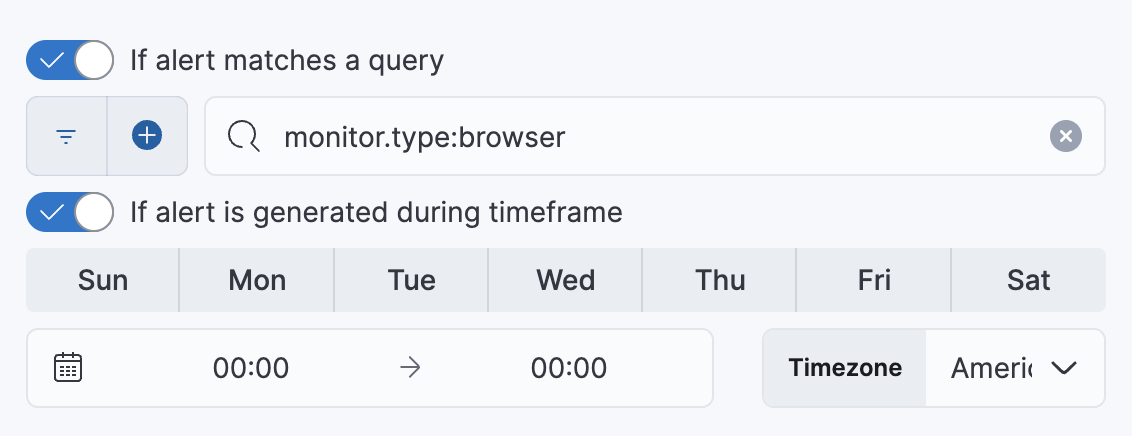
You can also further refine the conditions under which actions run by specifying that actions only run when they match a KQL query or when an alert occurs within a specific time frame:
- If alert matches query: Enter a KQL query that defines field-value pairs or query conditions that must be met for notifications to send. The query only searches alert documents in the indices specified for the rule.
- If alert is generated during timeframe: Set timeframe details. Notifications are only sent if alerts are generated within the timeframe you define.
Use the default notification message or customize it. You can add more context to the message by clicking the icon above the message text box and selecting from a list of available variables.
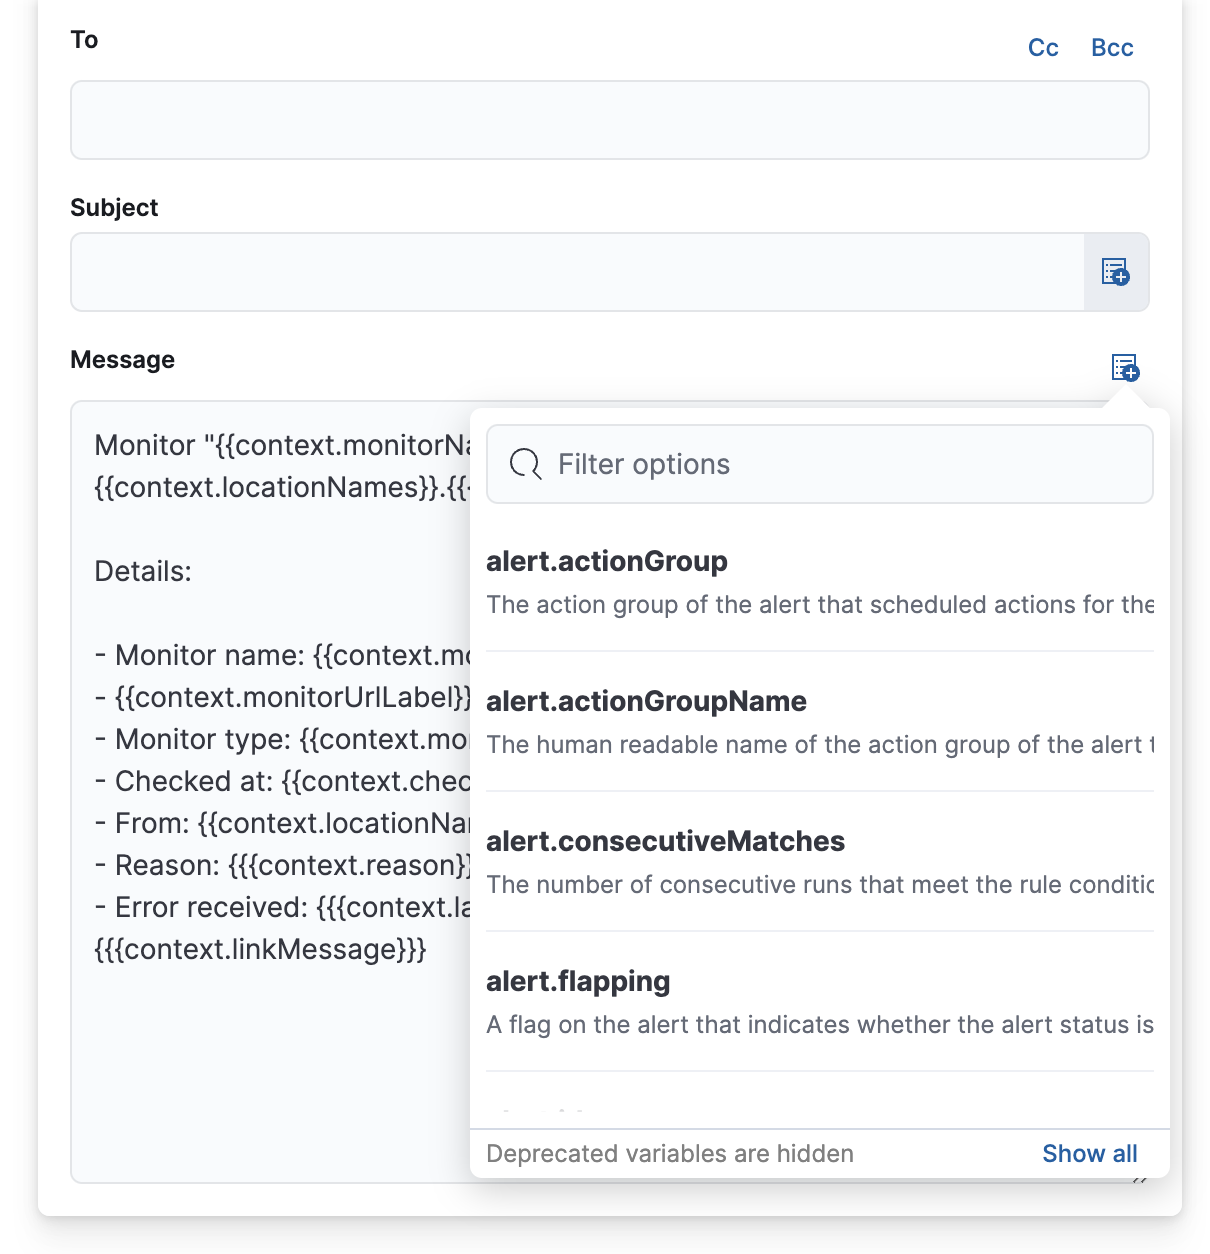
The following variables are specific to this rule type. You an also specify variables common to all rules.
-
context.checkedAt - Timestamp of the monitor run.
-
context.hostName - Hostname of the location from which the check is performed.
-
context.lastErrorMessage - Monitor last error message.
-
context.locationId - Location id from which the check is performed.
-
context.locationName - Location name from which the check is performed.
-
context.locationNames - Location names from which the checks are performed.
-
context.message - A generated message summarizing the status of monitors currently down.
-
context.monitorId - ID of the monitor.
-
context.monitorName - Name of the monitor.
-
context.monitorTags - Tags associated with the monitor.
-
context.monitorType - Type (for example, HTTP/TCP) of the monitor.
-
context.monitorUrl - URL of the monitor.
-
context.reason - A concise description of the reason for the alert.
-
context.recoveryReason - A concise description of the reason for the recovery.
-
context.status - Monitor status (for example, "down").
-
context.viewInAppUrl - Open alert details and context in Synthetics app.
Uptime monitor status
editThe Uptime app and the Uptime monitor status rule are deprecated as of version 8.15.0.
If you are using the Uptime monitor status rule with the Uptime app, you should migrate the Uptime monitor and the Uptime monitor status rule to Elastic Synthetics and the Synthetics monitor rule.
If you are using the Uptime monitor status rule with a monitor created with Elastic Synthetics, you should migrate the Uptime monitor status rule to the Synthetics monitor rule. Learn how in Migrate from the Uptime rule to the Synthetics rule.
Within the Uptime app, create a Monitor Status rule to receive notifications based on errors and outages.
- To access this page, go to Observability → Uptime.
- At the top of the page, click Alerts and rules → Create rule.
- Select Monitor status rule.
If you already have a query in the overview page search bar, it’s populated here.
You can specify the following thresholds for your rule.
Status check |
Receive alerts when a monitor goes down a specified number of times within a time range (seconds, minutes, hours, or days). |
Availability |
Receive alerts when a monitor goes below a specified availability threshold within a time range (days, weeks, months, or years). |
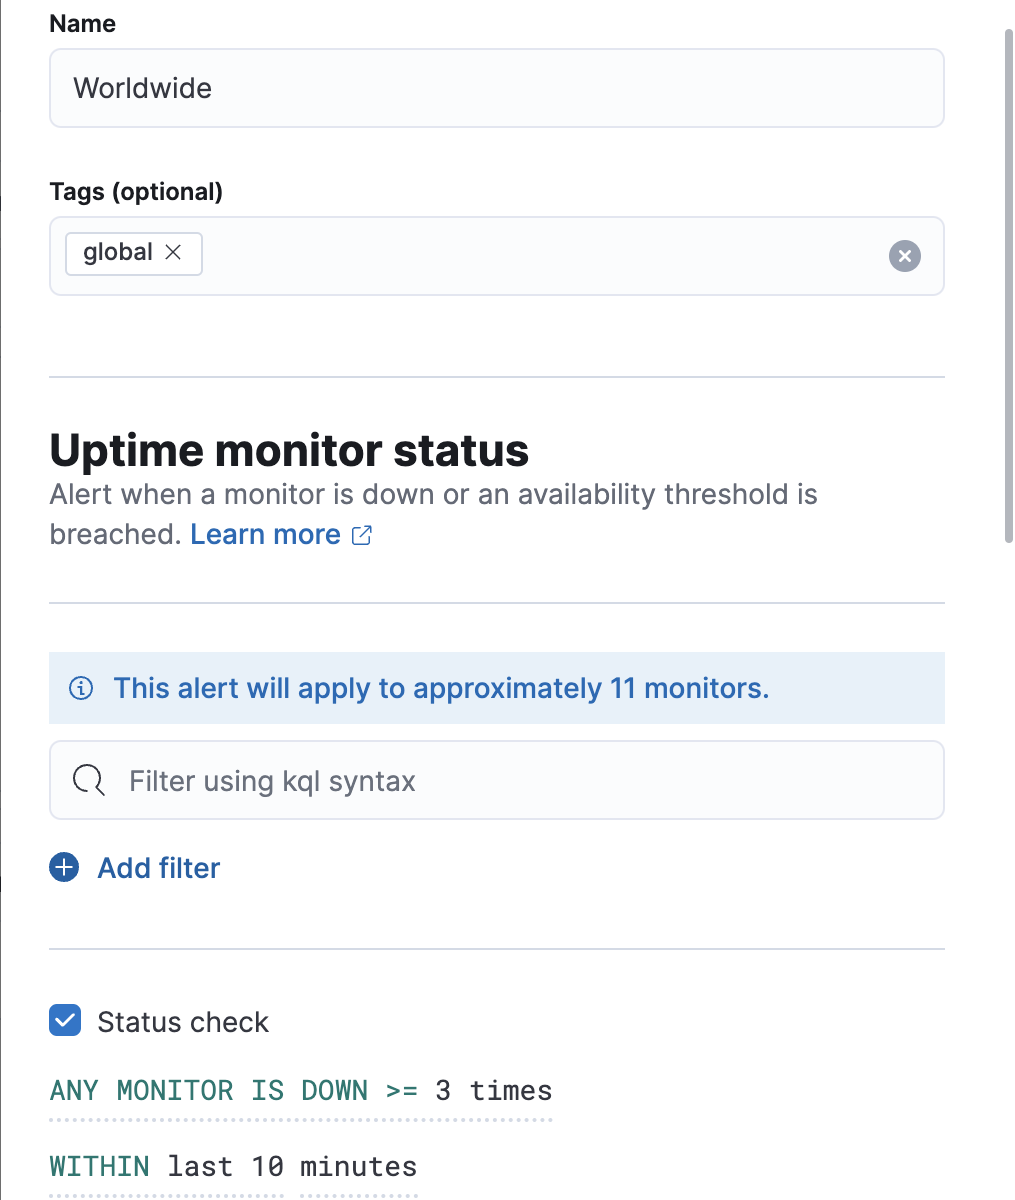
Let’s create a rule for any monitor that shows Down more than three times in 10 minutes.
This rule covers all the monitors you have running. You can use a query to specify specific monitors, and you can also have different conditions for each one.
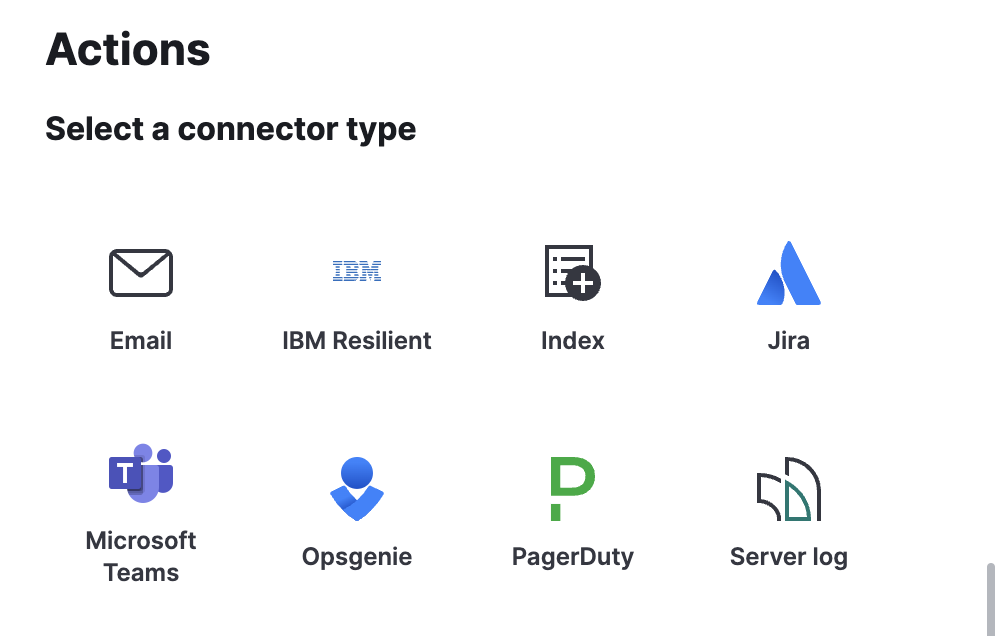
The final step when creating a rule is to select one or more actions to take when the alert is triggered.
You can extend your rules by connecting them to actions that use the following supported built-in integrations. Actions are Kibana services or integrations with third-party systems that run as background tasks on the Kibana server when rule conditions are met.
You can configure action types on the Settings page.
After you select a connector, you must set the action frequency. You can choose to create a summary of alerts on each check interval or on a custom interval. For example, send email notifications that summarize the new, ongoing, and recovered alerts each hour:
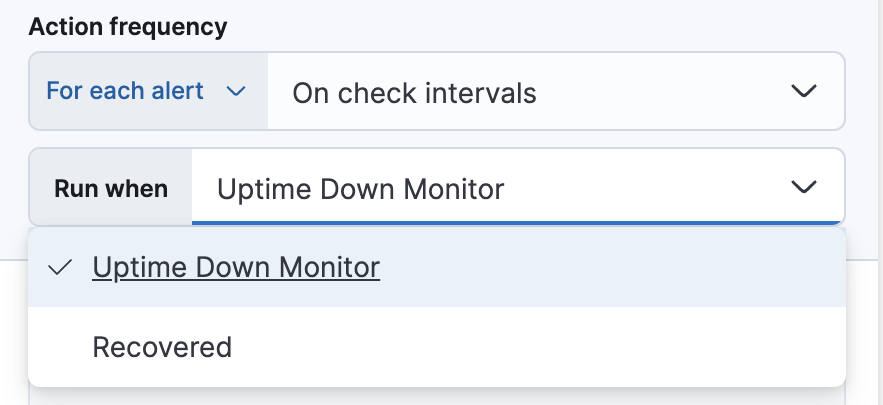
Alternatively, you can set the action frequency such that you choose how often the action runs (for example, at each check interval, only when the alert status changes, or at a custom action interval). In this case, you must also select the specific threshold condition that affects when actions run: Uptime Down Monitor or Recovered.
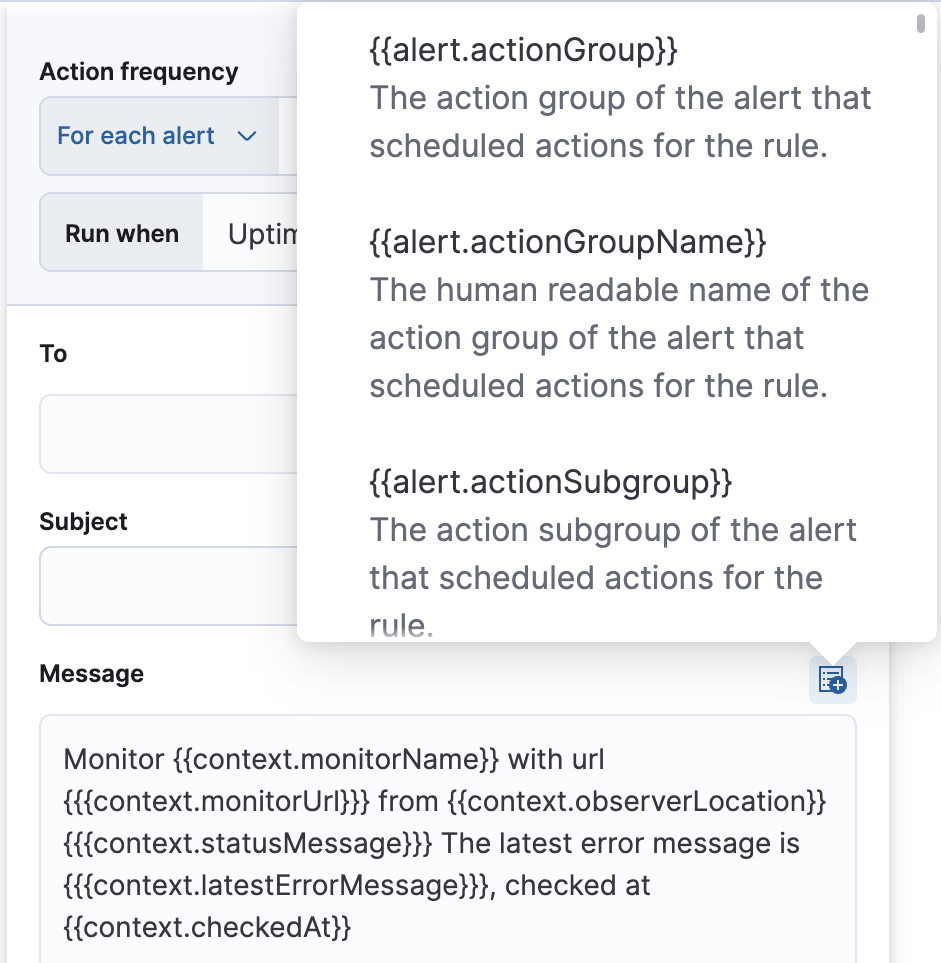
Use the default notification message or customize it. You can add more context to the message by clicking the icon above the message text box and selecting from a list of available variables.
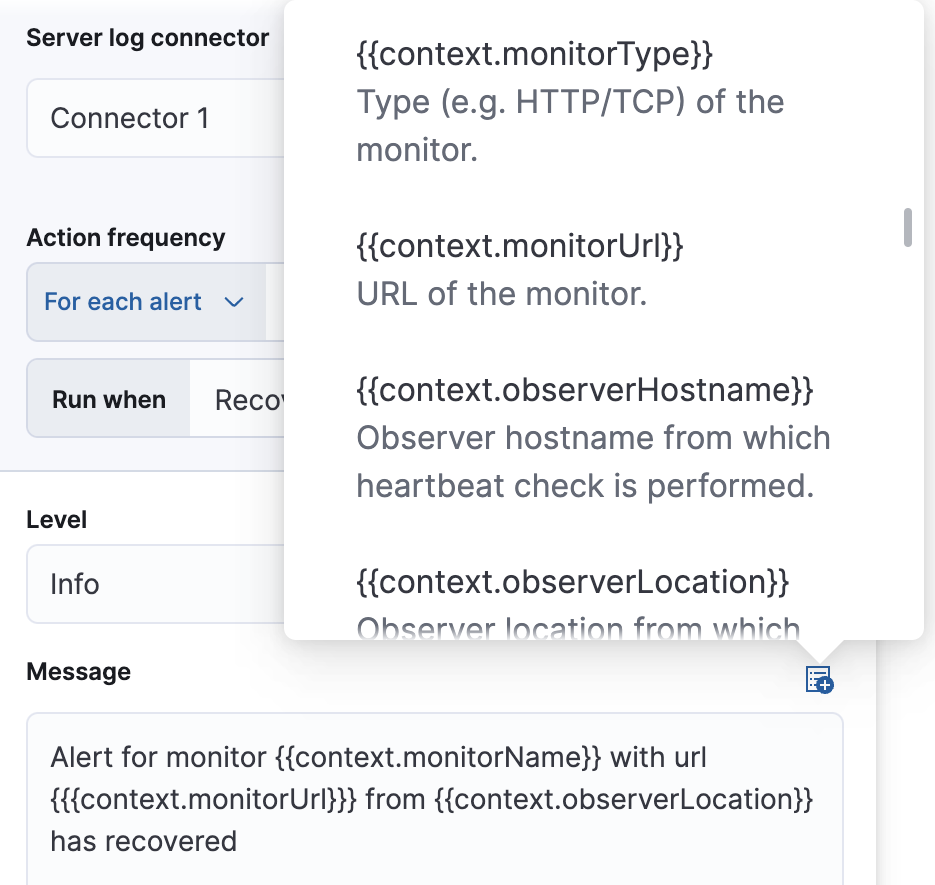
To receive a notification when the alert recovers, select Run when Recovered. Use the default notification message or customize it. You can add more context to the message by clicking the icon above the message text box and selecting from a list of available variables.
Migrate from the Uptime rule to the Synthetics rule
editIf you are currently using the Uptime monitor status with a monitor created with Elastic Synthetics, you should migrate the Uptime monitor status rule to:
- The Synthetics monitor rule for synthetic monitor status checks.
- The Synthetics availability SLI for synthetic monitor availability checks.
The KQL syntax that you used in the Uptime monitor status rule is also valid in the Filter by section of the Synthetics monitor status rule. The Synthetics monitor status rule also offers dropdowns for several categories for easy filtering. However, you can still use KQL syntax for these categories if you prefer.
If you are using the Uptime availability condition refer to Uptime availability check to Synthetics availability SLI.
If you’re using the Uptime status check condition, you can recreate similar effects using the following Synthetics monitor status rule condition equivalents:
| Uptime | Synthetics equivalent | |
|---|---|---|
Number of times the monitor is down |
Example: |
Example: |
Timeframe |
Example: |
Example: |
The default messages for the Uptime monitor status rule and Synthetics monitor status rule are different, but you can recreate similar messages using Synthetics monitor status rule action variables.
SLOs allow you to set clear, measurable targets for your service performance, based on factors like availability. The Synthetics availability SLI is a service-level indicator (SLI) based on the availability of your synthetic monitors.
The KQL syntax that you used in the Uptime monitor status rule is also valid in the Query filter field of the Synthetics availability SLI.
Use the following Synthetics availability SLI fields to replace the Uptime monitor status rule’s availability conditions:
| Uptime | Synthetics equivalent | |
|---|---|---|
Number of checks that are down relative to all checks run |
Example: |
Target / SLO (%) field Example: |
Timeframe |
Example: |
Time window and Duration fields Example: Time window: |
After creating a new SLO using the Synthetics availability SLI, you can use the SLO burn rate rule. For more information about configuring the rule, see Create an SLO burn rate rule.