Monitor Microsoft Azure OpenAI
New to Elastic? Follow the steps in our getting started guide instead of the steps described here. Return to this tutorial after you’ve learned the basics.
This tutorial shows you how to use the Elastic Azure OpenAI integration, the Azure portal, and Elastic Agent to collect and monitor Azure OpenAI logs and metrics with Elastic Observability.
You’ll learn how to:
- Set up your Azure instance to allow the Azure OpenAI integration to collect logs and metrics.
- Configure the Azure OpenAI integration to collect logs and metrics.
- Install Elastic Agent on your host.
- View your logs and metrics in Kibana using built-in dashboards and Discover.
The Elastic Azure OpenAI integration captures audit logs and request and response logs.
- Audit logs provide a range of information related to the use and management of Azure OpenAI services.
- Request and response logs provide information about each request made to the service and the corresponding response provided by the service.
For more on the fields ingested from audit and request and response logs, refer to the Azure OpenAI integration documentation.
Before Elastic Agent can collect your logs and send them to Kibana, complete the following steps in the Azure portal:
- Create an event hub to receive logs exported from the Azure service and make them available to the Elastic Agent.
- Configure diagnostic settings to send your logs to the event hub.
- Create a storage account container where the Elastic Agent can store consumer group information.
Azure Event Hubs is a data streaming platform and event ingestion service that you use to store in-flight Azure logs before sending them to Elasticsearch. For this tutorial, you create a single event hub because you are collecting logs from one service.
To create an Azure event hub:
- Go to the Azure portal.
- Search for and select Event Hubs.
- Click Create and create a new Event Hubs namespace. You’ll need to create a new resource group, or choose an existing one.
- Enter the required settings for the namespace and click Review + create.
- Click Create to deploy the resource.
- In the new namespace, click + Event Hub and enter a name for the event hub.
- Click Review + create, and then click Create to deploy the resource.
- Make a note of the event hub name because you’ll use it to configure your integration settings in Step 3: Configure the Azure OpenAI integration.
Every Azure service that creates logs has diagnostic settings that allow you to export logs and metrics to an external destination. In this step, you’ll configure the Azure OpenAI service to export audit and request and response logs to the event hub you created in the previous step.
To configure diagnostic settings to export logs:
- Go to the Azure portal and open your OpenAI resource.
- In the navigation pane, select Diagnostic settings → Add diagnostic setting.
- Enter a name for the diagnostic setting.
- In the list of log categories, select Audit logs and Request and Response Logs.
- Under Destination details, select Stream to an event hub and select the namespace and event hub you created in Create an event hub.
- Save the diagnostic settings.
The Elastic Agent stores the consumer group information (state, position, or offset) in a storage account container. Making this information available to Elastic Agents allows them to share the logs processing and resume from the last processed logs after a restart. The Elastic Agent can use one storage account container for all integrations. The agent uses the integration name and the event hub name to identify the blob to store the consumer group information uniquely.
To create the storage account:
Go to the Azure portal and select Storage accounts.
Select Create storage account.
Under Advanced, make sure these settings are as follows:
- Hierarchical namespace: disabled
- Minimum TLS version: Version 1.2
- Access tier: Hot
Under Data protections, make sure these settings are as follows:
- Enable soft delete for blobs: disabled
- Enable soft delete for containers: disabled
Click Review + create, and then click Create.
Make note of the storage account name and the storage account access keys because you’ll use them later to authenticate your Elastic application’s requests to this storage account in Step 3: Configure the Azure OpenAI integration.
The Azure OpenAI integration metric data stream collects the cognitive service metrics specific to the Azure OpenAI service. Before Elastic Agent can collect your metrics and send them to Kibana, it needs an app registration to access Azure on your behalf and collect data using the Azure APIs.
Complete the following steps in your Azure instance to register a new Azure app:
- Create the app registration.
- Add credentials to the app.
- Add role assignment to your app.
To register your app:
- Go to the Azure portal.
- Search for and select Microsoft Entra ID.
- Under Manage, select App registrations → New registration.
- Enter a display name for your app (for example,
elastic-agent). - Specify who can use the app.
- The Elastic Agent doesn’t use a redirect URI, so you can leave this field blank.
- Click Register.
- Make note of the Application (client) ID because you’ll use it to specify the Client ID in the integration settings in Step 3: Configure the Azure OpenAI integration.
Credentials allow your app to access Azure APIs and authenticate itself, so you won’t need to do anything at runtime. The Elastic Azure OpenAI integration uses client secrets to authenticate.
To create and add client secrets:
From the Azure portal, select the app you created in the previous section.
Select Certificates & secrets → Client secrets → New client secret.
Add a description (for example, "Elastic Agent client secrets").
Select an expiration or specify a custom lifetime.
Select Add.
Make note of the Value in the Client secrets table because you’ll use it to specify the Client Secret in Step 3: Configure the Azure OpenAI integration.
WarningThe secret value is not viewable after you leave this page. Record the value in a safe place.
To add a role assignment to your app:
- From the Azure portal, search for and select Subscriptions.
- Select the subscription to assign the app.
- Select Access control (IAM).
- Select Add → Add role assignment.
- In the Role tab, search for and select Monitoring Reader.
- Click Next to open the Members tab.
- Select Assign access to → User, group, or service principal, and select Select members.
- Search for and select your app name (for example, "elastic-agent").
- Click Select.
- Click Review + assign.
- Make note of the Subscription ID and Tenant ID from your Microsoft Entra because you’ll use these to specify settings in the integration.
Find Integrations in the main menu or use the global search field.
In the query bar, search for Azure OpenAI and select the Azure OpenAI integration card.
Click Add Azure OpenAI.
Under Integration settings, configure the integration name and optionally add a description.
TipIf you don’t have options for configuring the integration, you’re probably in a workflow designed for new deployments. Follow the steps, then return to this tutorial when you’re ready to configure the integration.
To collect Azure OpenAI logs, specify values for the following required fields:
- Event hub
- The name of the event hub you created earlier.
- Connection String
-
The connection string primary key of the event hub namespace. To learn how to get the connection string, refer to Get an Event Hubs connection string in the Azure documentation.
TipInstead of copying the connection string from the RootManageSharedAccessKey policy, you should create a new shared access policy (with permission to listen) and copy the connection string from the new policy.
- Storage account
- The name of a blob storage account that you set up in Create a storage account container. You can use the same storage account container for all integrations.
- Storage account key
- A valid access key defined for the storage account you created in Create a storage account container.
To collect Azure OpenAI metrics, specify values for the following required fields:
- Client ID
- The Application (client) ID that you copied earlier when you created the service principal.
- Client secret
- The secret value that you copied earlier.
- Tenant ID
- The tenant ID listed on the main Azure Active Directory Page.
- Subscription ID
- The subscription ID listed on the main Subscriptions page.
After you’ve finished configuring your integration, click Save and continue. You’ll get a notification that your integration was added. Select Add Elastic Agent to your hosts.
To get support for the latest API changes from Azure, we recommend that you use the latest in-service version of Elastic Agent compatible with your Elastic Stack. Otherwise, your integrations may not function as expected.
You can install Elastic Agent on any host that can access the Azure account and forward events to Elasticsearch.
In the popup, click Add Elastic Agent to your hosts to open the Add agent flyout.
TipIf you accidentally closed the popup, go to Fleet → Agents, then click Add agent to access the installation instructions.
The Add agent flyout has two options: Enroll in Fleet and Run standalone. The default is to enroll the agents in Fleet, as this reduces the amount of work on the person managing the hosts by providing a centralized management tool in Kibana.
The enrollment token you need should already be selected.
NoteThe enrollment token is specific to the Elastic Agent policy that you just created. When you run the command to enroll the agent in Fleet, you will pass in the enrollment token.
To download, install, and enroll the Elastic Agent, select your host operating system and copy the installation command shown in the instructions.
Run the command on the host where you want to install Elastic Agent.
It takes a few minutes for Elastic Agent to enroll in Fleet, download the configuration specified in the policy, and start collecting data. You can wait to confirm incoming data, or close the window.
Now that your log and metric data is streaming to Elasticsearch, you can view them in Kibana. You have the following options for viewing your data:
- View logs and metrics with the overview dashboard: Use the built-in overview dashboard for insight into your Azure OpenAI service like total requests and token usage.
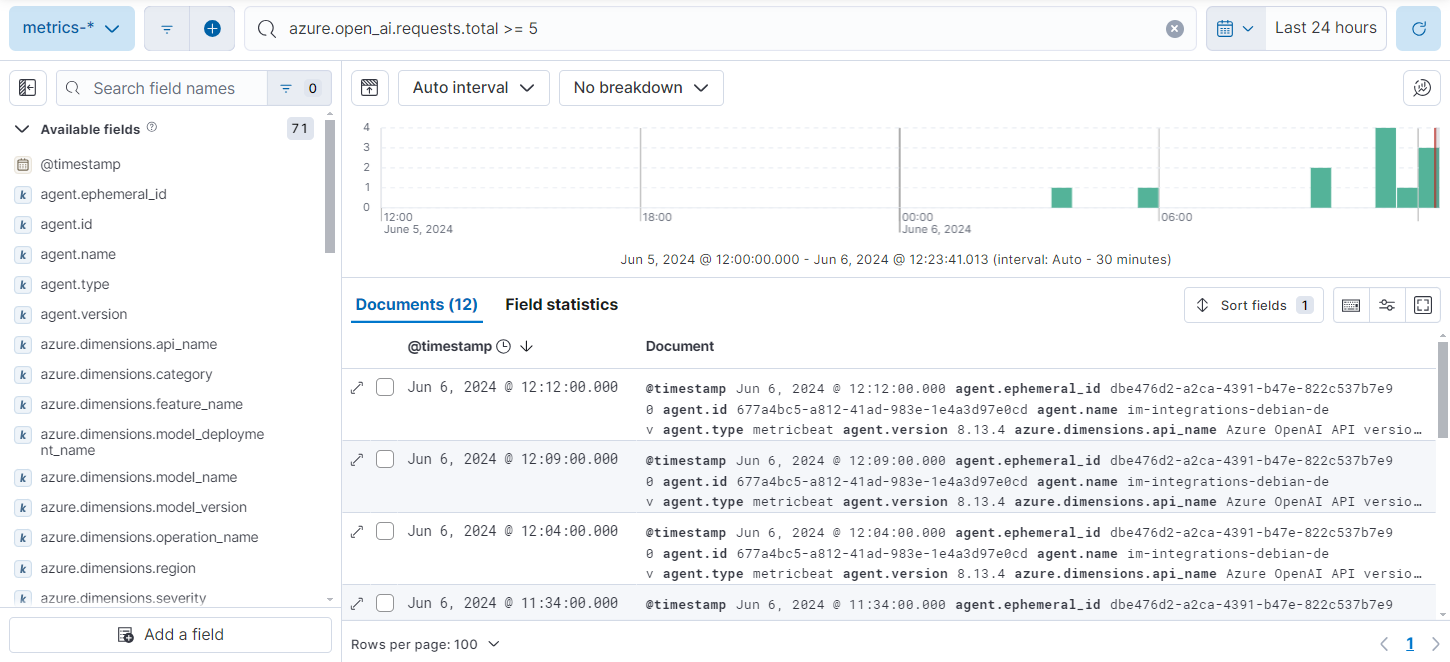
- View logs and metrics with Discover: Use Discover to find and filter your log and metric data based on specific fields.
The Elastic Azure OpenAI integration comes with a built-in overview dashboard to visualize your log and metric data. To view the integration dashboards:
- Find Dashboards in the main menu or use the global search field.
- Search for Azure OpenAI.
- Select the
[Azure OpenAI] Overviewdashboard.
From here, you’ll find visualizations of important metrics for your Azure OpenAI service, like the request rate, error rate, token usage, and chat completion latency. To zoom in on your data, click and drag across the bars in a visualization.
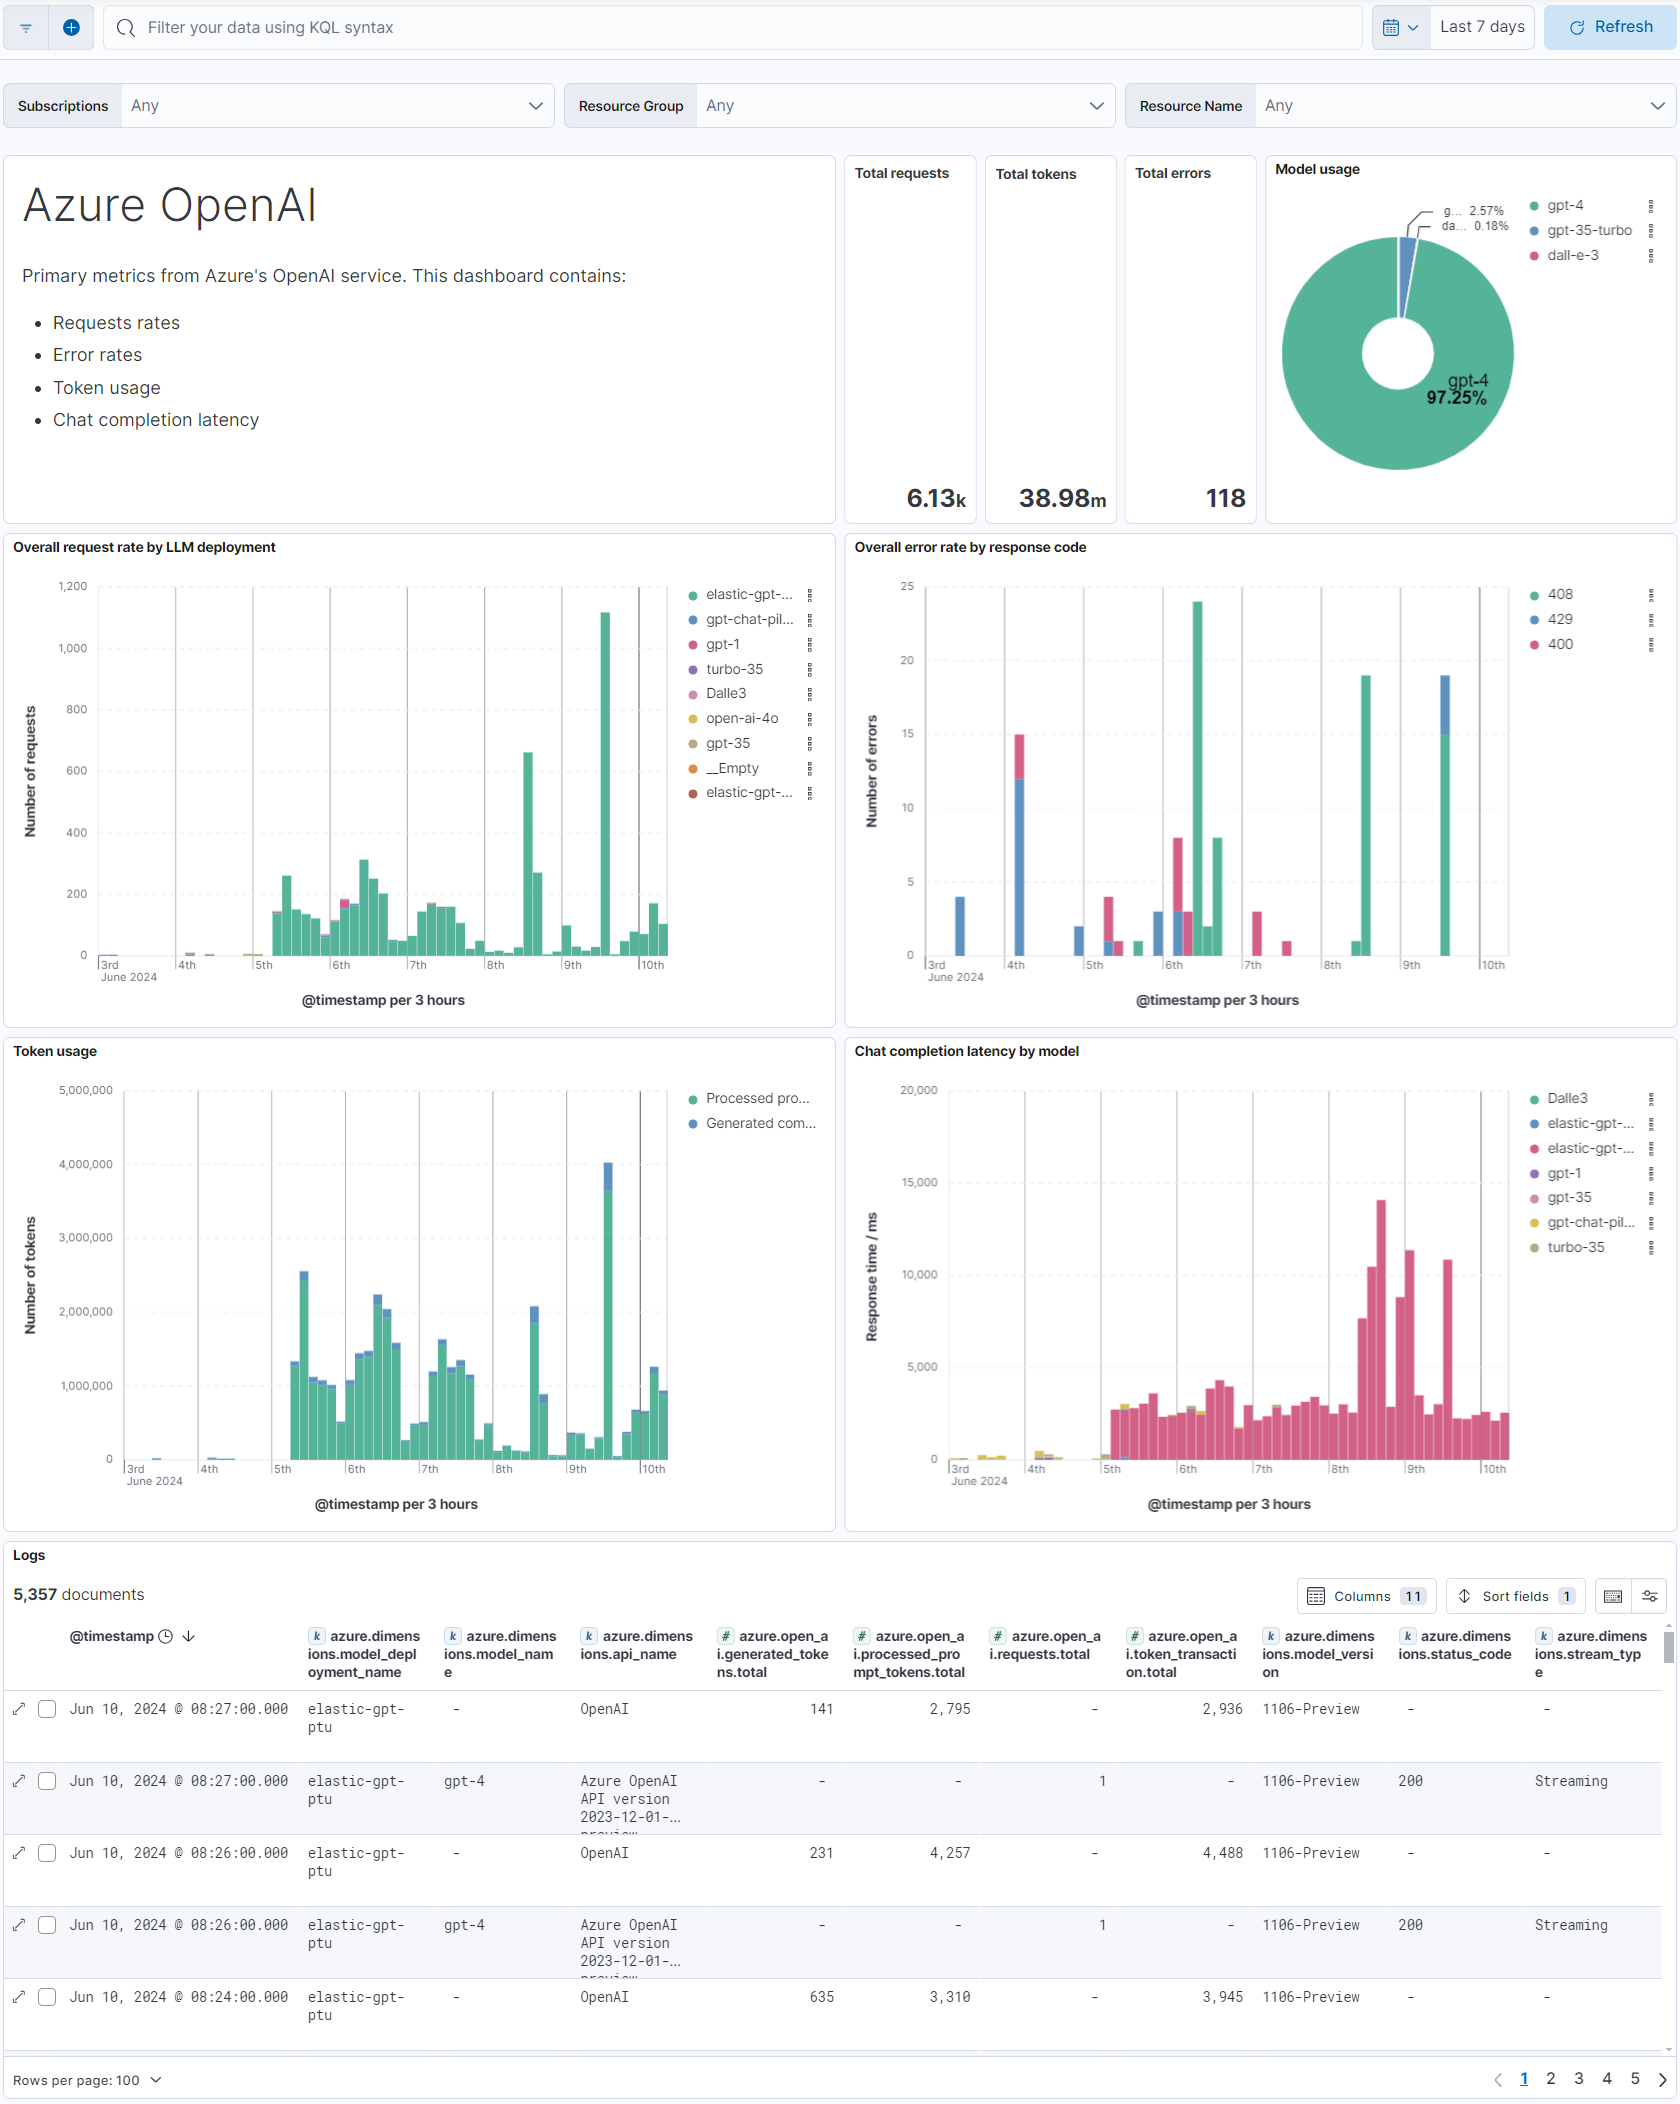
For more on dashboards and visualization, refer to the Dashboards and visualizations documentation.
Find Discover in the main menu or use the global search field. From the data view drop-down, select either logs-* or metrics-* to view specific data. You can also create data views if, for example, you wanted to view both logs-* and metrics-* simultaneously.
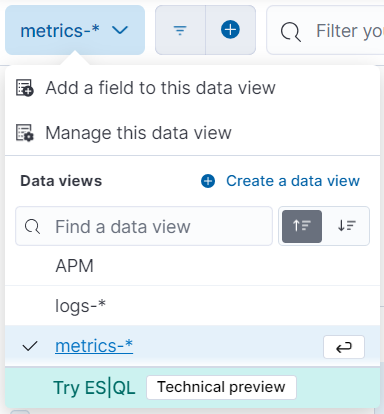
From here, filter your data and dive deeper into individual logs to find information and troubleshoot issues. For a list of Azure OpenAI fields you may want to filter by, refer to the Azure OpenAI integration docs.
For more on using Discover and creating data views, refer to the Discover documentation.
The Azure OpenAI API provides useful data to help monitor and understand your code. Using OpenTelemetry, you can ingest this data into Elastic Observability. From there, you can view and analyze your data to monitor the cost and performance of your applications.
For this tutorial, we’ll be using an example Python application and the Python OpenTelemetry libraries to instrument the application and send data to Observability.
To start collecting APM data for your Azure OpenAI applications, gather the OpenTelemetry OTLP exporter endpoint and authentication header from your Elastic Cloud instance:
Find Integrations in the main menu or use the global search field.
Select the APM integration.
Scroll down to APM Agents and select the OpenTelemetry tab.
Make note of the configuration values for the following configuration settings:
OTEL_EXPORTER_OTLP_ENDPOINTOTEL_EXPORTER_OTLP_HEADERS
With the configuration values from the APM integration and your Azure OpenAI API key and endpoint, set the following environment variables using the export command on the command line:
export AZURE_OPENAI_API_KEY="your-Azure-OpenAI-API-key"
export AZURE_OPENAI_ENDPOINT="your-Azure-OpenAI-endpoint"
export OPENAI_API_VERSION="your_api_version"
export OTEL_EXPORTER_OTLP_HEADERS="Authorization=Bearer%20<your-otel-exporter-auth-header>"
export OTEL_EXPORTER_OTLP_ENDPOINT="your-otel-exporter-endpoint"
export OTEL_RESOURCE_ATTRIBUTES=service.name=your-service-name
Install the necessary Python libraries using this command:
pip3 install openai flask opentelemetry-distro[otlp] opentelemetry-instrumentation
The following code is from the example application. In a real use case, you would add the import statements to your code.
The app we’re using in this tutorial is a simple example that calls Azure OpenAI APIs with the following message: “How do I send my APM data to Elastic Observability?”:
import os

from flask import Flask
from openai import AzureOpenAI
from opentelemetry import trace

from monitor import count_completion_requests_and_tokens


# Initialize Flask app
app = Flask(__name__)

# Set OpenAI API key
client = AzureOpenAI(
    api_key=os.getenv("AZURE_OPENAI_API_KEY"),
    api_version=os.getenv("OPENAI_API_VERSION"),
    azure_endpoint=os.getenv("AZURE_OPENAI_ENDPOINT"),
)

# Monkey-patch the openai.Completion.create function
client.chat.completions.create = count_completion_requests_and_tokens(
    client.chat.completions.create
)

tracer = trace.get_tracer("counter")


@app.route("/completion")
@tracer.start_as_current_span("completion")
def completion():
    response = client.chat.completions.create(
        model="gpt-4",
        messages=[
            {
                "role": "user",
                "content": "How do I send my APM data to Elastic Observability?",
            }
        ],
        max_tokens=20,
        temperature=0,
    )
    return response.choices[0].message.content.strip()
The code uses monkey patching, a technique in Python that dynamically modifies the behavior of a class or module at runtime by modifying its attributes or methods, to modify the behavior of the chat.completions call so we can add the response metrics to the OpenTelemetry spans.
The monitor.py file in the example application instruments the application and can be used to instrument your own applications.
def count_completion_requests_and_tokens(func):
    @wraps(func)
    def wrapper(*args, **kwargs):
        counters["completion_count"] += 1
        response = func(*args, **kwargs)

        token_count = response.usage.total_tokens
        prompt_tokens = response.usage.prompt_tokens
        completion_tokens = response.usage.completion_tokens
        cost = calculate_cost(response)
        strResponse = json.dumps(response, default=str)

        # Set OpenTelemetry attributes
        span = trace.get_current_span()
        if span:
            span.set_attribute("completion_count", counters["completion_count"])
            span.set_attribute("token_count", token_count)
            span.set_attribute("prompt_tokens", prompt_tokens)
            span.set_attribute("completion_tokens", completion_tokens)
            span.set_attribute("model", response.model)
            span.set_attribute("cost", cost)
            span.set_attribute("response", strResponse)
        return response

    return wrapper
Adding this data to our span lets us send it to our OTLP endpoint, so you can search for the data in Observability and build dashboards and visualizations.
Implementing the following function allows you to calculate the cost of a single request to the OpenAI APIs.
def calculate_cost(response):
    if response.model in ["gpt-4", "gpt-4-0314"]:
        cost = (
            response.usage.prompt_tokens * 0.03
            + response.usage.completion_tokens * 0.06
        ) / 1000
    elif response.model in ["gpt-4-32k", "gpt-4-32k-0314"]:
        cost = (
            response.usage.prompt_tokens * 0.06
            + response.usage.completion_tokens * 0.12
        ) / 1000
    elif "gpt-3.5-turbo" in response.model:
        cost = response.usage.total_tokens * 0.002 / 1000
    elif "davinci" in response.model:
        cost = response.usage.total_tokens * 0.02 / 1000
    elif "curie" in response.model:
        cost = response.usage.total_tokens * 0.002 / 1000
    elif "babbage" in response.model:
        cost = response.usage.total_tokens * 0.0005 / 1000
    elif "ada" in response.model:
        cost = response.usage.total_tokens * 0.0004 / 1000
    else:
        cost = 0
    return cost
To download the example application and try it for yourself, go to the GitHub repo.
After ingesting your data, you can filter and explore it using Discover in Kibana. Go to Discover from the Kibana menu under Analytics. You can then filter by the fields sent to Observability by OpenTelemetry, including:
numeric_labels.completion_countnumeric_labels.completion_tokensnumeric_labels.costnumeric_labels.prompt_tokensnumeric_labels.token_count
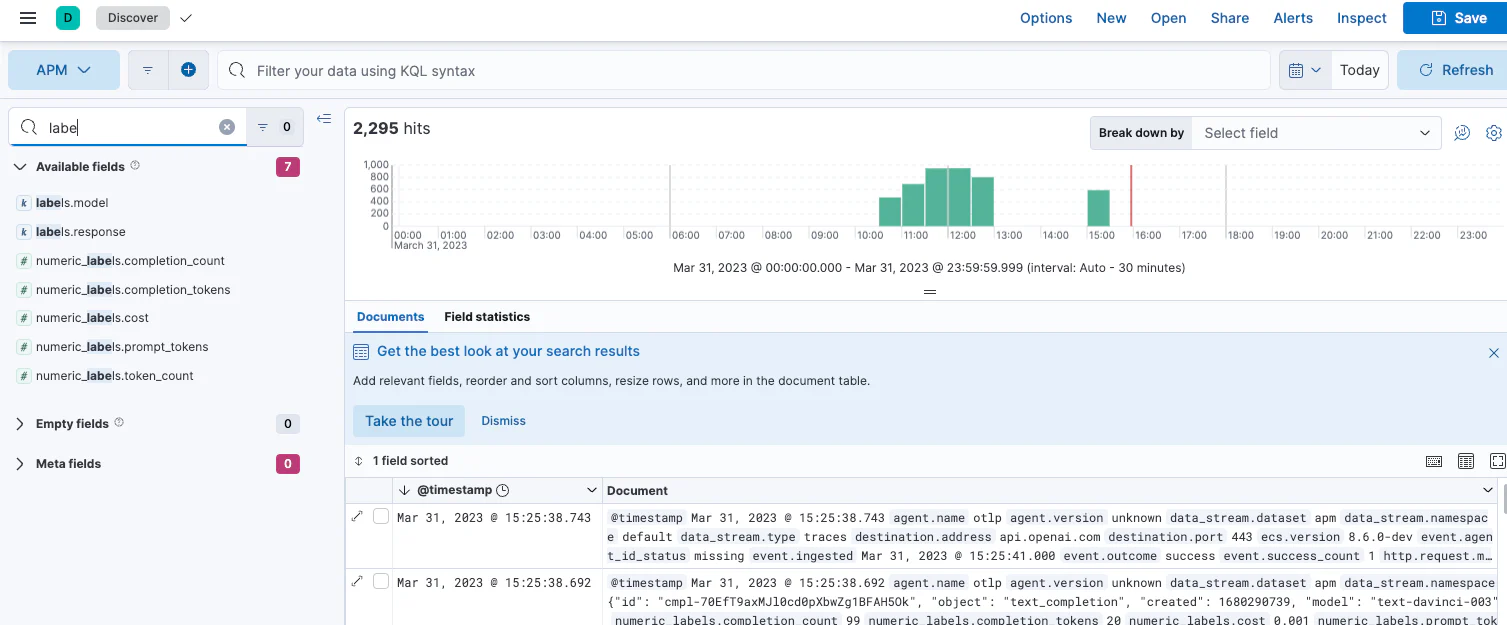
Then, use these fields to create visualizations and build dashboards. Refer to the Dashboard and visualizations documentation for more information.
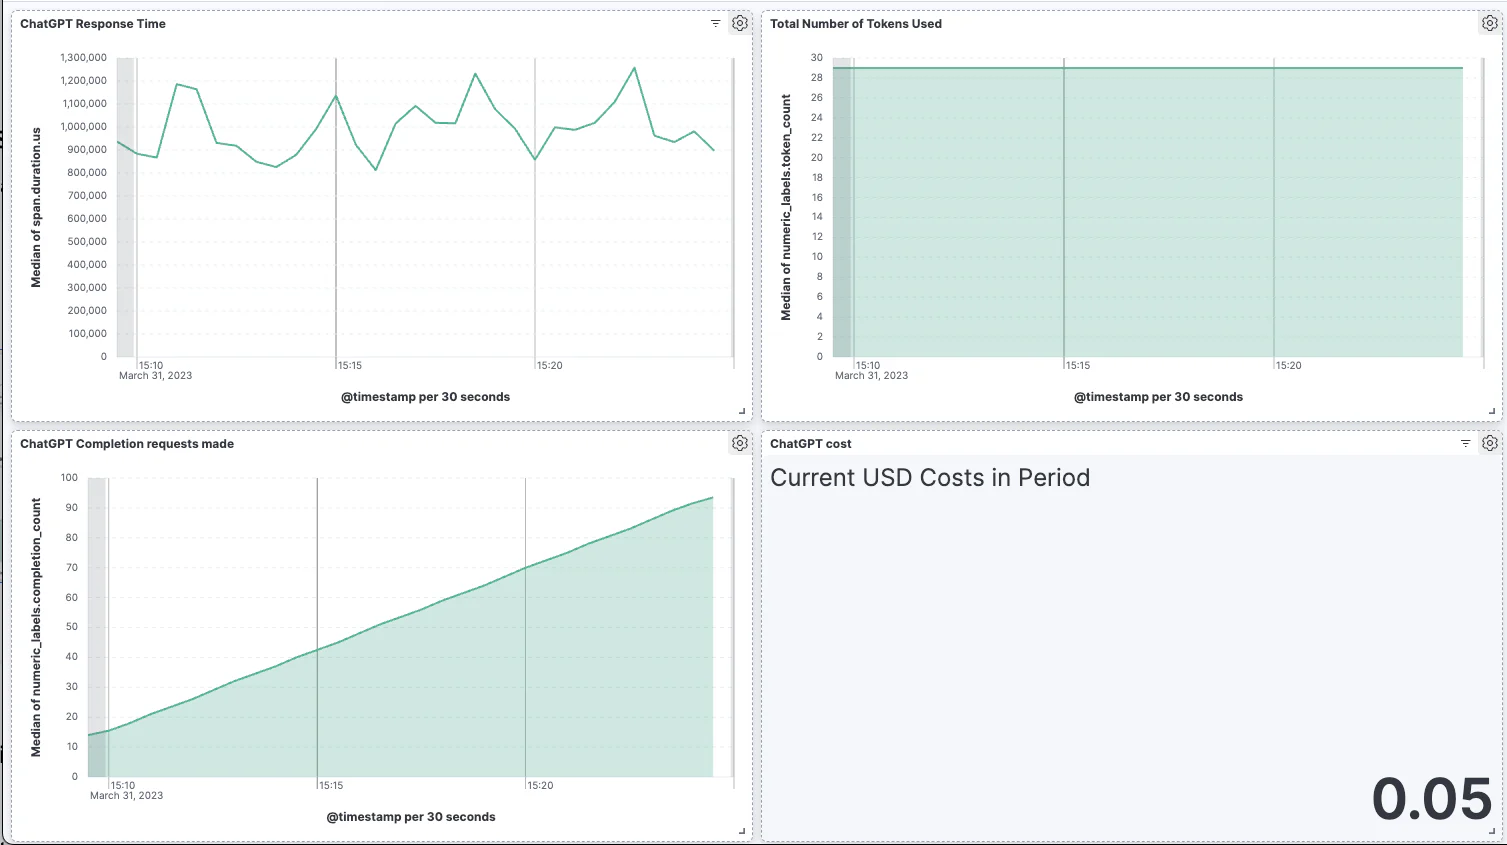
Now that you know how to find and visualize your Azure OpenAI logs and metrics, you’ll want to make sure you’re getting the most out of your data. Elastic has some useful tools to help you do that:
- Alerts: Create threshold rules to notify you when your metrics or logs reach or exceed a specified value: Refer to Metric threshold and Log threshold for more on setting up alerts.
- SLOs: Set measurable targets for your Azure OpenAI service performance based on your metrics. Once defined, you can monitor your SLOs with dashboards and alerts and track their progress against your targets over time. Refer to Service-level objectives (SLOs) for more on setting up and tracking SLOs.
- Machine learning (ML) jobs: Set up ML jobs to find anomalous events and patterns in your Azure OpenAI data. Refer to Finding anomalies for more on setting up ML jobs.