OpenTelemetry integration
editOpenTelemetry integration
editOpenTelemetry is a set of APIs, SDKs, tooling, and integrations that enable the capture and management of telemetry data from your services for greater observability. For more information about the OpenTelemetry project, see the spec.
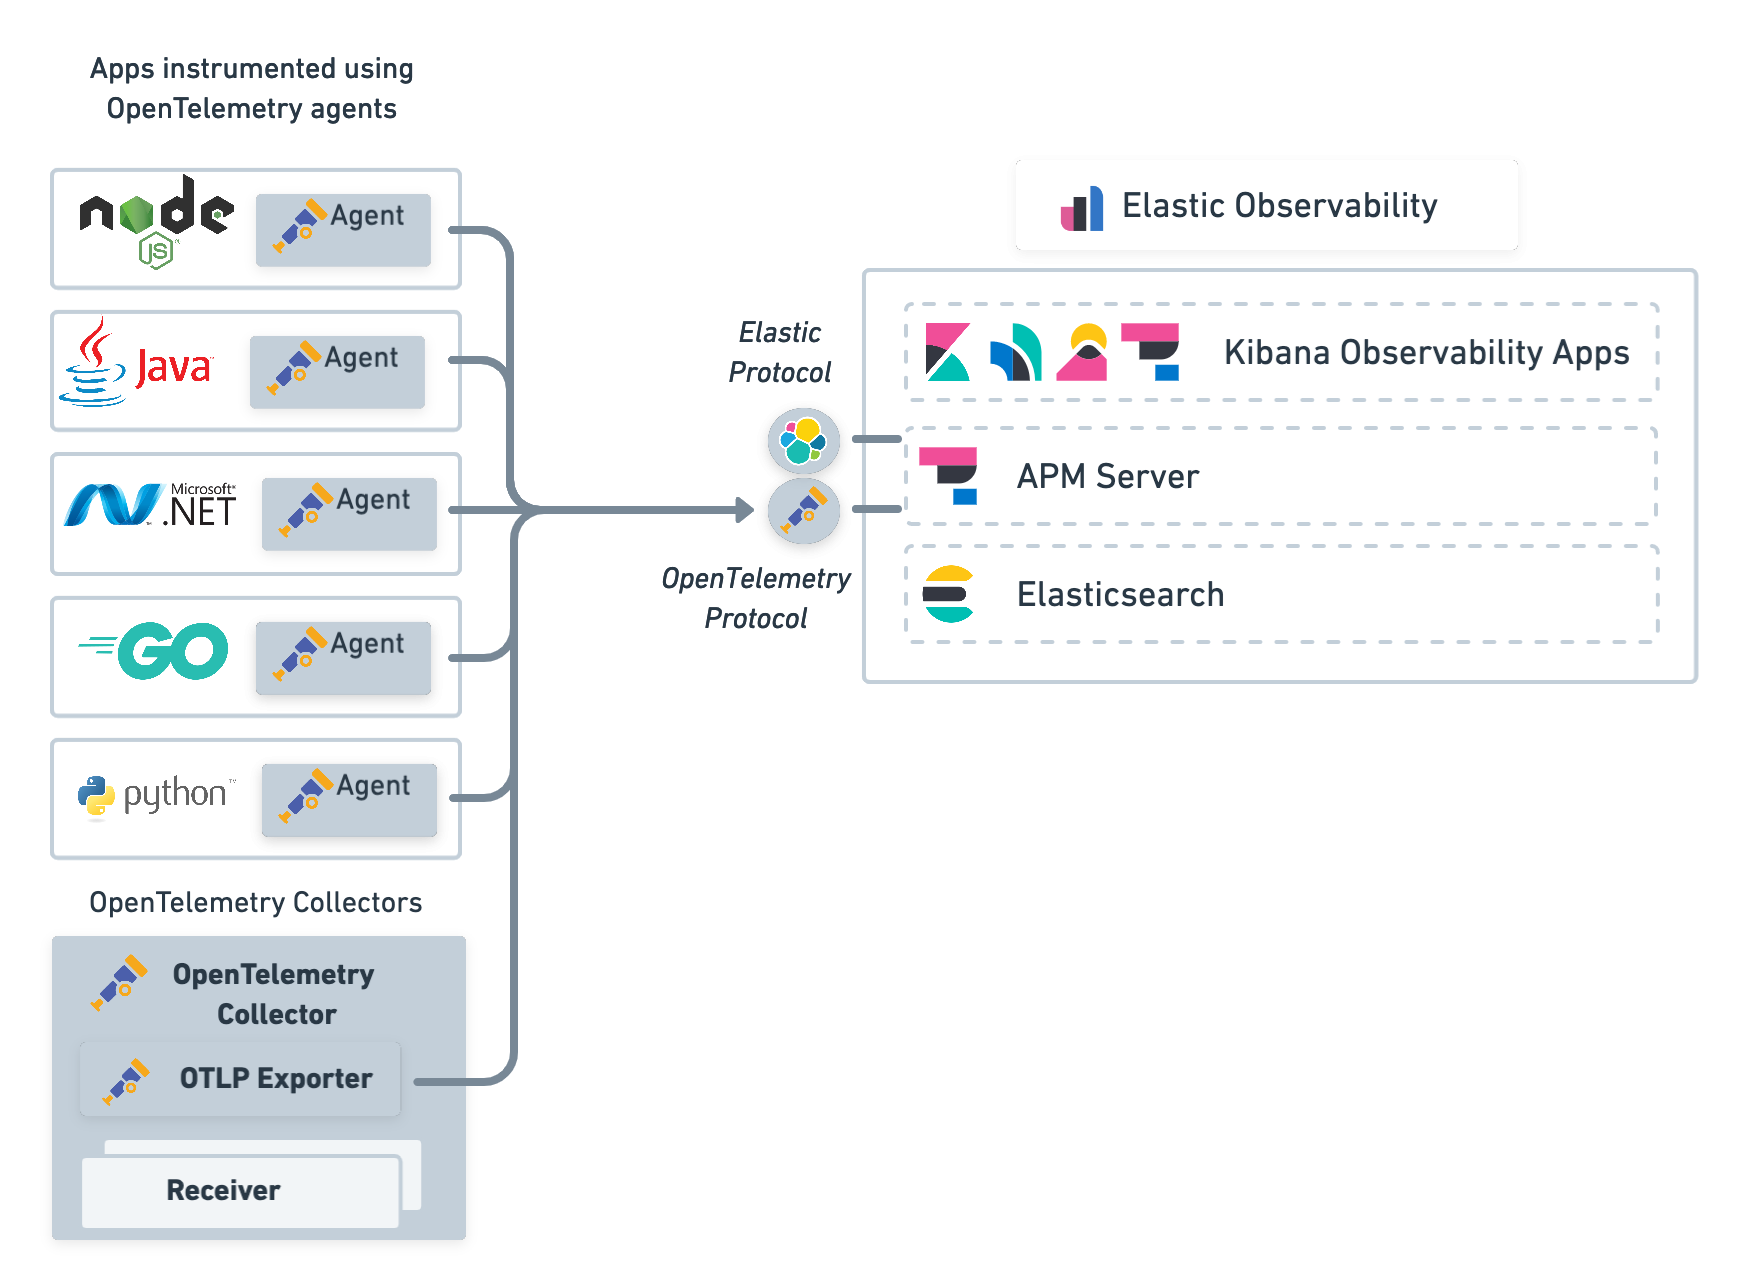
Elastic OpenTelemetry integrations allow you to reuse your existing OpenTelemetry instrumentation to quickly analyze distributed traces and metrics to help you monitor business KPIs and technical components with the Elastic Stack.
APM Server native support of OpenTelemetry protocol
editThe OpenTelemetry Collector exporter for Elastic was deprecated in 7.13 and replaced by the native support of the OpenTelemetry Line Protocol in Elastic Observability (OTLP). To learn more, see migration.
Elastic APM Server natively supports the OpenTelemetry protocol. This means trace data and metrics collected from your applications and infrastructure can be sent directly to Elastic APM Server using the OpenTelemetry protocol.

Instrument applications
editTo export traces and metrics to APM Server, ensure that you have instrumented your services and applications with the OpenTelemetry API, SDK, or both. For example, if you are a Java developer, you need to instrument your Java app using the OpenTelemetry agent for Java.
By defining the following environment variables, you can configure the OTLP endpoint so that the OpenTelemetry agent communicates with APM Server.
export OTEL_RESOURCE_ATTRIBUTES=service.name=checkoutService,service.version=1.1,deployment.environment=production
export OTEL_EXPORTER_OTLP_ENDPOINT=https://apm_server_url:8200
export OTEL_EXPORTER_OTLP_HEADERS="Authorization=Bearer an_apm_secret_token"
java -javaagent:/path/to/opentelemetry-javaagent-all.jar \
     -classpath lib/*:classes/ \
     com.mycompany.checkout.CheckoutServiceServer
|
The service name to identify your application. |
|
APM Server URL. The host and port that APM Server listens for events on. |
|
Authorization header that includes the Elastic APM Secret token or API key: For information on how to format an API key, see our API key docs. Please note the required space between |
|
Certificate for TLS credentials of the gRPC client. (optional) |
You are now ready to collect traces and metrics before verifying metrics and visualizing metrics in Kibana.
Connect OpenTelemetry Collector instances
editUsing the OpenTelemetry collector instances in your architecture, you can connect them to Elastic Observability using the OTLP exporter.
receivers:
  # ...
  otlp:

processors:
  # ...
  memory_limiter:
    check_interval: 1s
    limit_mib: 2000
  batch:

exporters:
  logging:
    loglevel: warn
  otlp/elastic:
    # Elastic APM server https endpoint without the "https://" prefix
    endpoint: "${ELASTIC_APM_SERVER_ENDPOINT}"
    headers:
      # Elastic APM Server secret token
      Authorization: "Bearer ${ELASTIC_APM_SERVER_TOKEN}"

service:
  pipelines:
    traces:
      receivers: [otlp]
      exporters: [logging, otlp/elastic]
    metrics:
      receivers: [otlp]
      exporters: [logging, otlp/elastic]
|
The receivers, such as the OTLP receiver, that forward data emitted by APM agents or the host metrics receiver. |
|
|
We recommend using the Batch processor and also suggest using the memory limiter processor. For more information, see Recommended processors. |
|
|
The logging exporter is helpful for troubleshooting and supports various logging levels: |
|
|
Elastic Observability endpoint configuration. To learn more, see OpenTelemetry Collector > OTLP gRPC exporter. |
|
|
Hostname and port of the APM Server endpoint. For example, |
|
|
Credential for Elastic APM secret token authorization ( |
|
|
Environment-specific configuration parameters can be conveniently passed in as environment variables documented here (e.g. |
When collecting infrastructure metrics, we recommend evaluating Metricbeat to get a mature collector with more integrations and built-in dashboards.
You’re now ready to export traces and metrics from your services and applications.
Collect metrics
editWhen collecting metrics, please note that the DoubleValueRecorder
and LongValueRecorder metrics are not yet supported.
Here’s an example of how to capture business metrics from a Java application.
// initialize metric
Meter meter = GlobalMetricsProvider.getMeter("my-frontend");
DoubleCounter orderValueCounter = meter.doubleCounterBuilder("order_value").build();

public void createOrder(HttpServletRequest request) {

   // create order in the database
   ...
   // increment business metrics for monitoring
   orderValueCounter.add(orderPrice);
}
See the Open Telemetry Metrics API for more information.
Verify OpenTelemetry metrics data
editUse Discover to validate that metrics are successfully reported to Kibana.
-
Launch Kibana:
- Log in to your Elastic Cloud account.
- Navigate to the Kibana endpoint in your deployment.
Point your browser to http://localhost:5601, replacing
localhostwith the name of the Kibana host. - Open the main menu, then click Discover.
-
Select
apm-*as your index pattern. -
Filter the data to only show documents with metrics:
processor.name :"metric" -
Narrow your search with a known OpenTelemetry field. For example, if you have an
order_valuefield, addorder_value: *to your search to return only OpenTelemetry metrics documents.
Visualize in Kibana
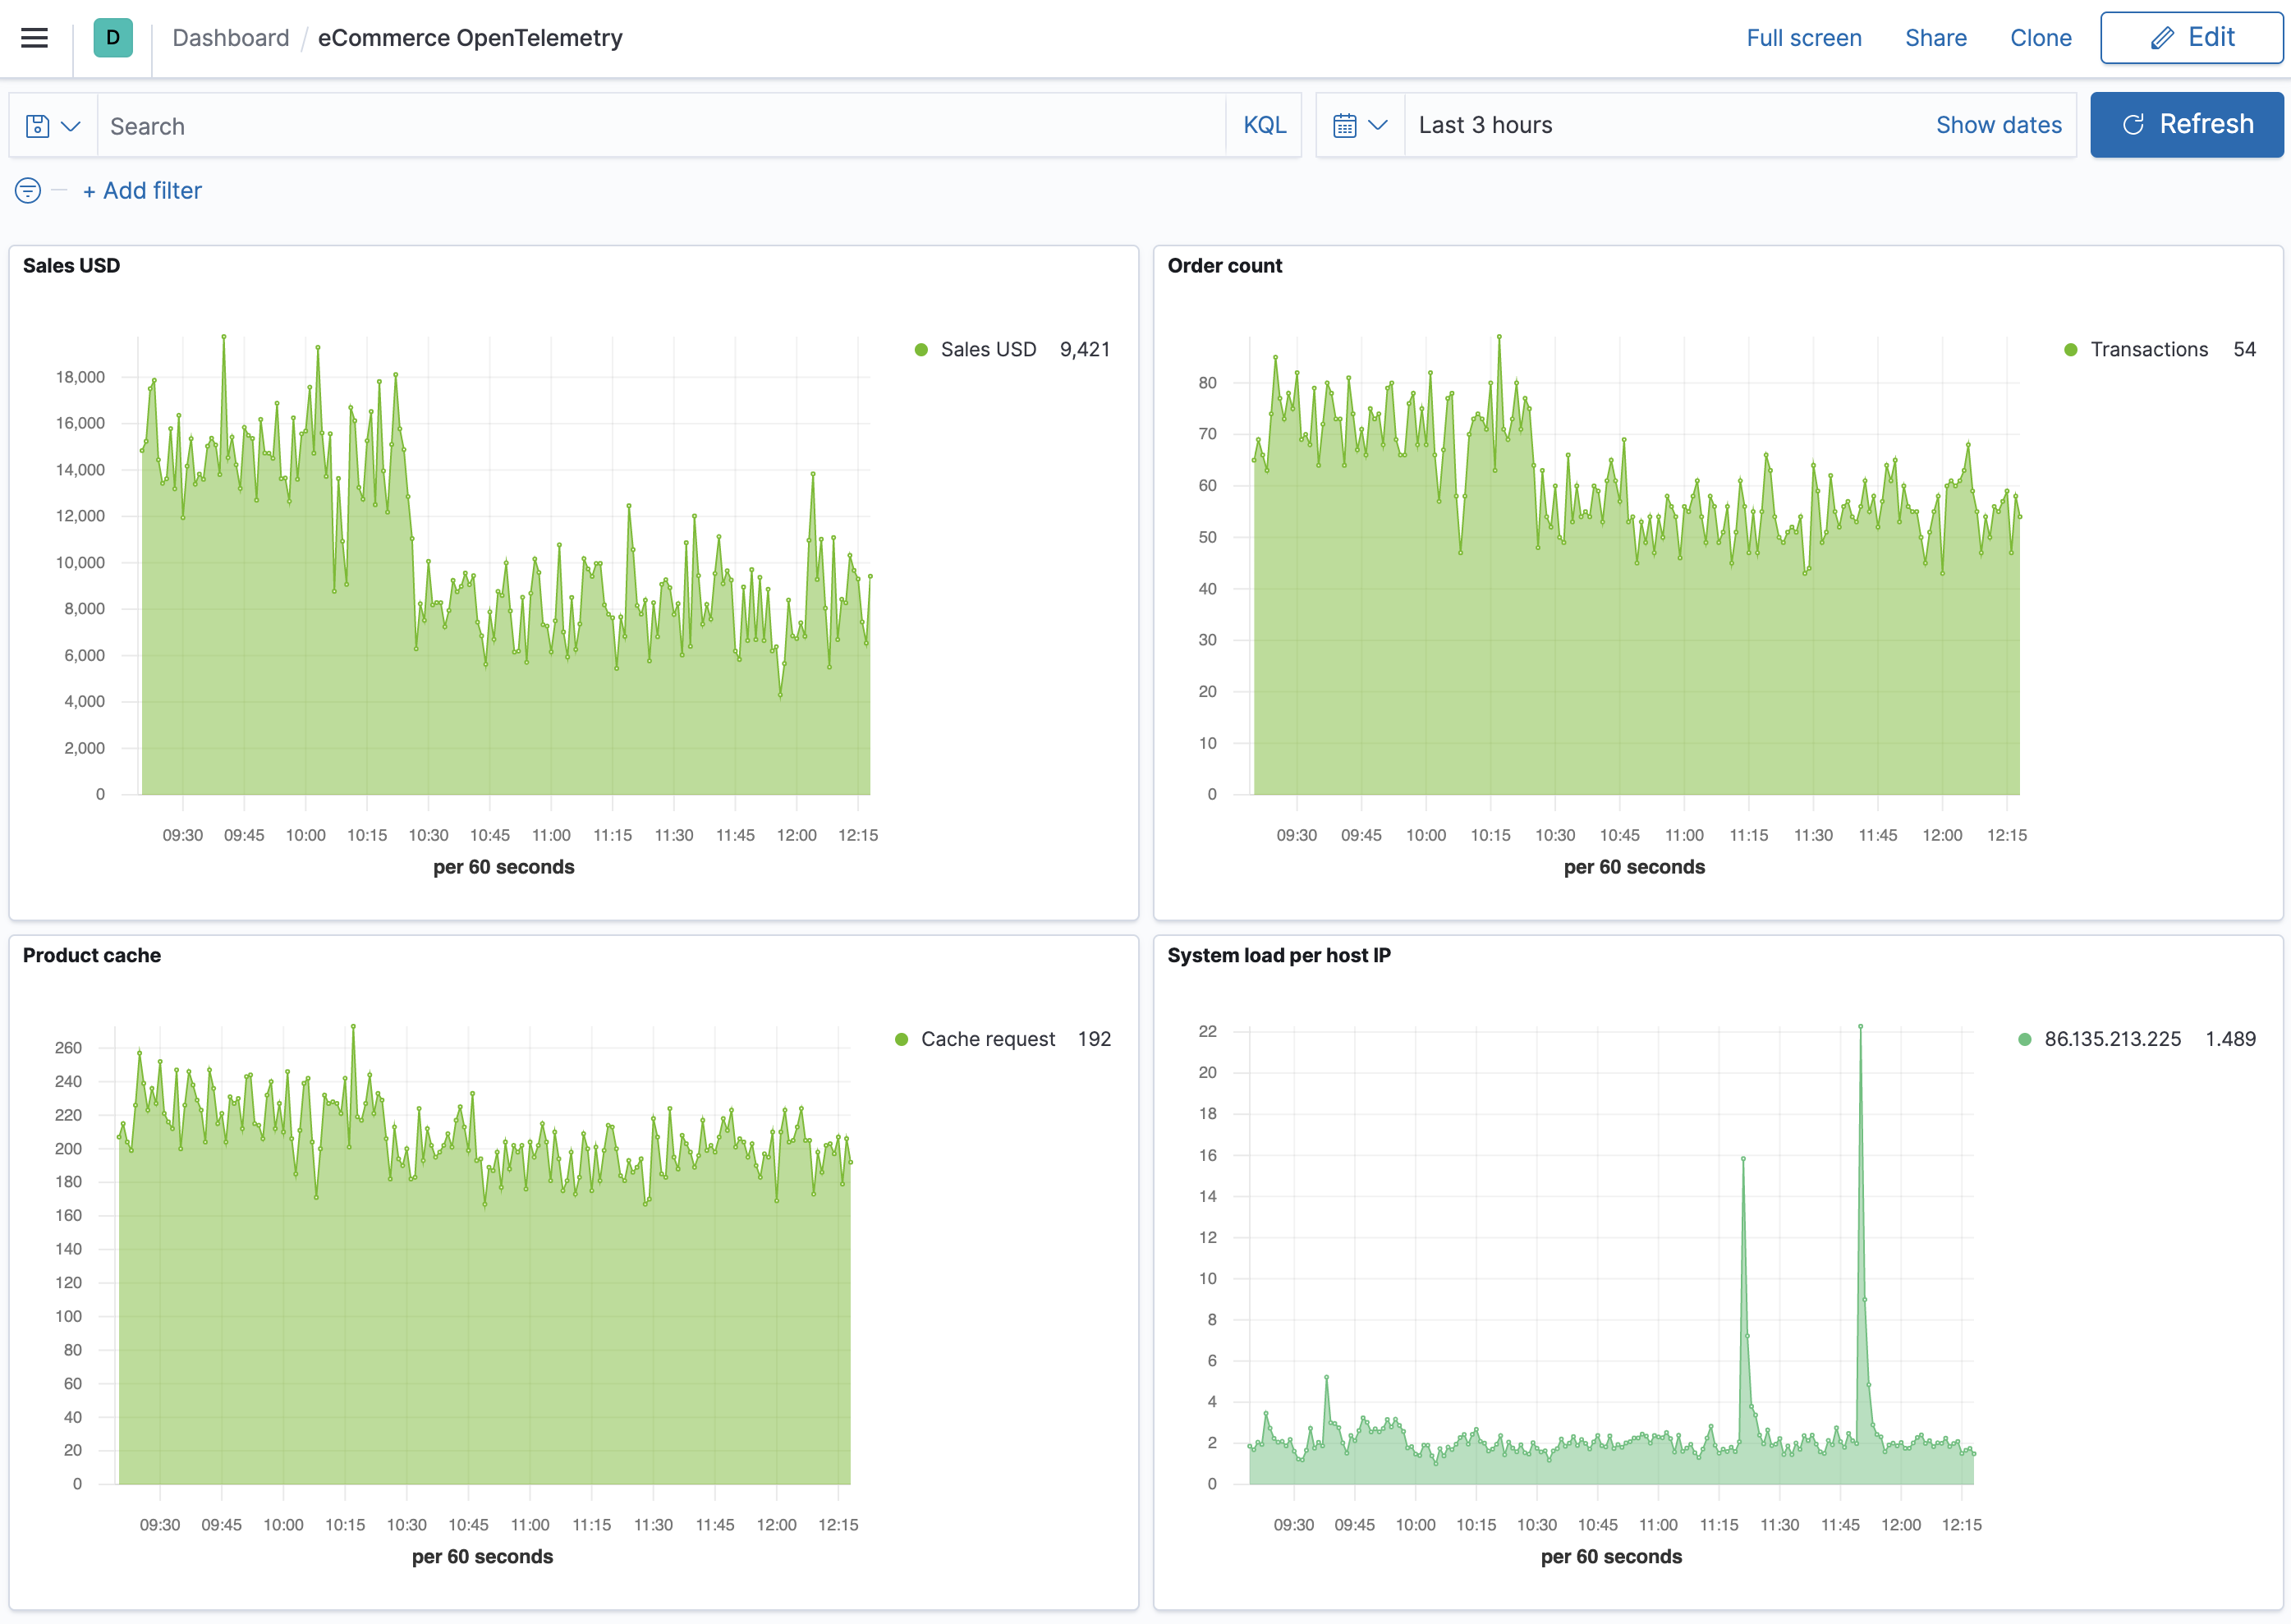
editTSVB within Kibana is the recommended visualization for OpenTelemetry metrics. TSVB is a time series data visualizer that allows you to use the Elasticsearch aggregation framework’s full power. With TSVB, you can combine an infinite number of aggregations to display complex data.
In this example eCommerce OpenTelemetry dashboard, there are four visualizations: sales, order count, product cache, and system load. The dashboard provides us with business KPI metrics, along with performance-related metrics.

Let’s look at how this dashboard was created, specifically the Sales USD and System load visualizations.
- Open the main menu, then click Dashboard.
- Click Create dashboard.
- Click Save, enter the name of your dashboard, and then click Save again.
- Let’s add a Sales USD visualization. Click Edit.
- Click Create new and then select TSVB.
-
For the label name, enter Sales USD, and then select the following:
-
Aggregation:
Positive Rate. -
Field:
order_sum. -
Scale:
auto. -
Group by:
Everything
-
Aggregation:
- Click Save, enter Sales USD as the visualization name, and then click Save and return.
- Now let’s create a visualization of load averages on the system. Click Create new.
- Select TSVB.
-
Select the following:
-
Aggregation:
Average. -
Field:
system.cpu.load_average.1m. -
Group by:
Terms. -
By:
host.ip. -
Top:
10. -
Order by:
Doc Count (default). -
Direction:
Descending.
-
Aggregation:
-
Click Save, enter System load per host IP as the visualization name, and then click Save and return.
Both visualizations are now displayed on your custom dashboard.
By default, Discover shows data for the last 15 minutes. If you have a time-based index and no data displays, you might need to increase the time range.
AWS Lambda Support
editAWS Lambda functions can be instrumented with OpenTelemetry and monitored with Elastic Observability.
To get started, follow the official AWS Distro for OpenTelemetry Lambda getting started documentation and configure the OpenTelemetry Collector to output traces and metrics to your Elastic cluster.
Instrumenting AWS Lambda Java functions
editFor a better startup time, we recommend using SDK-based instrumentation, i.e. manual instrumentation of the code, rather than auto instrumentation.
To instrument AWS Lambda Java functions, follow the official AWS Distro for OpenTelemetry Lambda Support For Java.
Noteworthy configuration elements:
-
AWS Lambda Java functions should extend
com.amazonaws.services.lambda.runtime.RequestHandler,public class ExampleRequestHandler implements RequestHandler<APIGatewayProxyRequestEvent, APIGatewayProxyResponseEvent> { public APIGatewayProxyResponseEvent handleRequest(APIGatewayProxyRequestEvent event, Context context) { // add your code ... } } -
When using SDK-based instrumentation, frameworks you want to gain visibility of should be manually instrumented
-
The below example instruments OkHttpClient with the OpenTelemetry instrument io.opentelemetry.instrumentation:opentelemetry-okhttp-3.0:1.3.1-alpha
import io.opentelemetry.instrumentation.okhttp.v3_0.OkHttpTracing;

OkHttpClient httpClient = new OkHttpClient.Builder()
        .addInterceptor(OkHttpTracing.create(GlobalOpenTelemetry.get()).newInterceptor())
        .build();
-
-
The configuration of the OpenTelemetry Collector, with the definition of the Elastic Observability endpoint, can be added to the root directory of the Lambda binaries (e.g. defined in
src/main/resources/opentelemetry-collector.yaml)# Copy opentelemetry-collector.yaml in the root directory of the lambda function # Set an environment variable 'OPENTELEMETRY_COLLECTOR_CONFIG_FILE' to '/var/task/opentelemetry-collector.yaml' receivers: otlp: protocols: http: grpc: exporters: logging: loglevel: debug otlp/elastic: # Elastic APM server https endpoint without the "https://" prefix endpoint: "${ELASTIC_OTLP_ENDPOINT}" headers: # Elastic APM Server secret token Authorization: "Bearer ${ELASTIC_OTLP_TOKEN}" service: pipelines: traces: receivers: [otlp] exporters: [logging, otlp/elastic] metrics: receivers: [otlp] exporters: [logging, otlp/elastic] -
Configure the AWS Lambda Java function with:
-
Function
layer: The latest AWS
Lambda layer for OpenTelemetry (e.g.
arn:aws:lambda:eu-west-1:901920570463:layer:aws-otel-java-wrapper-ver-1-2-0:1) -
TracingConfig / Mode set to
PassTrough - FunctionConfiguration / Timeout set to more than 10 seconds to support the longer cold start inherent to the Lambda Java Runtime
-
Export the environment variables:
-
AWS_LAMBDA_EXEC_WRAPPER="/opt/otel-proxy-handler"for wrapping handlers proxied through the API Gateway (see here) -
OTEL_PROPAGATORS="tracecontext, baggage"to override the default setting that also enables X-Ray headers causing interferences between OpenTelemetry and X-Ray -
OPENTELEMETRY_COLLECTOR_CONFIG_FILE="/var/task/opentelemetry-collector.yaml"to specify the path to your OpenTelemetry Collector configuration
-
-
Function
layer: The latest AWS
Lambda layer for OpenTelemetry (e.g.
Instrumenting AWS Lambda Java functions with Terraform
editWe recommend using an infrastructure as code solution like Terraform or Ansible to manage the configuration of your AWS Lambda functions.
Here is an example of AWS Lambda Java function managed with Terraform and the AWS Provider / Lambda Functions:
- Sample Terraform code: https://github.com/cyrille-leclerc/my-serverless-shopping-cart/tree/main/checkout-function/deploy
- Note that the Terraform code to manage the HTTP API Gateway (here) is copied from the official OpenTelemetry Lambda sample here
Instrumenting AWS Lambda Node.js functions
editFor a better startup time, we recommend using SDK-based instrumentation for manual instrumentation of the code rather than auto instrumentation.
To instrument AWS Lambda Node.js functions, see AWS Distro for OpenTelemetry Lambda Support For JS.
The configuration of the OpenTelemetry Collector, with the definition of the Elastic Observability endpoint, can be added to the root directory of the Lambda binaries: src/main/resources/opentelemetry-collector.yaml.
# Copy opentelemetry-collector.yaml in the root directory of the lambda function
# Set an environment variable 'OPENTELEMETRY_COLLECTOR_CONFIG_FILE' to '/var/task/opentelemetry-collector.yaml'
receivers:
  otlp:
    protocols:
      http:
      grpc:

exporters:
  logging:
    loglevel: debug
  otlp/elastic:
    # Elastic APM server https endpoint without the "https://" prefix
    endpoint: "${ELASTIC_OTLP_ENDPOINT}"
    headers:
      # Elastic APM Server secret token
      Authorization: "Bearer ${ELASTIC_OTLP_TOKEN}"

service:
  pipelines:
    traces:
      receivers: [otlp]
      exporters: [logging, otlp/elastic]
    metrics:
      receivers: [otlp]
      exporters: [logging, otlp/elastic]
|
Environment-specific configuration parameters can be conveniently passed in as environment variables: |
Configure the AWS Lambda Node.js function:
-
Function
layer: The latest AWS
Lambda layer for OpenTelemetry. For example,
arn:aws:lambda:eu-west-1:901920570463:layer:aws-otel-nodejs-ver-0-23-0:1) -
TracingConfig / Mode set to
PassTrough - FunctionConfiguration / Timeout set to more than 10 seconds to support the cold start of the Lambda JS Runtime
-
Export the environment variables:
-
AWS_LAMBDA_EXEC_WRAPPER="/opt/otel-handler"for wrapping handlers proxied through the API Gateway. See enable auto instrumentation for your lambda-function. -
OTEL_PROPAGATORS="tracecontext"to override the default setting that also enables X-Ray headers causing interferences between OpenTelemetry and X-Ray -
OPENTELEMETRY_COLLECTOR_CONFIG_FILE="/var/task/opentelemetry-collector.yaml"to specify the path to your OpenTelemetry Collector configuration -
OTEL_EXPORTER_OTLP_ENDPOINT="http://localhost:55681/v1/traces"this environment variable is required to be set until PR #2331 is merged and released. -
OTEL_TRACES_SAMPLER="AlwaysOn"define the required sampler strategy if it is not sent from the caller. Note thatAlways_oncan potentially create a very large amount of data, so in production set the correct sampling configuration, as per the specification.
-
Instrumenting AWS Lambda Node.js functions with Terraform
editTo manage the configuration of your AWS Lambda functions, we recommend using an infrastructure as code solution like Terraform or Ansible.
Here is an example of AWS Lambda Node.js function managed with Terraform and the AWS Provider / Lambda Functions:
Limitations in 7.13
editOpenTelemetry traces
edit-
Traces of applications using
messagingsemantics might be wrongly displayed or not shown in the APM UI. You may only seespanscoming from such services, but notransaction#5094 - Inability to see Stack traces in spans or, in general, arbitrary span events for applications instrumented with OpenTelemetry #4715
- Inability in APM views to view the "Time Spent by Span Type" #5747
- Metrics derived from traces (throughput, latency, and errors) are not accurate when traces are sampled before being ingested by Elastic Observability (ie by an OpenTelemetry Collector or OpenTelemetry APM agent or SDK) #472
OpenTelemetry metrics
edit-
OpenTelemetry histogram metrics,
DoubleValueRecorderandLongValueRecorder, are not yet supported #3195 - Inability to see JVM metrics in Elastic APM UI for Java applications instrumented with OpenTelemetry #4919
- Inability to see host metrics in Elastic Metrics Infrastructure view when using the OpenTelemetry Collector host metrics receiver #5310