Canvas
Showcase your data, live & pixel‑perfect
You've arrived at your creative space for live Elasticsearch data. Play with color palettes, add your own CSS elements, drag and drop assets — and turn your presentations and reports into dynamic, infographic-style works of art.
Getting started with Elasticsearch: Store, search, and analyze with the open source Elastic Stack.
Watch videoIntro to ELK: Get started with logs, metrics, data ingestion and custom visualizations in Kibana.
Watch videoGetting started with Elastic Cloud: Launch your first deployment.
Learn moreCustomize
Express your data, your way
Turn your data into one-of-a-kind, dynamic dashboards featuring the logos, colors, and design elements that define your brand. Whether you're working with infrastructure logs, security events, application metrics, or data from your hobby Arduino project, Elastic Canvas gives you creative control. From simple to stylized, two-toned to technicolor, watch your data take shape in a way that moves you.
Bonus: Canvas features ship for free in Kibana.

Inspire
From the usual to the unexpected
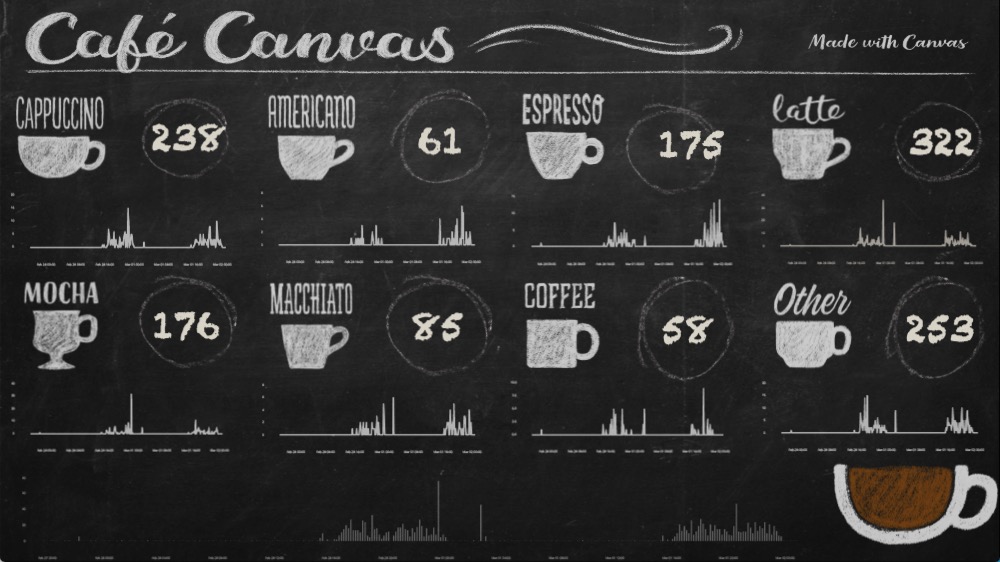
Life doesn't follow a template. Canvas is flexible so you can break from the rigidity of a grid and bring to life the delightful things that matter. Think yellow submarines, purple rain, blackbirds — or whatever speaks to you. Everything is a data point.

Present
Big ideas on the big screen
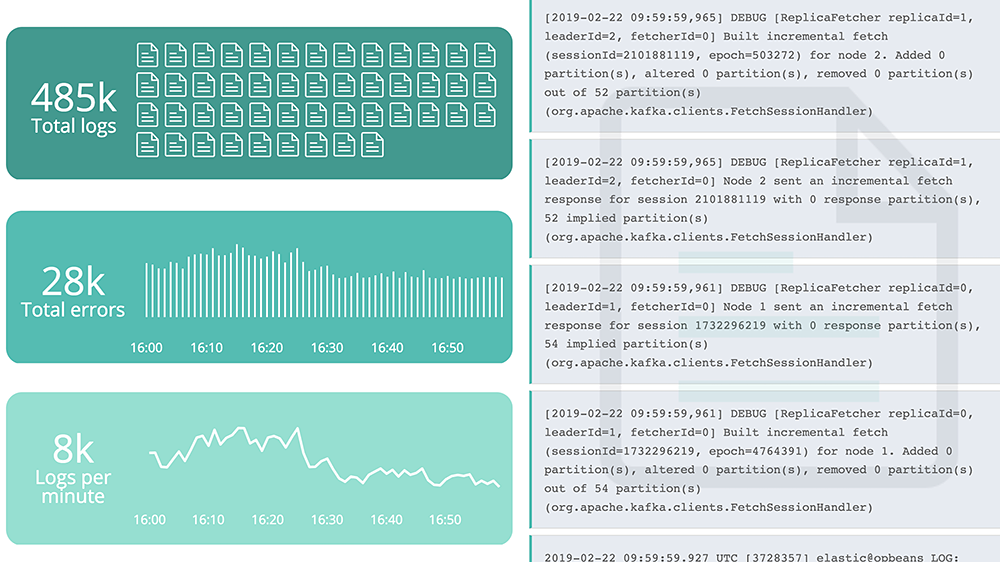
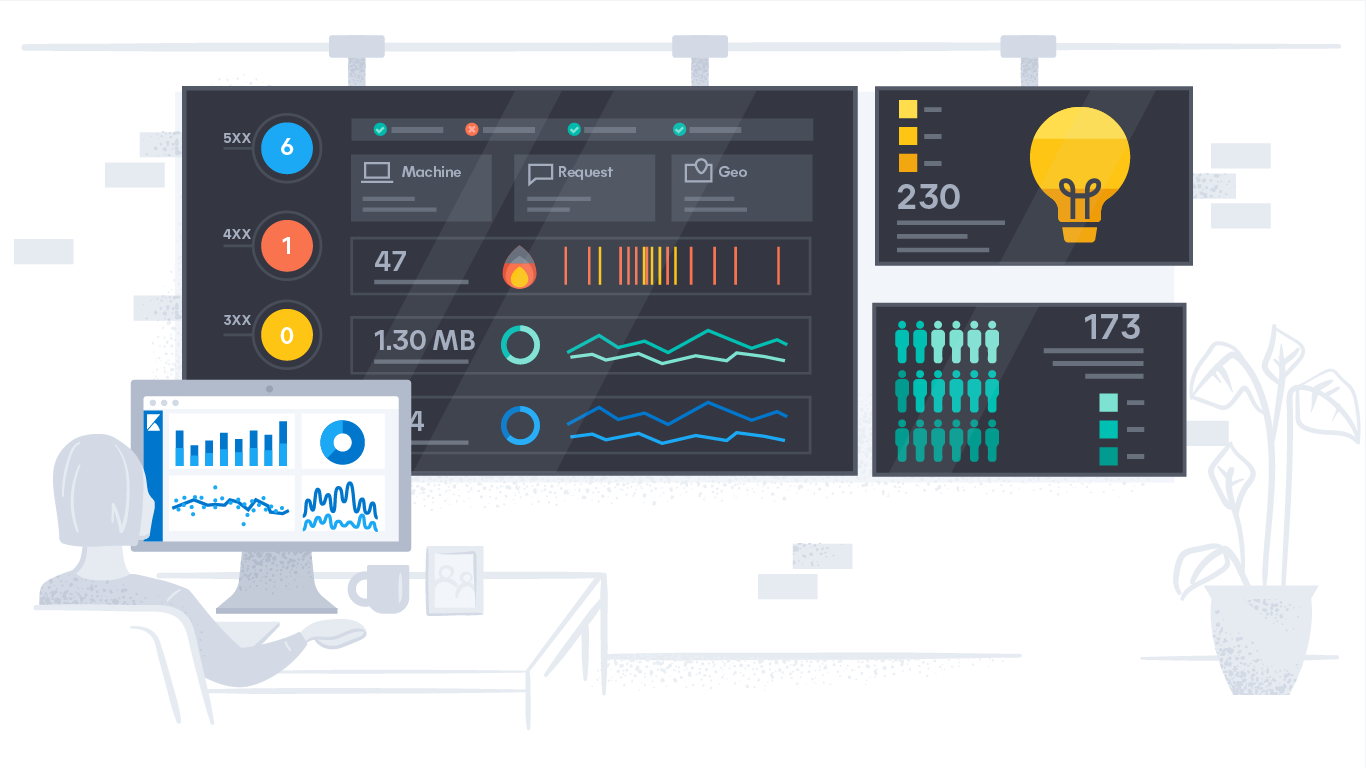
Present Elasticsearch data in a way that tells your company's story — whether it's presenting flight statistics at an airport kiosk or reviewing auth logs in a conference room. Keep your team engaged with beautiful, real-time displays featuring social analytics, user engagement, operational analytics, KPIs, or any data really. Plus, take your visualizations outside of Kibana — Canvas shareables enable you to embed static workpads directly into HTML sites.

Report
Brand, automate, celebrate
Are the generic charts in your weekly emails starting to blur together? Create branded reports with custom elements that your team will look forward to opening. Build your reports once and watch them automatically ship with the latest weekly, monthly, or annual data. Goodbye copy-paste.
SQL
SELECT away
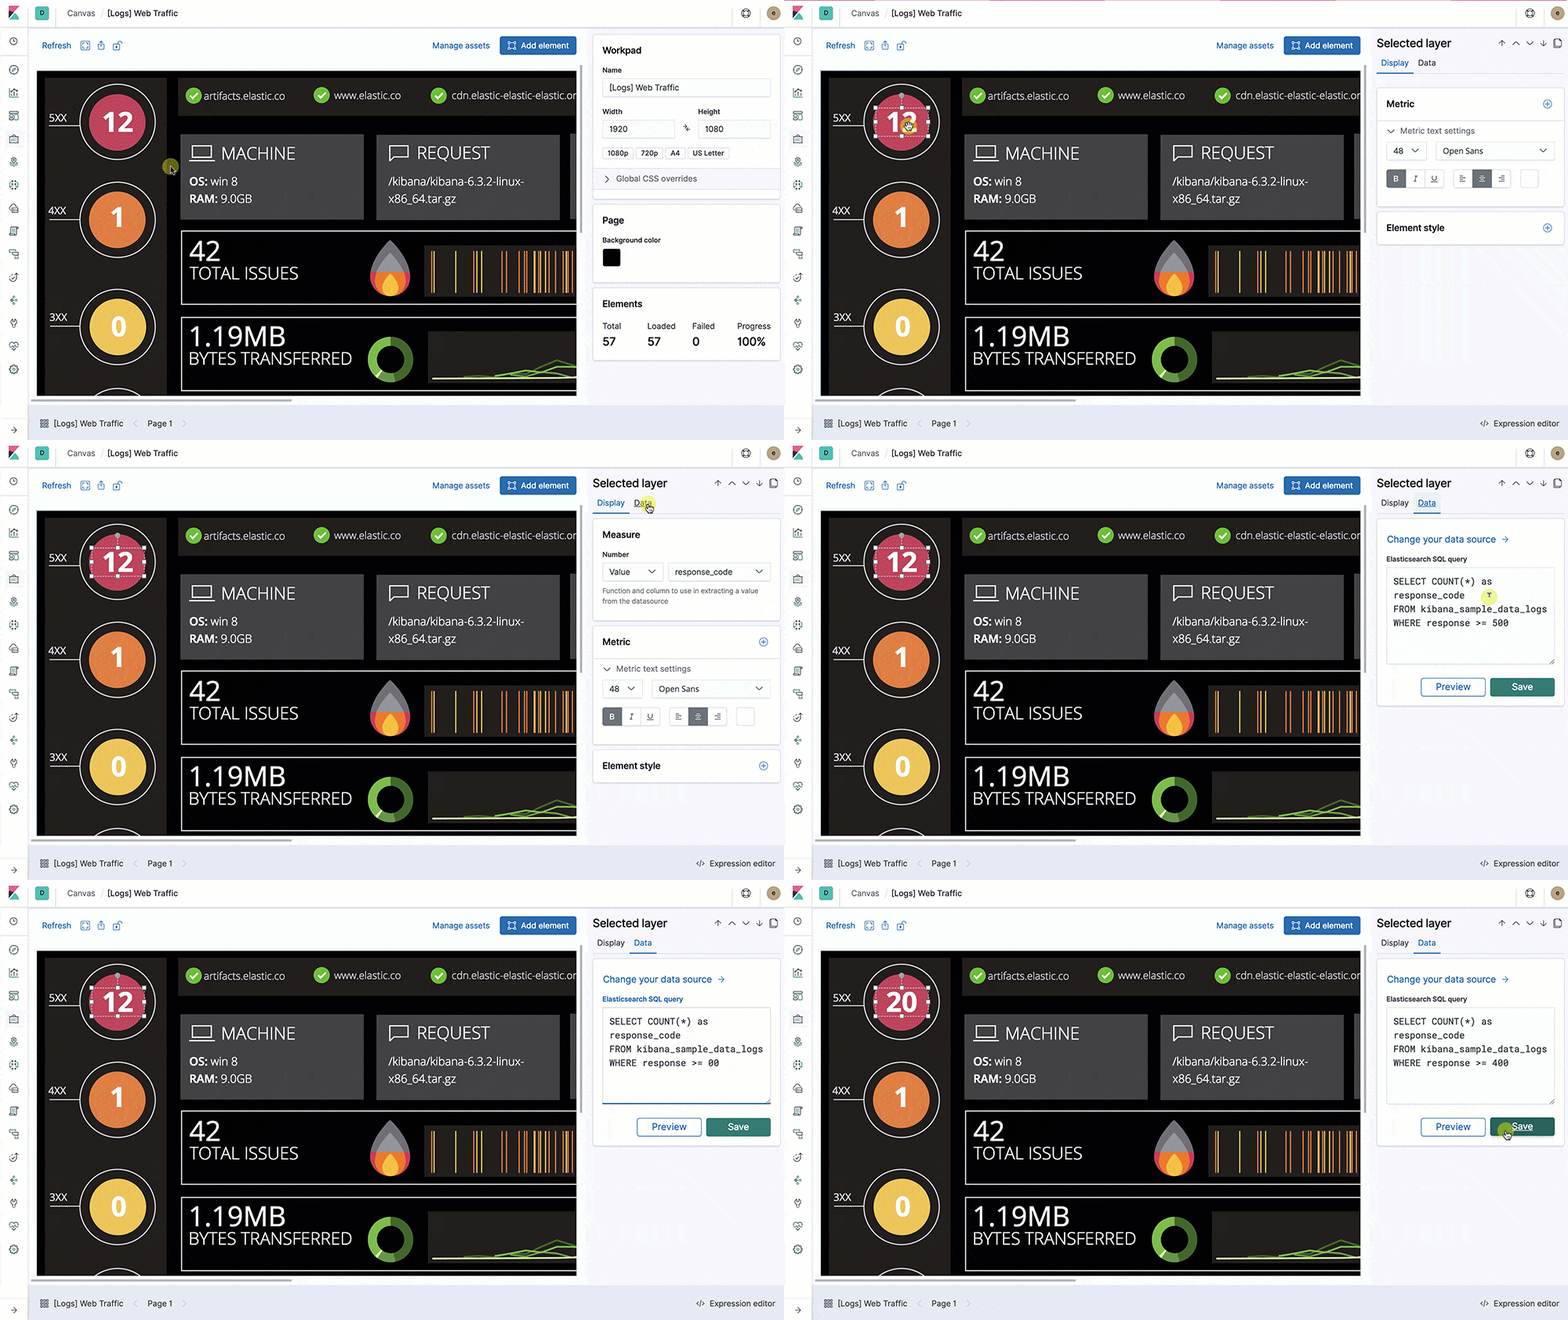
Canvas has full support for Elasticsearch SQL query syntax so you can enjoy the rush of typing SELECT and watching the magic happen. Use Elasticsearch SQL to build aggregations and shape your data within Canvas — then use that familiar syntax for metrics, time series visualizations, infographics, and beyond.

Extend
More than a pretty face
Superficial beauty isn’t how we do things. So what gives Canvas its depth? For starters, a pipeline-based, function-rich expression language with Monaco as its expression editor. With features like darkmode styling, syntax highlighting, and context-sensitive help with mouseover, your experience with Canvas is made beautiful from the inside out. Add our JavaScript-agnostic plugin framework to the mix and you've got boundless customization options. Extending Canvas with plugins is possible for everyone — from copy/paste coders to hardcore devs.
Already have visuals built in Kibana Lens or Elastic Maps? No problem. Add them directly to a Canvas workpad in three easy clicks.

Watch
Elasticsearch data comes to life
Streaming data into Elasticsearch from a slot car track, Rashid demonstrates how simple SQL expressions can help create live visualizations in Canvas.
