OpenTelemetry Articles

Network monitoring with Elastic: Unifying network observability
Learn how to unify network monitoring using Elastic observability and AI. We'll showcase how to correlate network data, identify root causes and fix issues.
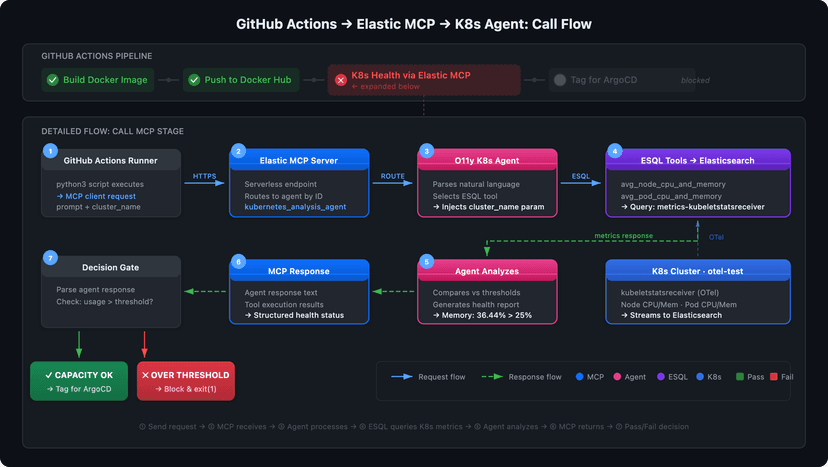
Agentic CI/CD: Kubernetes Deployment Gates with Elastic MCP Server
Deploy agentic CI/CD gates with Elastic MCP Server. Integrate AI agents into GitHub Actions to monitor K8s health and improve deployment reliability via Observability (O11y)
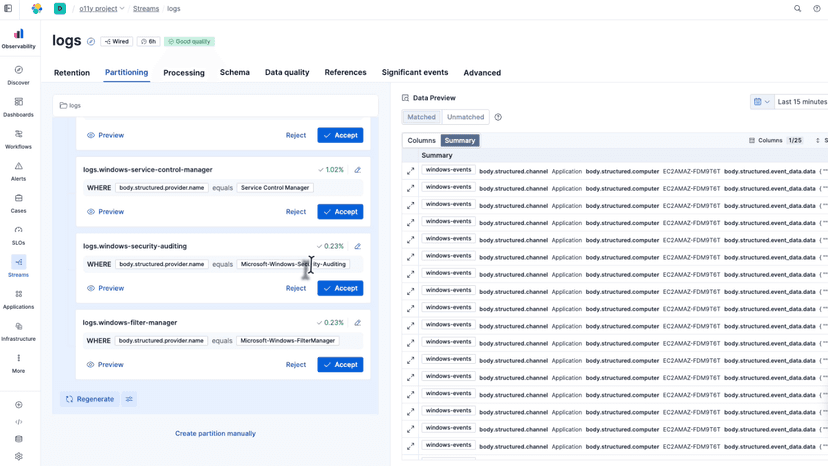
Windows Event Log Monitoring with OpenTelemetry & Elastic Streams
Learn how to enhance Windows Event Log monitoring with OpenTelemetry for standardized ingestion and Elastic Streams for smart partitioning and analysis.

Scale testing OpenTelemetry log ingestion on GCP with EDOT Cloud Forwarder
Learn how we load tested the EDOT Cloud Forwarder for GCP on Google Cloud Run and identified practical capacity limits per instance. We show how runtime tuning improves stability and translate the results into concrete configuration and scaling guidance.

Using Elastic Agent Builder & OpenTelemetry to Observe Devices
Learn how to use Elastic Agent Builder and OpenTelemetry to build IoT observability and gain insights into your appliance usage patterns and efficiency.

Elastic's metrics analytics gets 5x faster
Explore Elastic's metrics analytics enhancements, including faster ES|QL queries, TSDS updates and OpenTelemetry exponential histogram support.

A train ride away from a million events per second with EDOT Cloud Forwarder
EDOT Cloud Forwarder for AWS from Elastic Observability is now Generally Available. Deploying EDOT Cloud Forwarder and reliably handling one million events per second with zero intervention, zero data loss, and zero idle cost.
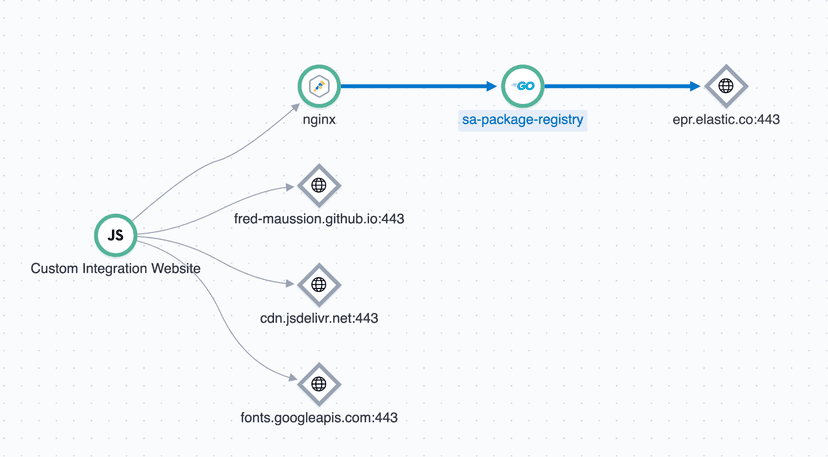
A Practical Guide to end-to-end distributed tracing for Nginx with OpenTelemetry in Elastic
Instrument Nginx with the OpenTelemetry tracing module and export spans to Elastic Observability's APM for full end-to-end distributed tracing.

Accelerate Otel Adoption with Elastic Agent Hybrid Ingestion
Elastic Agent 9.2 brings hybrid ingestion to Elastic Observability, unifying native integrations and OpenTelemetry receivers to simplify large-scale OTel adoption without disruption.

TLS Certificate Monitoring with the OpenTelemetry Collector
Learn how to monitor TLS certificate expiration in Kubernetes clusters using the OpenTelemetry Collector, ensuring comprehensive visibility into both external and internal certificates, using Elastic Observability

Find answers quickly, correlate OpenTelemetry traces with existing ECS logs in Elastic Observability
In this blog we will discuss how EDOT enables you to collect existing ECS logs while ensuring a seamless and transparent move to OTel semantic conventions. The key benefit is that applications can continue sending logs as they do today, which minimizes the effort and impact on application developers.

EDOT SDK central configuration using OpAmp in Elastic Observability
Learn how to configure the Elastic Distributions of OpenTelemetry (EDOT) SDKs centrally via the EDOT Collector using OpAmp in Elastic Observability at scale.