Elasticsearch allows you to index data quickly and in a flexible manner. Try it free in the cloud or run it locally to see how easy indexing can be.
In this article, we show how to integrate Apache Kafka with Elasticsearch for data ingestion and indexing. We will provide an overview of Kafka, its concept of producers and consumers, and we will create a logs index where messages will be received and indexed through Apache Kafka. The project is implemented in Python, and the code is available on GitHub.
Prerequisites
- Docker and Docker Compose: Ensure you have Docker and Docker Compose installed on your machine.
- Python 3.x: To run the Producer and Consumer scripts.
Introduction to Apache Kafka
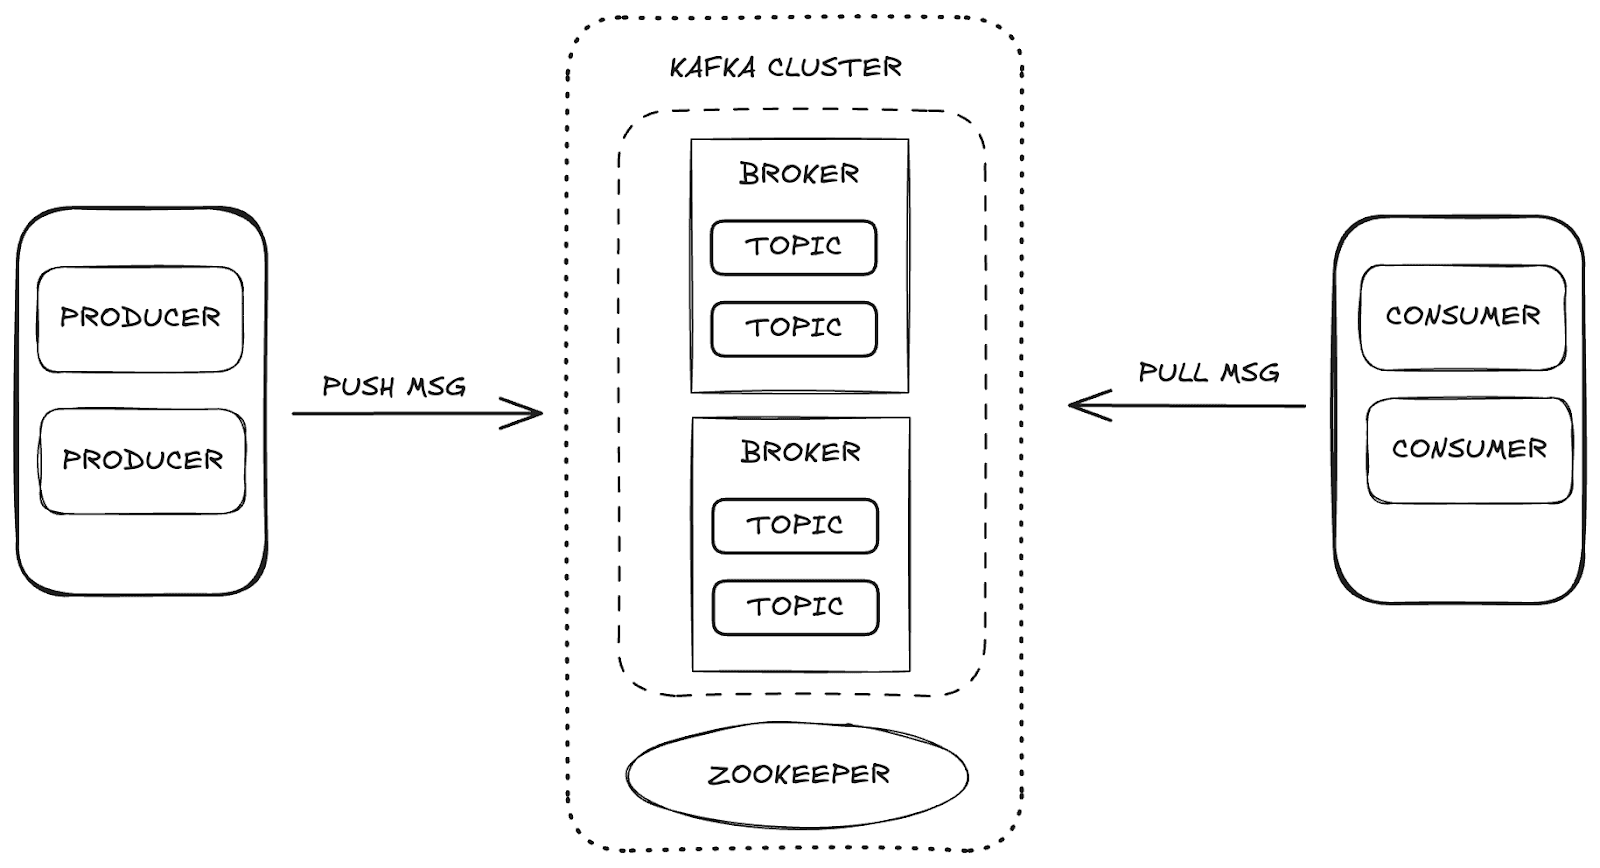
Apache Kafka is a distributed streaming platform that enables high scalability and availability, as well as fault tolerance. In Kafka, data management occurs through the main components:
- Broker: responsible for storing and distributing messages between producers and consumers.
- Zookeeper: manages and coordinates the Kafka brokers, controlling the state of the cluster, partition leaders, and consumer information.
- Topics: channels where data is published and stored for consumption.
- Consumers and Producers: while producers send data to the topics, consumers retrieve that data.

These components work together to form the Kafka ecosystem, providing a robust framework for data streaming.
Project structure
To understand the data ingestion process, we divided it into stages:
- Infrastructure Provisioning: setting up the Docker environment to support Kafka, Elasticsearch, and Kibana.
- Producer Creation: implementing the Kafka Producer, which sends data to the logs topic.
- Consumer Creation: developing the Kafka Consumer to read and index messages in Elasticsearch.
- Ingestion Validation: verifying and validating the sent and consumed data.
Infrastructure configuration with Docker Compose
We utilized Docker Compose to configure and manage the necessary services. Below, you will find the Docker Compose code that sets up each service required for the integration of Apache Kafka, Elasticsearch, and Kibana, ensuring a data ingestion process.
You can access the file directly from the Elasticsearch Labs GitHub repo.
Data sending with the Kafka Producer
The producer is responsible for sending messages to the logs topic. By sending messages in batches, it increases network usage efficiency, allowing optimizations with the batch_size and linger_ms settings, which control the quantity and latency of the batches, respectively. The configuration acks='all' ensures that messages are stored durably, which is essential for important log data.
When starting the producer, messages are sent in batches to the topic, as shown below:
Consumption and indexing of data with the Kafka Consumer
The consumer is designed to process messages efficiently, consuming batches from the logs topic and indexing them into Elasticsearch. With auto_offset_reset='latest', it ensures that the consumer starts processing the most recent messages, ignoring the older ones, and max_poll_records=10 limits the batch to 10 messages. With fetch_max_wait_ms=2000, the consumer waits up to 2 seconds to accumulate enough messages before processing the batch.
In its main loop, the consumer consumes log messages, processes, and indexes each batch into Elasticsearch, ensuring continuous data ingestion.
Visualizing data in Kibana
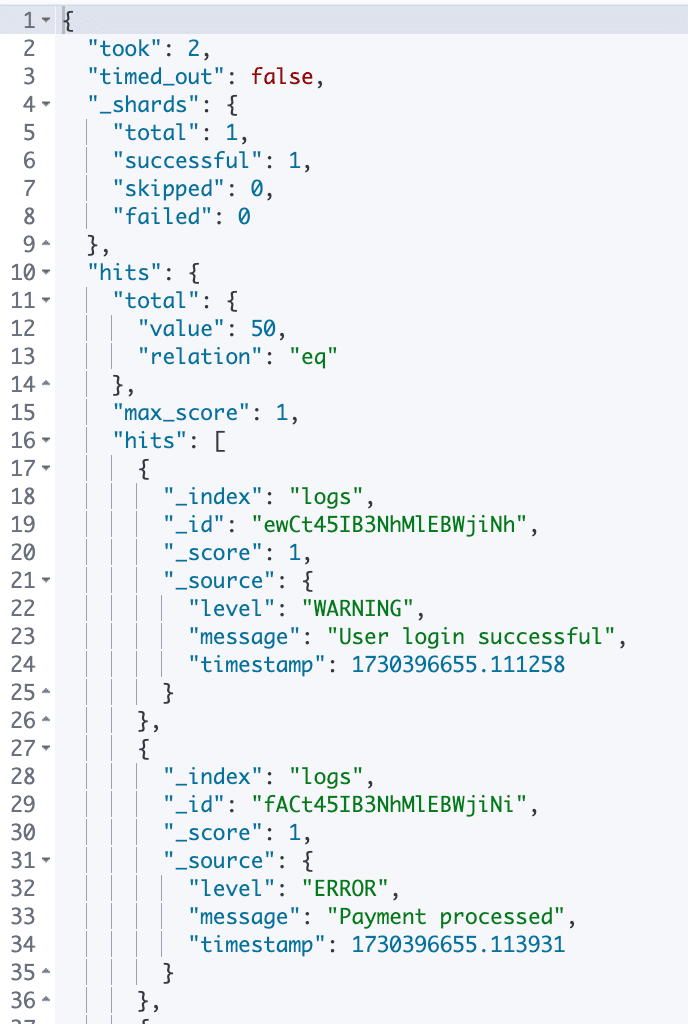
With Kibana, we can explore and validate the data ingested from Kafka and indexed in Elasticsearch. By accessing Dev Tools in Kibana, you can view the indexed messages and confirm that the data is as expected. For example, if our Kafka producer sent 5 batches of 10 messages each, we should see a total of 50 records in the index.
To verify the data, you can use the following query in the Dev Tools section:
Response:

Additionally, Kibana provides the ability to create visualizations and dashboards that can help make the analysis more intuitive and interactive. Below, you can see some examples of the dashboards and visualizations we created, which illustrate the data in various formats, enhancing our understanding of the information processed.

Data ingestion with Kafka Connect
Kafka Connect is a service designed to facilitate integration between data sources and destinations (sinks), such as databases or file systems. It operates with predefined connectors that handle data movement automatically. In our case, Elasticsearch functions as the data sink.

Using Kafka Connect, we can simplify the data ingestion process, eliminating the need to manually implement the data ingestion workflow into Elasticsearch. With the appropriate connector, Kafka Connect allows data sent to a Kafka topic to be directly indexed in Elasticsearch with minimal setup and no additional coding required.
Working with Kafka Connect
To implement Kafka Connect, we’ll add the kafka-connect service to our Docker Compose setup. A key part of this configuration is installing the Elasticsearch connector, which will handle data indexing.
After configuring the service and creating the Kafka Connect container, a configuration file for the Elasticsearch connector will be needed. This file defines essential parameters such as:
connection.url: Connection URL for Elasticsearch.topics: The Kafka topic the connector will monitor (in this case, "logs").type.name: Document type in Elasticsearch (typically _doc).value.converter: Converts Kafka messages to JSON format.value.converter.schemas.enable: Specifies whether the schema should be included.schema.ignoreandkey.ignore: Settings to ignore Kafka schemas and keys during indexing.
Below is the curl command to create the Elasticsearch connector in Kafka Connect:
With this configuration, Kafka Connect will automatically begin ingesting data sent to the "logs" topic and indexing it in Elasticsearch. This approach allows for fully automated data ingestion and indexing without requiring additional coding, thereby simplifying the entire integration process.
Conclusion
Integrating Kafka and Elasticsearch creates a powerful pipeline for real-time data ingestion and analysis. This guide provides a foundational approach for building a robust data ingestion architecture, with seamless visualization and analysis in Kibana, ready to adapt to more complex requirements in the future.
Furthermore, using Kafka Connect makes the integration between Kafka and Elasticsearch even more streamlined, eliminating the need for additional code to process and index data. Kafka Connect enables data sent to a specific topic to be automatically indexed in Elasticsearch with minimal configuration.


