创建基于时间序列的可视化控件
edit创建基于时间序列的可视化控件
edit本教程会使用来自 Metricbeat 的时间序列数据为您演示 Timelion 所能提供的功能。您可以先下载 Metricbeat 并根据这个说明在本地抽取数据。
第一个可视化控件将会对比系统用户空间 CPU 实时使用百分比和其每小时的平均偏移量。为了创建这个控件,我们需要创建两个 Timelion 表达式。第一个是实时的 system.cpu.user.pct 平均值,第二个是每小时的平均偏移量。
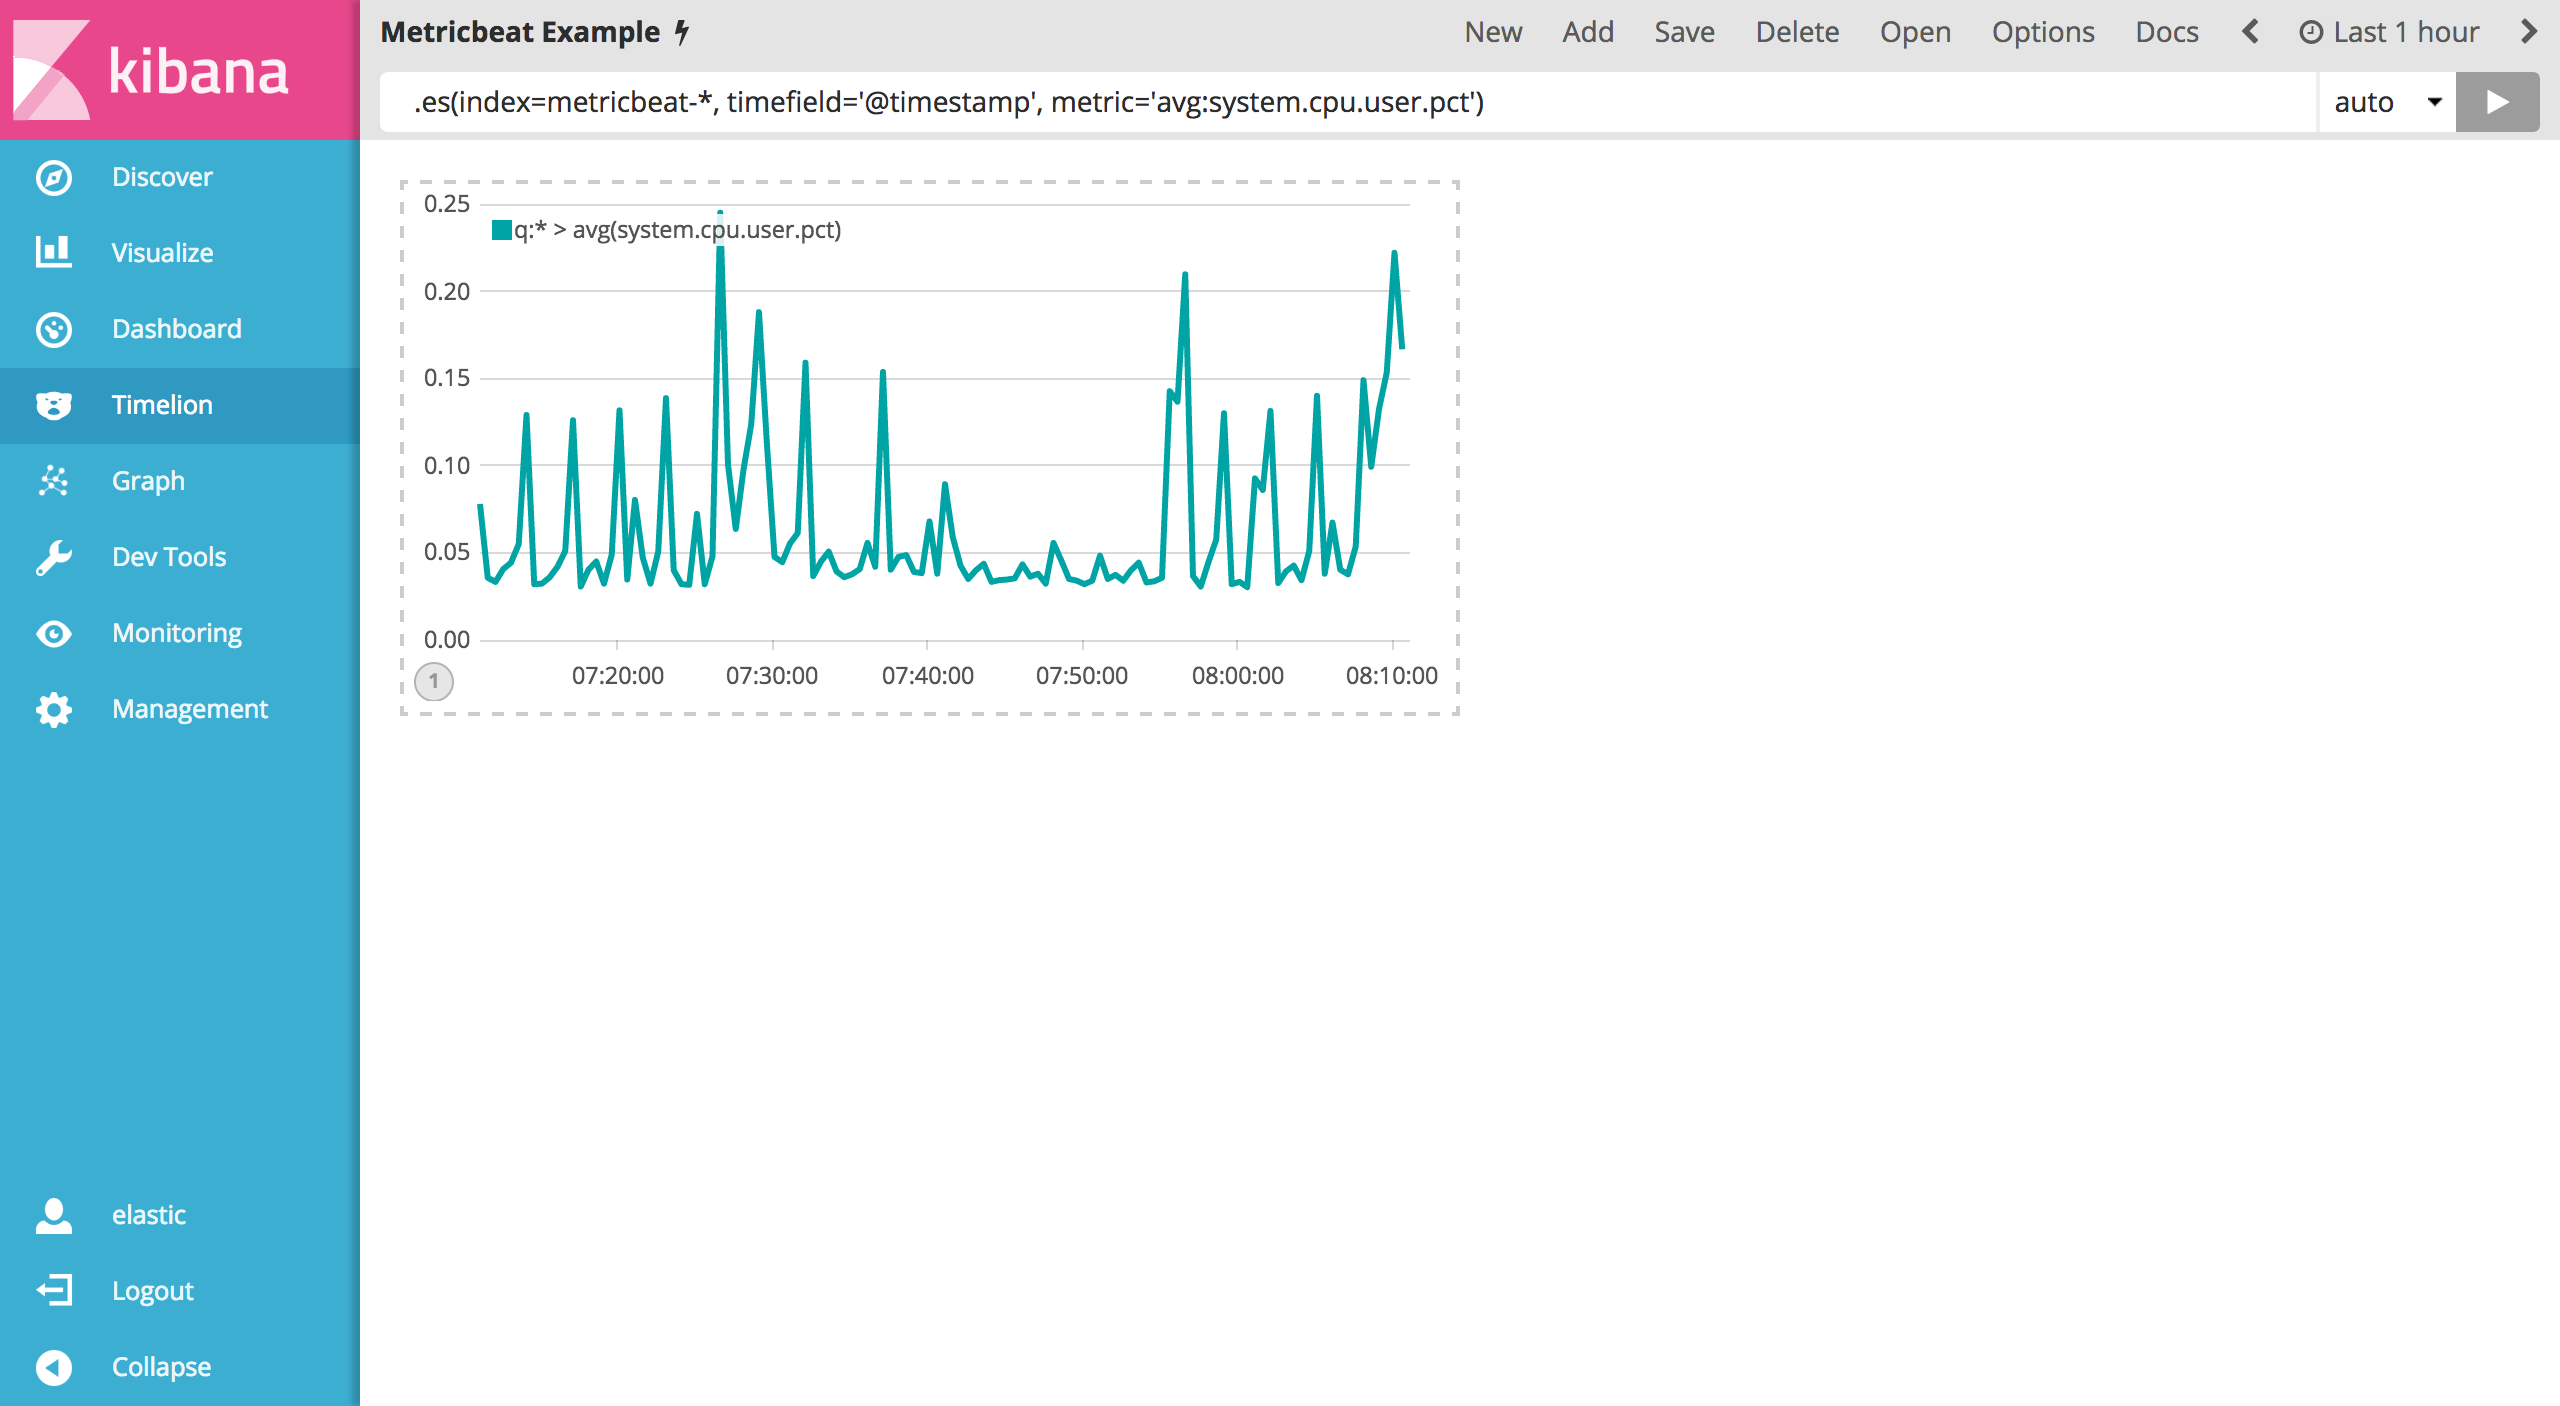
您需要在第一个表达式中定义 index 、 timefield 和 metric 。然后紧接着在 Timelion 查询框中输入如下表达式:
.es(index=metricbeat-*, timefield='@timestamp', metric='avg:system.cpu.user.pct')
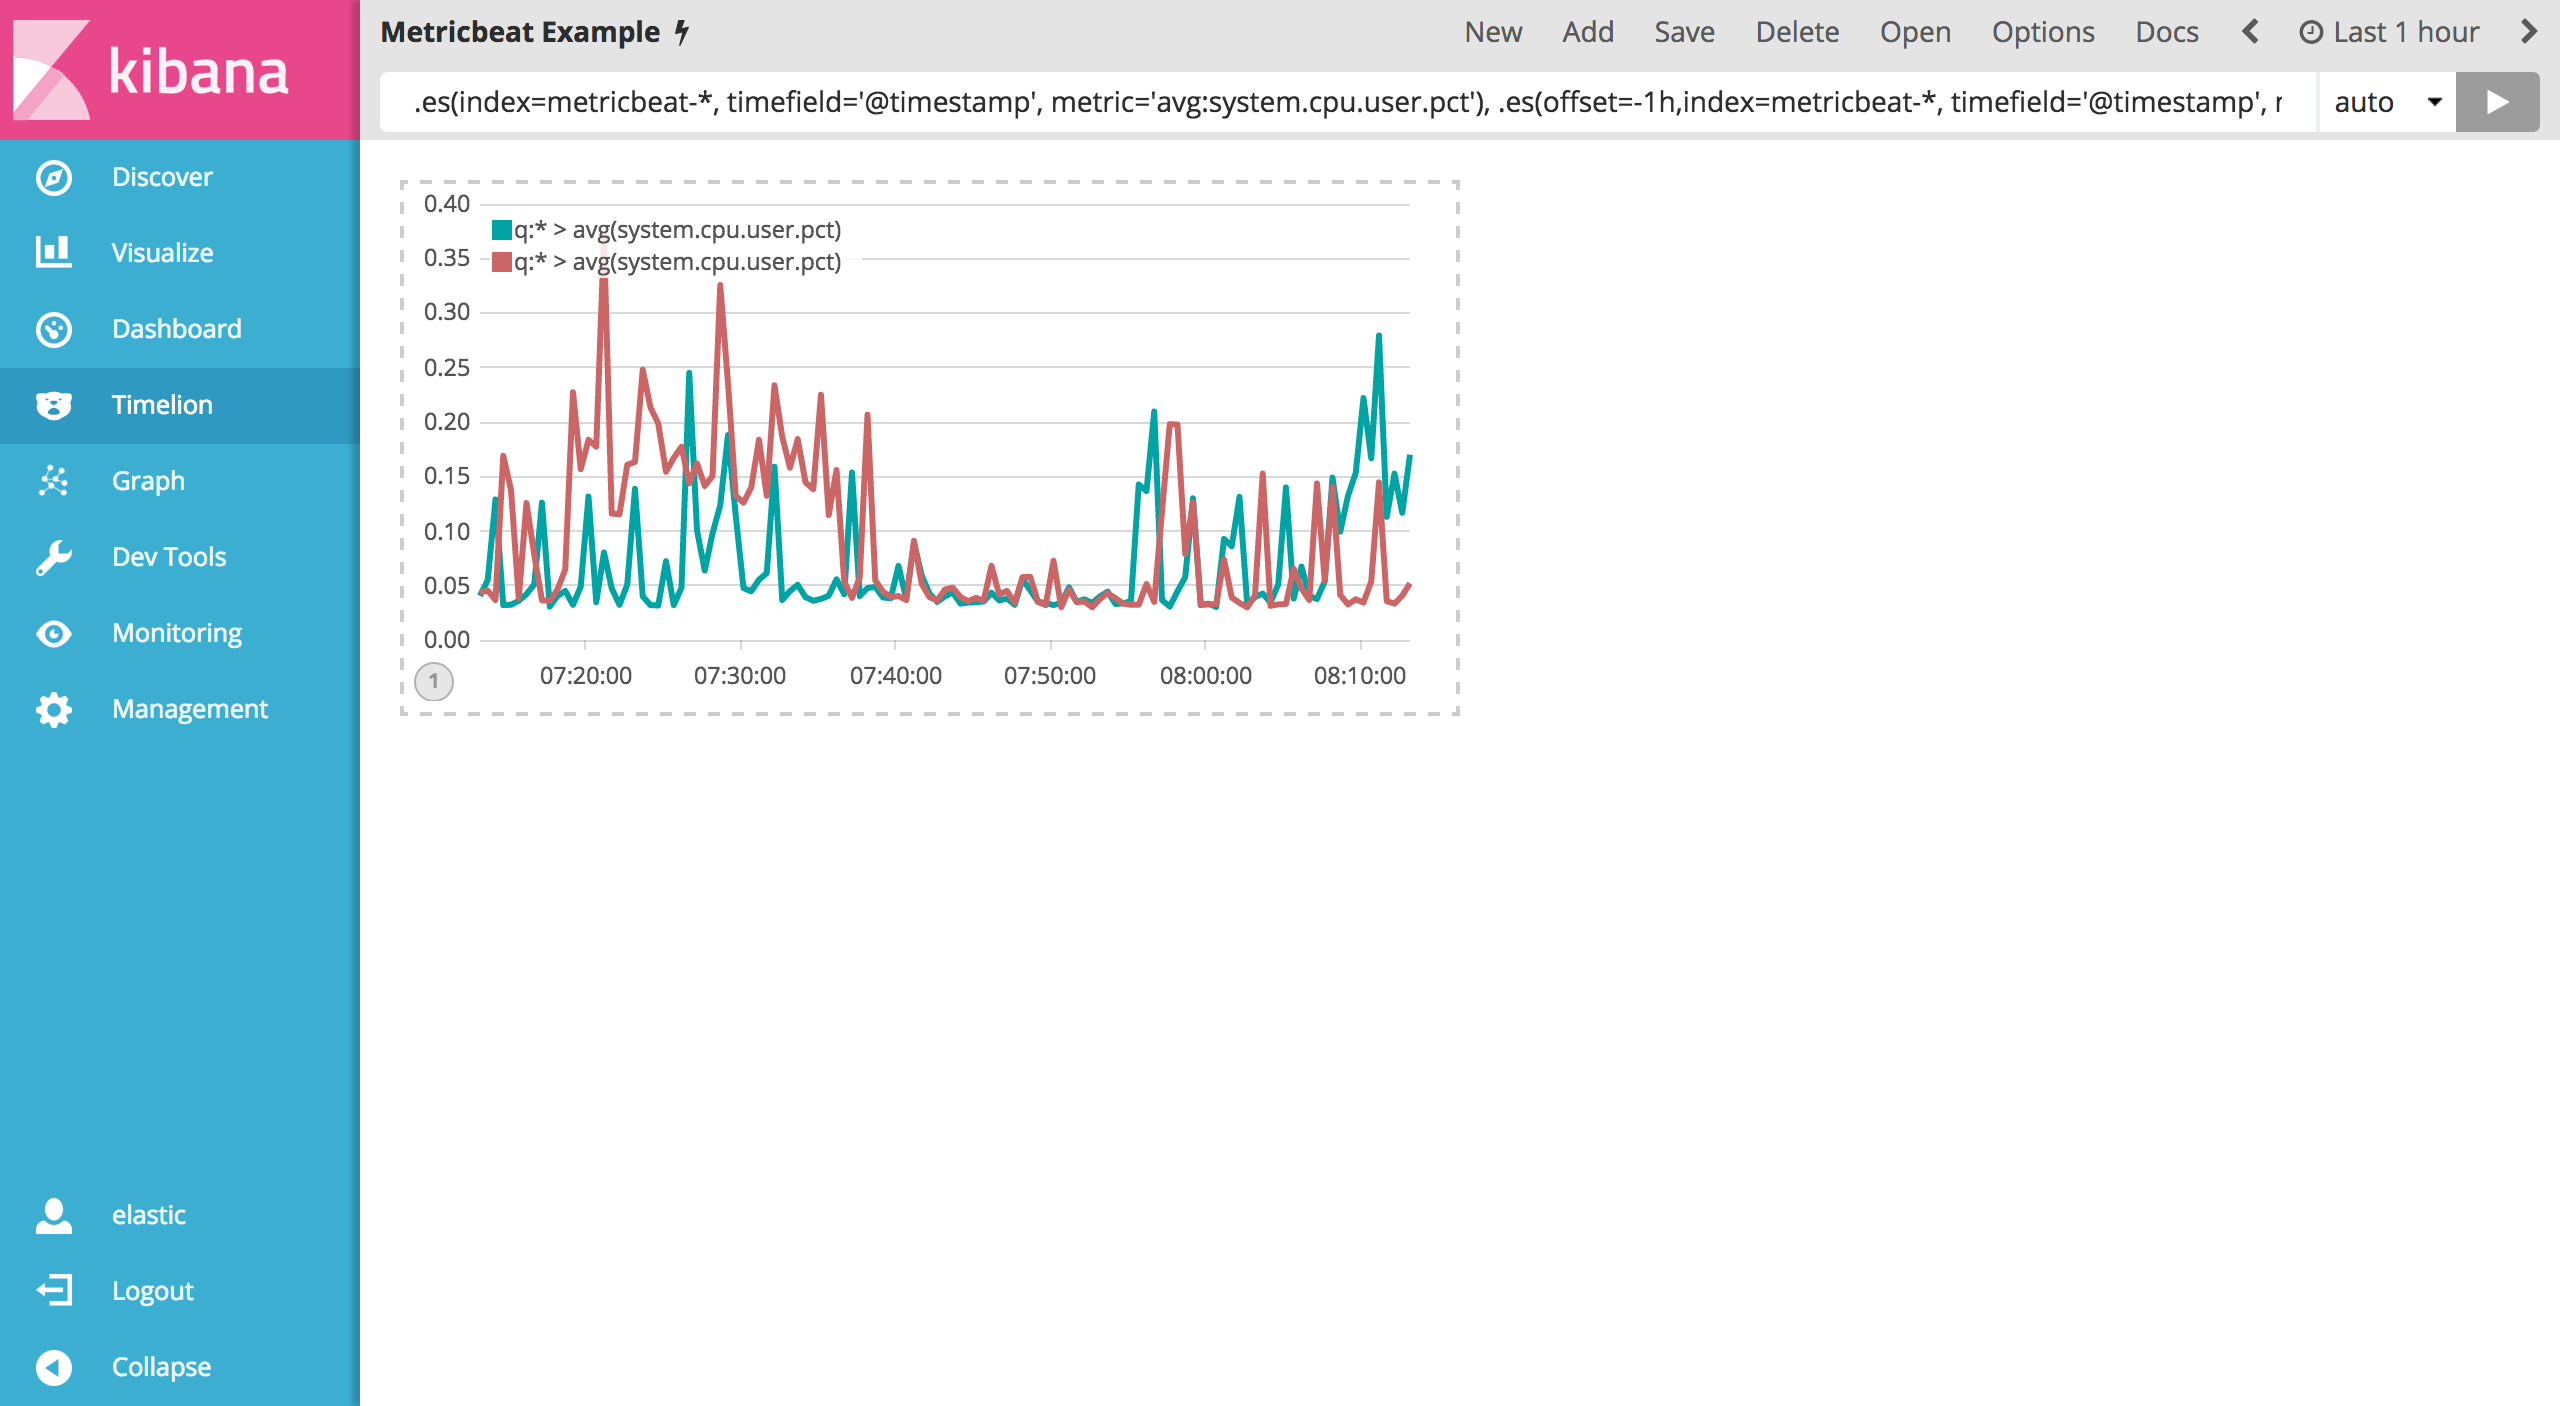
现在您需要添加前一个小时的数据用来对比。您需要添加一个 offset 参数到 .es() 函数。 offset 将会利用表达式来指定时间序列偏移量。举个例子,如果您想让时间偏移一个小时那么将会使用时间表达式 -1h 。 使用逗号分隔两个时间序列表达式,例如在 Timelion 查询框中输入如下表达式:
.es(index=metricbeat-*, timefield='@timestamp', metric='avg:system.cpu.user.pct'), .es(offset=-1h,index=metricbeat-*, timefield='@timestamp', metric='avg:system.cpu.user.pct')
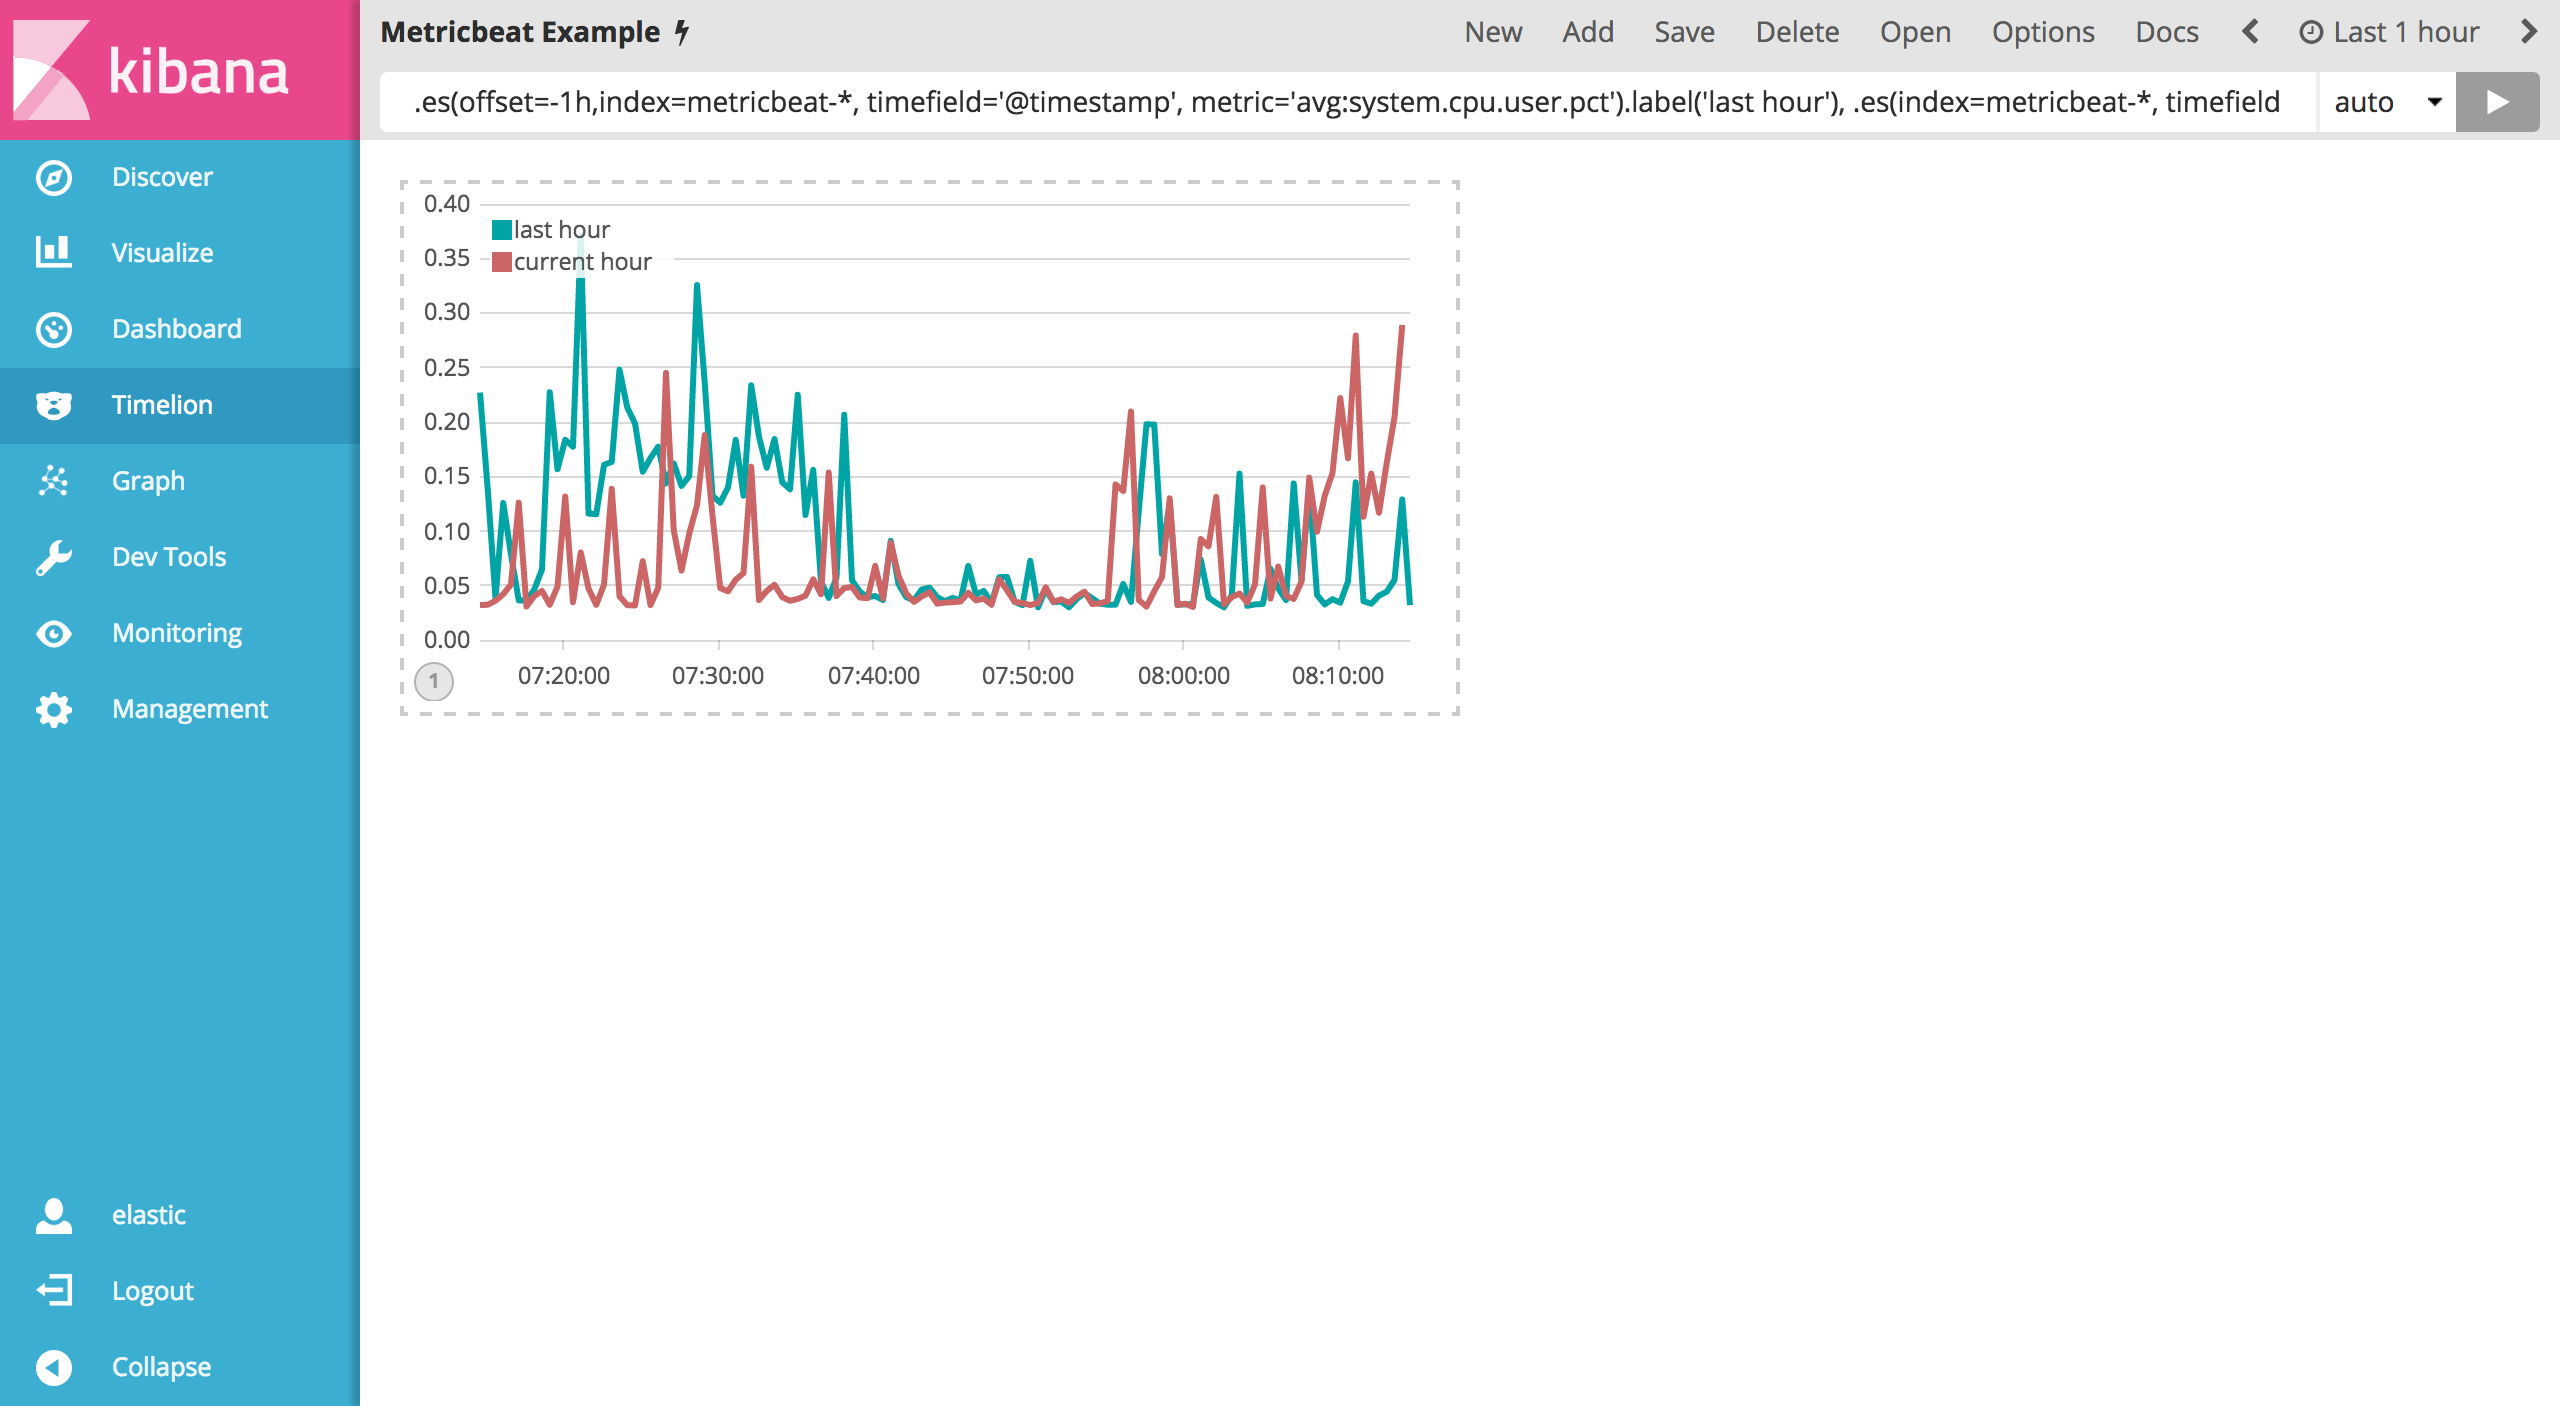
图形上有点难区分上述两个序列表达式。我们可以通过给每个序列自定义标签来区分它们。您可以在任何一个序列后面添加 .label() 表达式来自定义标签。我们来看看如下自定义标签的例子:
.es(offset=-1h,index=metricbeat-*, timefield='@timestamp', metric='avg:system.cpu.user.pct').label('last hour'), .es(index=metricbeat-*, timefield='@timestamp', metric='avg:system.cpu.user.pct').label('current hour')
保存整个 Timelion 表格为 Metricbeat Example 。Timelion 是一个非常强大的基于时间序列的控件,您可以对本教程中的一些关键点多加练习来熟悉 Timelion。
Was this helpful?
Thank you for your feedback.