- Auditbeat Reference: other versions:
- Overview
- Get started
- Set up and run
- Upgrade Auditbeat
- Configure
- Modules
- General settings
- Project paths
- Config file reloading
- Output
- SSL
- Index lifecycle management (ILM)
- Elasticsearch index template
- Kibana endpoint
- Kibana dashboards
- Processors
- Define processors
- add_cloud_metadata
- add_docker_metadata
- add_fields
- add_host_metadata
- add_id
- add_kubernetes_metadata
- add_labels
- add_locale
- add_observer_metadata
- add_process_metadata
- add_tags
- community_id
- convert
- copy_fields
- decode_base64_field
- decode_json_fields
- decompress_gzip_field
- dissect
- dns
- drop_event
- drop_fields
- extract_array
- fingerprint
- include_fields
- registered_domain
- rename
- truncate_fields
- Internal queue
- Logging
- HTTP endpoint
- Regular expression support
- auditbeat.reference.yml
- How to guides
- Modules
- Exported fields
- Monitor
- Secure
- Troubleshoot
- Get Help
- Debug
- Common problems
- Auditbeat fails to watch folders because too many files are open
- Auditbeat uses too much bandwidth
- Error loading config file
- Found unexpected or unknown characters
- Logstash connection doesn’t work
- @metadata is missing in Logstash
- Not sure whether to use Logstash or Beats
- SSL client fails to connect to Logstash
- Monitoring UI shows fewer Beats than expected
- Contribute to Beats
Step 6: View the sample Kibana dashboards
editStep 6: View the sample Kibana dashboards
editTo make it easier for you to start auditing the activities of users and
processes on your system, we have created example Auditbeat dashboards.
You loaded the dashboards earlier when you ran the setup command.
To open the dashboards, launch the Kibana web interface by pointing your browser
to port 5601. For example, http://localhost:5601.
Replace localhost with the name of the Kibana host. If you’re using an
Elastic Cloud instance, log in to your cloud account,
then navigate to the Kibana endpoint in your deployment.
On the Discover page, make sure that the predefined auditbeat-* index
pattern is selected to see Auditbeat data.
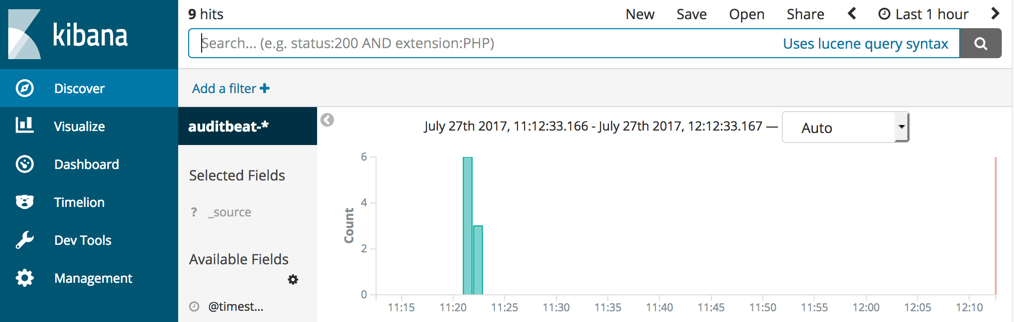
If you don’t see data in Kibana, try changing the date range to a larger range. By default, Kibana shows the last 15 minutes.
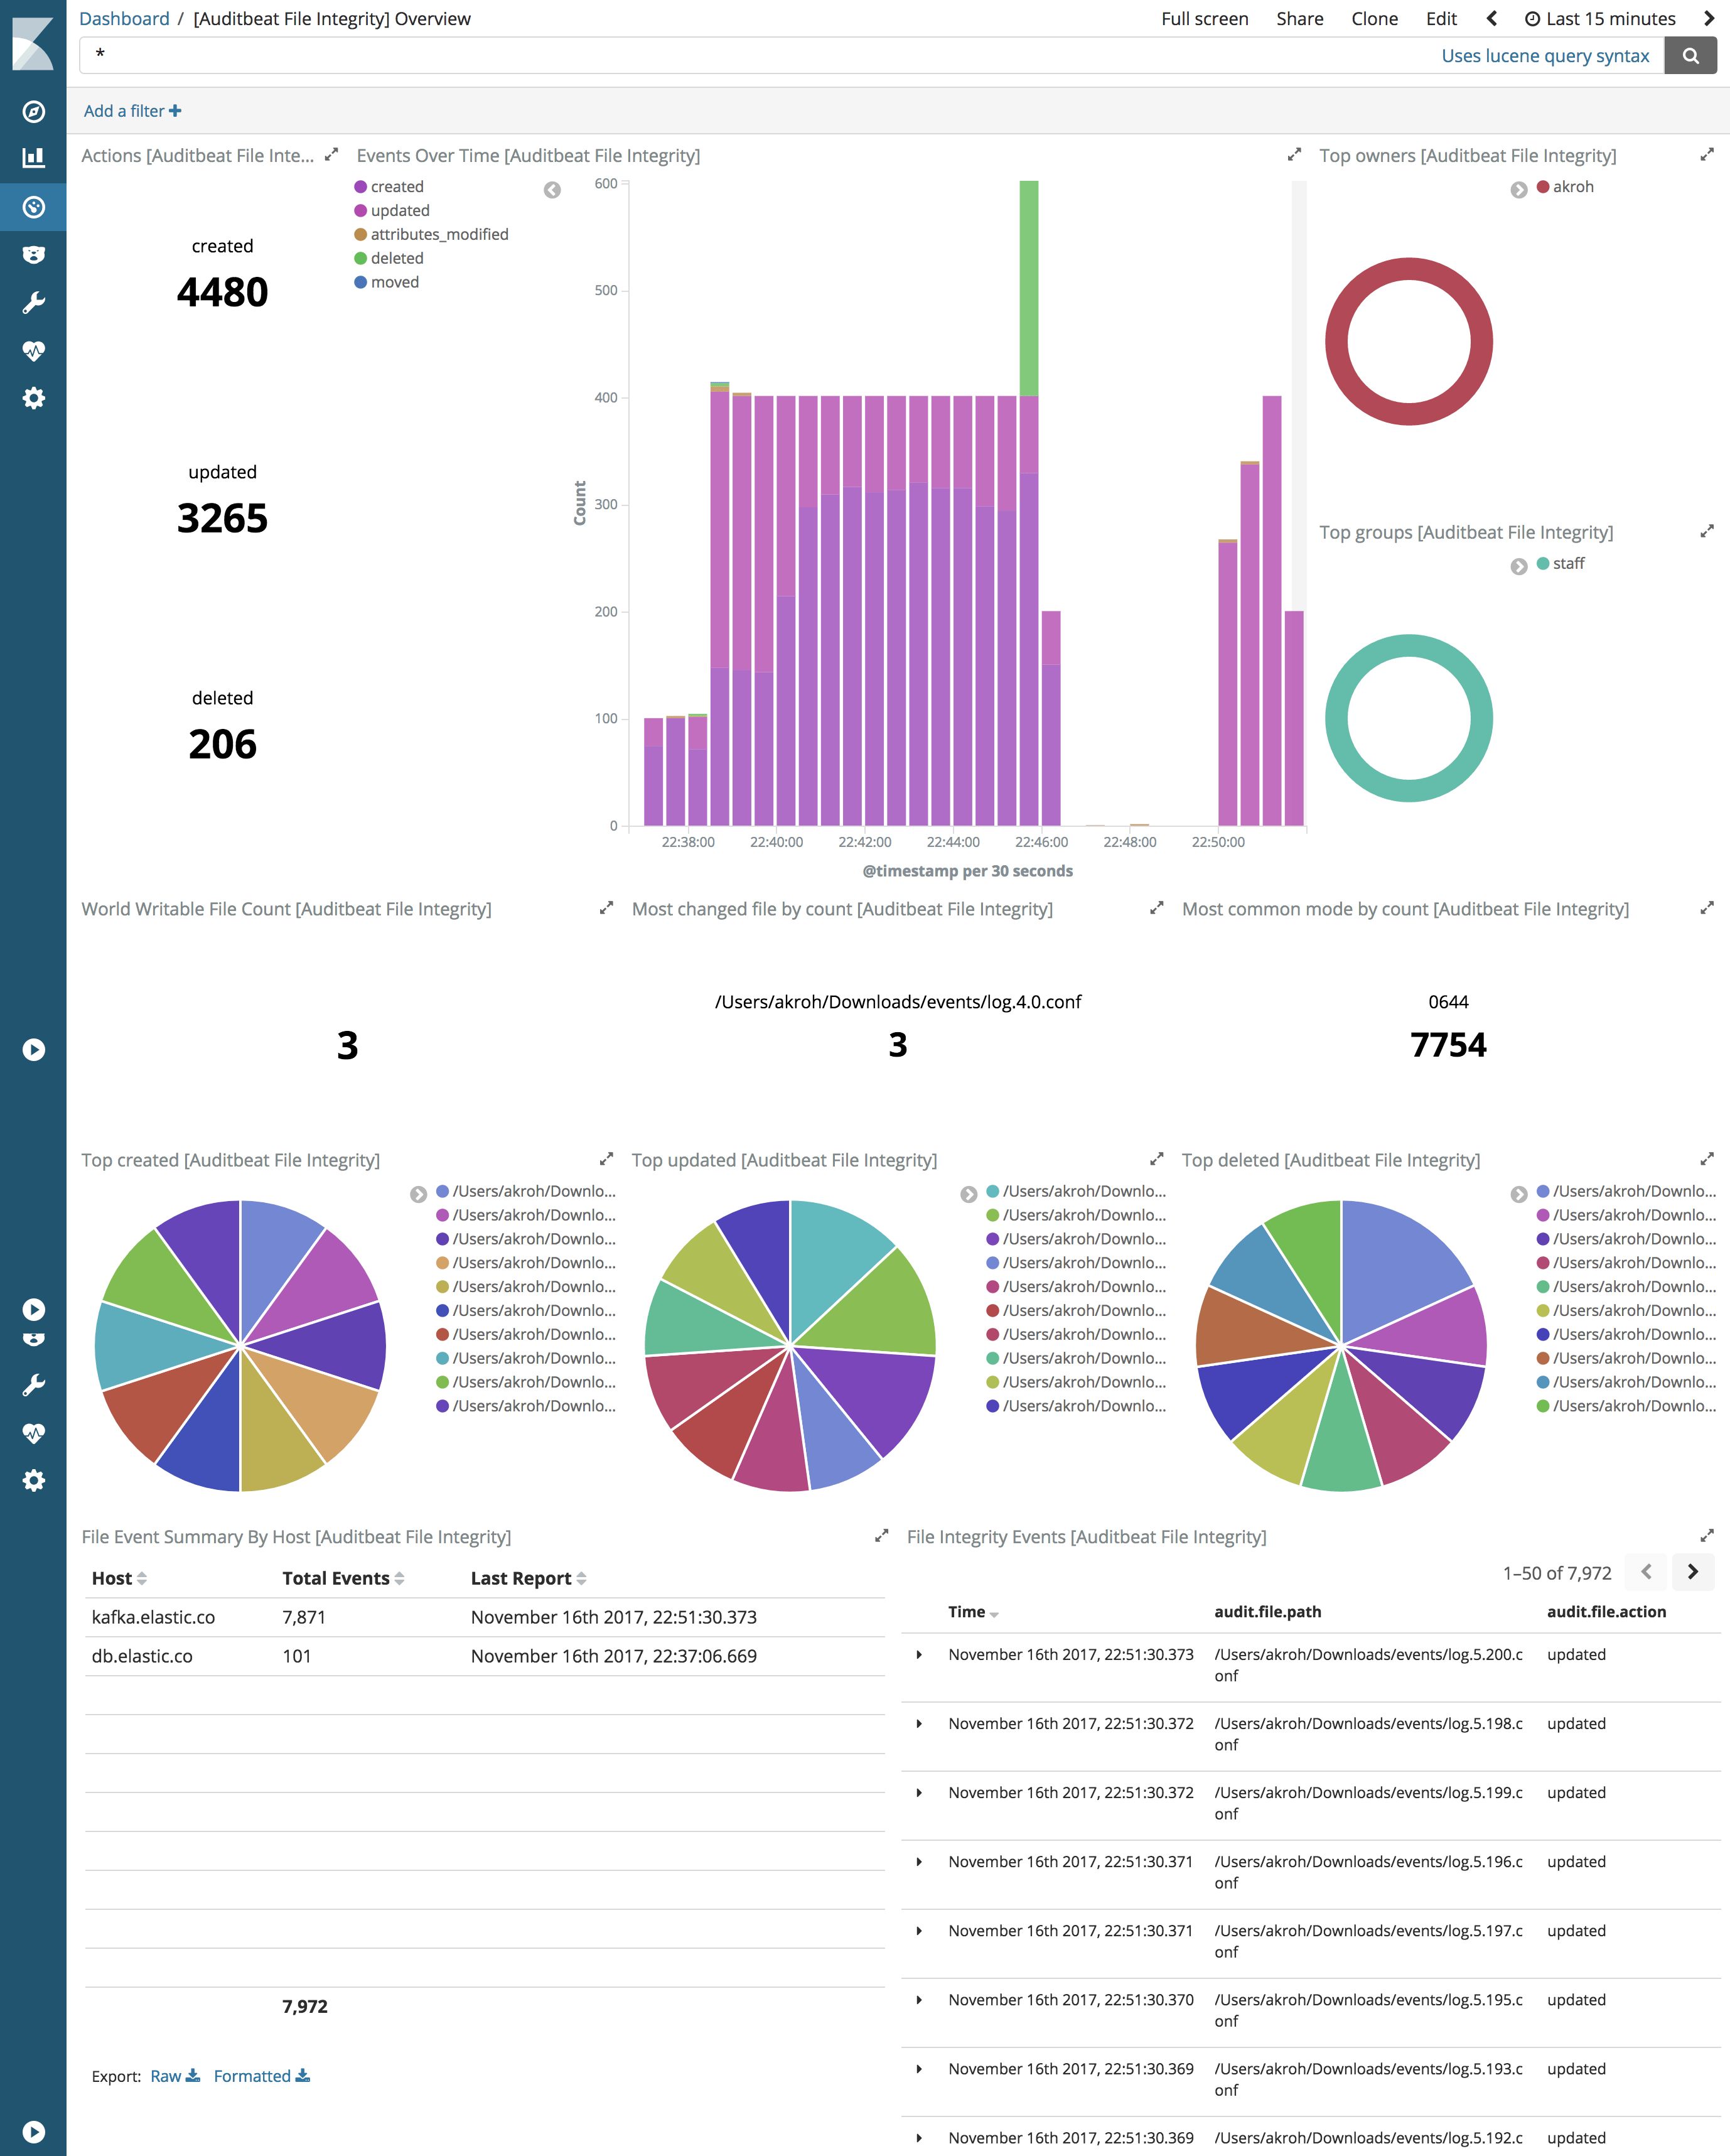
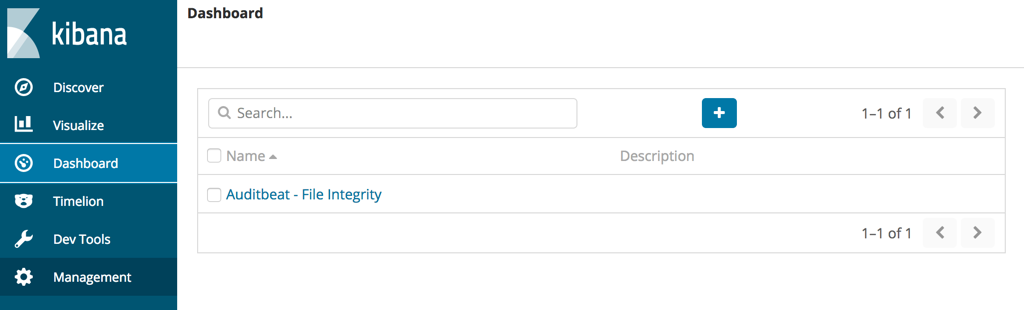
Go to the Dashboard page and select the dashboard that you want to open.
The dashboards are provided as examples. We recommend that you customize them to meet your needs.