- Filebeat Reference: other versions:
- Filebeat overview
- Quick start: installation and configuration
- Set up and run
- Upgrade
- How Filebeat works
- Configure
- Inputs
- Modules
- General settings
- Project paths
- Config file loading
- Output
- Kerberos
- SSL
- Index lifecycle management (ILM)
- Elasticsearch index template
- Kibana endpoint
- Kibana dashboards
- Processors
- Define processors
- add_cloud_metadata
- add_cloudfoundry_metadata
- add_docker_metadata
- add_fields
- add_host_metadata
- add_id
- add_kubernetes_metadata
- add_labels
- add_locale
- add_network_direction
- add_nomad_metadata
- add_observer_metadata
- add_process_metadata
- add_tags
- community_id
- convert
- copy_fields
- decode_base64_field
- decode_cef
- decode_csv_fields
- decode_json_fields
- decode_xml
- decode_xml_wineventlog
- decompress_gzip_field
- detect_mime_type
- dissect
- dns
- drop_event
- drop_fields
- extract_array
- fingerprint
- include_fields
- rate_limit
- registered_domain
- rename
- script
- timestamp
- translate_sid
- truncate_fields
- urldecode
- Autodiscover
- Internal queue
- Load balancing
- Logging
- HTTP endpoint
- Regular expression support
- Instrumentation
- filebeat.reference.yml
- How to guides
- Override configuration settings
- Load the Elasticsearch index template
- Change the index name
- Load Kibana dashboards
- Load ingest pipelines
- Enrich events with geoIP information
- Deduplicate data
- Parse data by using ingest node
- Use environment variables in the configuration
- Avoid YAML formatting problems
- Modules
- Modules overview
- ActiveMQ module
- Apache module
- Auditd module
- AWS module
- AWS Fargate module
- Azure module
- Barracuda module
- Bluecoat module
- CEF module
- Check Point module
- Cisco module
- CoreDNS module
- Crowdstrike module
- Cyberark module
- Cyberark PAS module
- Cylance module
- Elasticsearch module
- Envoyproxy Module
- F5 module
- Fortinet module
- Google Cloud module
- Google Workspace module
- GSuite module
- HAproxy module
- IBM MQ module
- Icinga module
- IIS module
- Imperva module
- Infoblox module
- Iptables module
- Juniper module
- Kafka module
- Kibana module
- Logstash module
- Microsoft module
- MISP module
- MongoDB module
- MSSQL module
- MySQL module
- MySQL Enterprise module
- NATS module
- NetFlow module
- Netscout module
- Nginx module
- Office 365 module
- Okta module
- Oracle module
- Osquery module
- Palo Alto Networks module
- pensando module
- PostgreSQL module
- Proofpoint module
- RabbitMQ module
- Radware module
- Redis module
- Santa module
- Snort module
- Snyk module
- Sonicwall module
- Sophos module
- Squid module
- Suricata module
- System module
- Threat Intel module
- Tomcat module
- Traefik module
- Zeek (Bro) Module
- ZooKeeper module
- Zoom module
- Zscaler module
- Exported fields
- ActiveMQ fields
- Apache fields
- Auditd fields
- AWS fields
- aws-cloudwatch fields
- AWS Fargate fields
- Azure fields
- Barracuda Web Application Firewall fields
- Beat fields
- Blue Coat Director fields
- Decode CEF processor fields fields
- CEF fields
- Checkpoint fields
- Cisco fields
- Cloud provider metadata fields
- Coredns fields
- Crowdstrike fields
- Cyber-Ark fields
- CyberArk PAS fields
- CylanceProtect fields
- Docker fields
- ECS fields
- Elasticsearch fields
- Envoyproxy fields
- Big-IP Access Policy Manager fields
- Fortinet fields
- Google Cloud Platform (GCP) fields
- google_workspace fields
- gsuite fields
- HAProxy fields
- Host fields
- ibmmq fields
- Icinga fields
- IIS fields
- Imperva SecureSphere fields
- Infoblox NIOS fields
- iptables fields
- Jolokia Discovery autodiscover provider fields
- Juniper JUNOS fields
- Kafka fields
- kibana fields
- Kubernetes fields
- Log file content fields
- logstash fields
- Microsoft fields
- MISP fields
- mongodb fields
- mssql fields
- MySQL fields
- MySQL Enterprise fields
- NATS fields
- NetFlow fields
- Arbor Peakflow SP fields
- Nginx fields
- Office 365 fields
- Okta fields
- Oracle fields
- Osquery fields
- panw fields
- Pensando fields
- PostgreSQL fields
- Process fields
- Proofpoint Email Security fields
- RabbitMQ fields
- Radware DefensePro fields
- Redis fields
- s3 fields
- Google Santa fields
- Snort/Sourcefire fields
- Snyk fields
- Sonicwall-FW fields
- sophos fields
- Squid fields
- Suricata fields
- System fields
- threatintel fields
- Apache Tomcat fields
- Traefik fields
- Zeek fields
- ZooKeeper fields
- Zoom fields
- Zscaler NSS fields
- Monitor
- Secure
- Troubleshoot
- Get help
- Debug
- Common problems
- Error extracting container id while using Kubernetes metadata
- Can’t read log files from network volumes
- Filebeat isn’t collecting lines from a file
- Too many open file handlers
- Registry file is too large
- Inode reuse causes Filebeat to skip lines
- Log rotation results in lost or duplicate events
- Open file handlers cause issues with Windows file rotation
- Filebeat is using too much CPU
- Dashboard in Kibana is breaking up data fields incorrectly
- Fields are not indexed or usable in Kibana visualizations
- Filebeat isn’t shipping the last line of a file
- Filebeat keeps open file handlers of deleted files for a long time
- Filebeat uses too much bandwidth
- Error loading config file
- Found unexpected or unknown characters
- Logstash connection doesn’t work
- Publishing to Logstash fails with "connection reset by peer" message
- @metadata is missing in Logstash
- Not sure whether to use Logstash or Beats
- SSL client fails to connect to Logstash
- Monitoring UI shows fewer Beats than expected
- Dashboard could not locate the index-pattern
- Contribute to Beats
Filebeat quick start: installation and configuration
editFilebeat quick start: installation and configuration
editThis guide describes how to get started quickly with log collection. You’ll learn how to:
- install Filebeat on each system you want to monitor
- specify the location of your log files
- parse log data into fields and send it to Elasticsearch
- visualize the log data in Kibana
Before you begin
editYou need Elasticsearch for storing and searching your data, and Kibana for visualizing and managing it.
To get started quickly, spin up a deployment of our hosted Elasticsearch Service. The Elasticsearch Service is available on AWS, GCP, and Azure. Try it out for free.
Step 1: Install Filebeat
editInstall Filebeat on all the servers you want to monitor.
To download and install Filebeat, use the commands that work with your system:
curl -L -O https://artifacts.elastic.co/downloads/beats/filebeat/filebeat-7.15.2-amd64.deb
sudo dpkg -i filebeat-7.15.2-amd64.deb
curl -L -O https://artifacts.elastic.co/downloads/beats/filebeat/filebeat-7.15.2-x86_64.rpm
sudo rpm -vi filebeat-7.15.2-x86_64.rpm
curl -L -O https://artifacts.elastic.co/downloads/beats/filebeat/filebeat-7.15.2-darwin-x86_64.tar.gz
tar xzvf filebeat-7.15.2-darwin-x86_64.tar.gz
brew tap elastic/tap
brew install elastic/tap/filebeat-full
This command installs the most recently released default distribution of
Filebeat. To install the OSS distribution, specify
elastic/tap/filebeat-oss.
curl -L -O https://artifacts.elastic.co/downloads/beats/filebeat/filebeat-7.15.2-linux-x86_64.tar.gz
tar xzvf filebeat-7.15.2-linux-x86_64.tar.gz
- Download the Filebeat Windows zip file from the downloads page.
-
Extract the contents of the zip file into
C:\Program Files. -
Rename the
filebeat-<version>-windowsdirectory toFilebeat. - Open a PowerShell prompt as an Administrator (right-click the PowerShell icon and select Run As Administrator).
-
From the PowerShell prompt, run the following commands to install Filebeat as a Windows service:
PS > cd 'C:\Program Files\Filebeat'
PS C:\Program Files\Filebeat> .\install-service-filebeat.ps1
If script execution is disabled on your system, you need to set the
execution policy for the current session to allow the script to run. For
example:
PowerShell.exe -ExecutionPolicy UnRestricted -File .\install-service-filebeat.ps1.
Other installation options
editStep 2: Connect to the Elastic Stack
editConnections to Elasticsearch and Kibana are required to set up Filebeat.
Set the connection information in filebeat.yml. To locate this
configuration file, see Directory layout.
Specify the cloud.id of your Elasticsearch Service, and set cloud.auth to a user who is authorized to set up Filebeat. For example:
cloud.id: "staging:dXMtZWFzdC0xLmF3cy5mb3VuZC5pbyRjZWM2ZjI2MWE3NGJmMjRjZTMzYmI4ODExYjg0Mjk0ZiRjNmMyY2E2ZDA0MjI0OWFmMGNjN2Q3YTllOTYyNTc0Mw=="
cloud.auth: "filebeat_setup:YOUR_PASSWORD"
|
This examples shows a hard-coded password, but you should store sensitive values in the secrets keystore. |
-
Set the host and port where Filebeat can find the Elasticsearch installation, and set the username and password of a user who is authorized to set up Filebeat. For example:
output.elasticsearch:
  hosts: ["myEShost:9200"]
  username: "filebeat_internal"
  password: "YOUR_PASSWORD"
This examples shows a hard-coded password, but you should store sensitive values in the secrets keystore.
-
If you plan to use our pre-built Kibana dashboards, configure the Kibana endpoint. Skip this step if Kibana is running on the same host as Elasticsearch.
The hostname and port of the machine where Kibana is running, for example,
mykibanahost:5601. If you specify a path after the port number, include the scheme and port:http://mykibanahost:5601/path.The
usernameandpasswordsettings for Kibana are optional. If you don’t specify credentials for Kibana, Filebeat uses theusernameandpasswordspecified for the Elasticsearch output.To use the pre-built Kibana dashboards, this user must be authorized to view dashboards or have the
kibana_adminbuilt-in role.
To learn more about required roles and privileges, see Grant users access to secured resources.
You can send data to other outputs, such as Logstash, but that requires additional configuration and setup.
Step 3: Collect log data
editThere are several ways to collect log data with Filebeat:
- Data collection modules — simplify the collection, parsing, and visualization of common log formats
- ECS loggers — structure and format application logs into ECS-compatible JSON
- Manual Filebeat configuration
Enable and configure data collection modules
edit-
Identify the modules you need to enable. To see a list of available modules, run:
filebeat modules listfilebeat modules list./filebeat modules list
filebeat modules list./filebeat modules list
PS > .\filebeat.exe modules list
-
From the installation directory, enable one or more modules. For example, the following command enables the
system,nginx, andmysqlmodule configs:filebeat modules enable system nginx mysqlfilebeat modules enable system nginx mysql./filebeat modules enable system nginx mysql
filebeat modules enable system nginx mysql./filebeat modules enable system nginx mysql
PS > .\filebeat.exe modules enable system nginx mysql
-
In the module configs under
modules.d, change the module settings to match your environment.For example, log locations are set based on the OS. If your logs aren’t in default locations, set the
pathsvariable:
To see the full list of variables for a module, see the documentation under Modules.
To test your configuration file, change to the directory where the
Filebeat binary is installed, and run Filebeat in the foreground with
the following options specified: ./filebeat test config -e. Make sure your
config files are in the path expected by Filebeat (see Directory layout),
or use the -c flag to specify the path to the config file.
For more information about configuring Filebeat, also see:
- Configure Filebeat
- Config file format
-
filebeat.reference.yml: This reference configuration file shows all non-deprecated options. You’ll find it in the same location asfilebeat.yml.
Enable and configure ECS loggers for application log collection
editWhile Filebeat can be used to ingest raw, plain-text application logs, we recommend structuring your logs at ingest time. This lets you extract fields, like log level and exception stack traces.
Elastic simplifies this process by providing application log formatters in a variety of popular programming languages. These plugins format your logs into ECS-compatible JSON, which removes the need to manually parse logs.
See ECS loggers to get started.
Configure Filebeat manually
editIf you’re unable to find a module for your file type, or can’t change your application’s log output, see configure the input manually.
Step 4: Set up assets
editFilebeat comes with predefined assets for parsing, indexing, and visualizing your data. To load these assets:
-
Make sure the user specified in
filebeat.ymlis authorized to set up Filebeat. -
From the installation directory, run:
filebeat setup -e
filebeat setup -e
./filebeat setup -e
filebeat setup -e
./filebeat setup -e
PS > .\filebeat.exe setup -e
-eis optional and sends output to standard error instead of the configured log output.
This step loads the recommended index template for writing to Elasticsearch and deploys the sample dashboards for visualizing the data in Kibana.
This step does not load the ingest pipelines used to parse log lines. By default, ingest pipelines are set up automatically the first time you run the module and connect to Elasticsearch.
A connection to Elasticsearch (or Elasticsearch Service) is required to set up the initial environment. If you’re using a different output, such as Logstash, see:
Step 5: Start Filebeat
editBefore starting Filebeat, modify the user credentials in
filebeat.yml and specify a user who is
authorized to publish events.
To start Filebeat, run:
sudo service filebeat start
If you use an init.d script to start Filebeat, you can’t specify command
line flags (see Command reference). To specify flags, start Filebeat in
the foreground.
Also see Filebeat and systemd.
sudo service filebeat start
If you use an init.d script to start Filebeat, you can’t specify command
line flags (see Command reference). To specify flags, start Filebeat in
the foreground.
Also see Filebeat and systemd.
|
You’ll be running Filebeat as root, so you need to change ownership of the
configuration file and any configurations enabled in the |
To have launchd start elastic/tap/filebeat and then restart it at login,
run:
brew services start elastic/tap/filebeat-full
To run Filebeat in the foreground instead of running it as a background service, run:
sudo chown root /usr/local/etc/filebeat/filebeat.yml
sudo chown root /usr/local/etc/filebeat/modules.d/system.yml
sudo filebeat -e
|
You’ll be running Filebeat as root, so you need to change ownership of the
configuration file and any configurations enabled in the |
|
You’ll be running Filebeat as root, so you need to change ownership of the
configuration file and any configurations enabled in the |
PS C:\Program Files\filebeat> Start-Service filebeat
By default, Windows log files are stored in C:\ProgramData\filebeat\Logs.
Filebeat should begin streaming events to Elasticsearch.
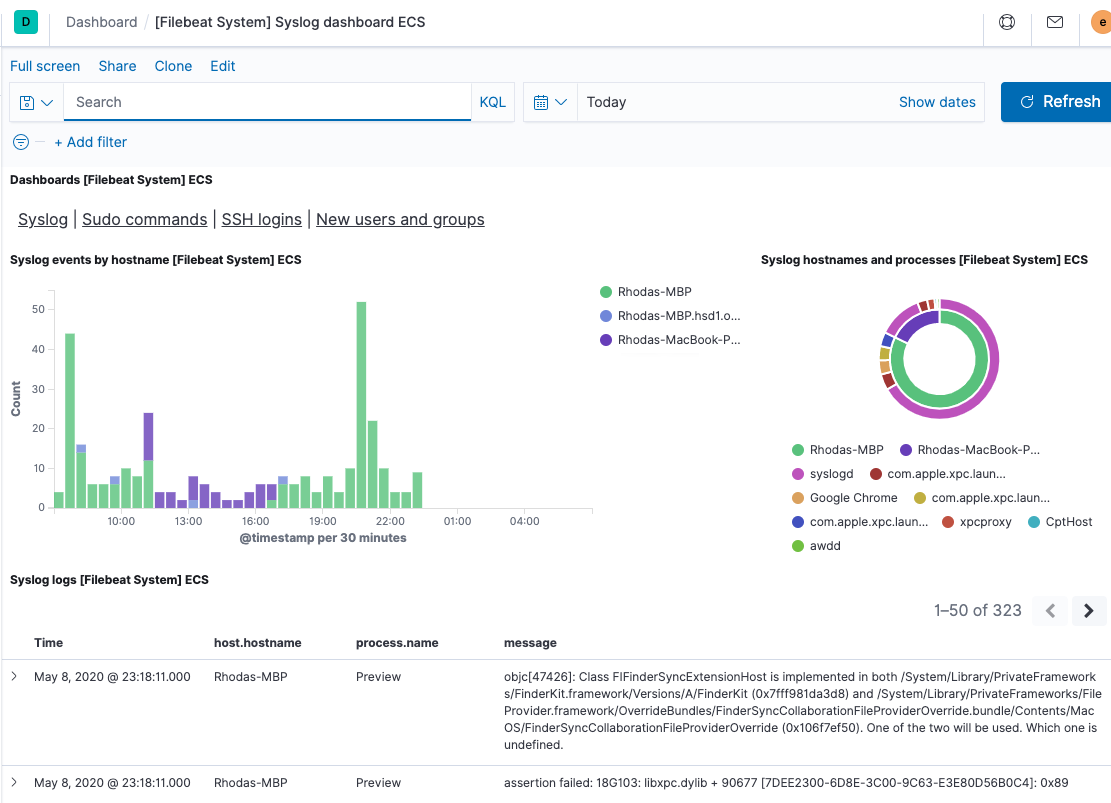
Step 6: View your data in Kibana
editFilebeat comes with pre-built Kibana dashboards and UIs for visualizing log
data. You loaded the dashboards earlier when you ran the setup command.
To open the dashboards:
-
Launch Kibana:
- Log in to your Elastic Cloud account.
- Navigate to the Kibana endpoint in your deployment.
Point your browser to http://localhost:5601, replacing
localhostwith the name of the Kibana host. -
In the side navigation, click Discover. To see Filebeat data, make sure the predefined
filebeat-*index pattern is selected.If you don’t see data in Kibana, try changing the time filter to a larger range. By default, Kibana shows the last 15 minutes.
- In the side navigation, click Dashboard, then select the dashboard that you want to open.
The dashboards are provided as examples. We recommend that you customize them to meet your needs.
What’s next?
editNow that you have your logs streaming into Elasticsearch, learn how to unify your logs, metrics, uptime, and application performance data.
-
Ingest data from other sources by installing and configuring other Elastic Beats:
Elastic Beats To capture Infrastructure metrics
Windows event logs
Uptime information
Application performance metrics
Audit events
-
Use the Observability apps in Kibana to search across all your data:
Elastic apps Use to Explore metrics about systems and services across your ecosystem
Tail related log data in real time
Monitor availability issues across your apps and services
Monitor application performance
Analyze security events
On this page
- Before you begin
- Step 1: Install Filebeat
- Other installation options
- Step 2: Connect to the Elastic Stack
- Step 3: Collect log data
- Enable and configure data collection modules
- Enable and configure ECS loggers for application log collection
- Configure Filebeat manually
- Step 4: Set up assets
- Step 5: Start Filebeat
- Step 6: View your data in Kibana
- What’s next?