- Filebeat Reference: other versions:
- Overview
- Getting Started With Filebeat
- Setting up and running Filebeat
- Upgrading Filebeat
- How Filebeat works
- Configuring Filebeat
- Specify which modules to run
- Configure inputs
- Manage multiline messages
- Specify general settings
- Load external configuration files
- Configure the internal queue
- Configure the output
- Configure index lifecycle management
- Load balance the output hosts
- Specify SSL settings
- Filter and enhance the exported data
- Define processors
- Add cloud metadata
- Add fields
- Add labels
- Add the local time zone
- Add tags
- Decode CEF
- Decode CSV fields
- Decode JSON fields
- Decode Base64 fields
- Decompress gzip fields
- Community ID Network Flow Hash
- Convert
- Drop events
- Drop fields from events
- Extract array
- Keep fields from events
- Registered Domain
- Rename fields from events
- Add Kubernetes metadata
- Add Docker metadata
- Add Host metadata
- Add Observer metadata
- Dissect strings
- DNS Reverse Lookup
- Add process metadata
- Script Processor
- Timestamp
- Parse data by using ingest node
- Enrich events with geoIP information
- Configure project paths
- Configure the Kibana endpoint
- Load the Kibana dashboards
- Load the Elasticsearch index template
- Configure logging
- Use environment variables in the configuration
- Autodiscover
- YAML tips and gotchas
- Regular expression support
- HTTP Endpoint
- filebeat.reference.yml
- Beats central management
- Modules
- Modules overview
- Apache module
- Auditd module
- AWS module
- CEF module
- Cisco module
- Coredns Module
- Elasticsearch module
- Envoyproxy Module
- Google Cloud module
- haproxy module
- IBM MQ module
- Icinga module
- IIS module
- Iptables module
- Kafka module
- Kibana module
- Logstash module
- MongoDB module
- MSSQL module
- MySQL module
- nats module
- NetFlow module
- Nginx module
- Osquery module
- Palo Alto Networks module
- PostgreSQL module
- RabbitMQ module
- Redis module
- Santa module
- Suricata module
- System module
- Traefik module
- Zeek (Bro) Module
- Exported fields
- Apache fields
- Auditd fields
- AWS fields
- Beat fields
- Decode CEF processor fields fields
- CEF fields
- Cisco fields
- Cloud provider metadata fields
- Coredns fields
- Docker fields
- ECS fields
- elasticsearch fields
- Envoyproxy fields
- Google Cloud fields
- haproxy fields
- Host fields
- ibmmq fields
- Icinga fields
- IIS fields
- iptables fields
- Jolokia Discovery autodiscover provider fields
- Kafka fields
- kibana fields
- Kubernetes fields
- Log file content fields
- logstash fields
- mongodb fields
- mssql fields
- MySQL fields
- nats fields
- NetFlow fields
- NetFlow fields
- Nginx fields
- Osquery fields
- panw fields
- PostgreSQL fields
- Process fields
- RabbitMQ fields
- Redis fields
- s3 fields
- Google Santa fields
- Suricata fields
- System fields
- Traefik fields
- Zeek fields
- Monitoring Filebeat
- Securing Filebeat
- Troubleshooting
- Get help
- Debug
- Common problems
- Can’t read log files from network volumes
- Filebeat isn’t collecting lines from a file
- Too many open file handlers
- Registry file is too large
- Inode reuse causes Filebeat to skip lines
- Log rotation results in lost or duplicate events
- Open file handlers cause issues with Windows file rotation
- Filebeat is using too much CPU
- Dashboard in Kibana is breaking up data fields incorrectly
- Fields are not indexed or usable in Kibana visualizations
- Filebeat isn’t shipping the last line of a file
- Filebeat keeps open file handlers of deleted files for a long time
- Filebeat uses too much bandwidth
- Error loading config file
- Found unexpected or unknown characters
- Logstash connection doesn’t work
- @metadata is missing in Logstash
- Not sure whether to use Logstash or Beats
- SSL client fails to connect to Logstash
- Monitoring UI shows fewer Beats than expected
- Contributing to Beats
Palo Alto Networks module
editPalo Alto Networks module
editThis functionality is in beta and is subject to change. The design and code is less mature than official GA features and is being provided as-is with no warranties. Beta features are not subject to the support SLA of official GA features.
This is a module for Palo Alto Networks PAN-OS firewall monitoring logs received over Syslog or read from a file. It currently supports messages of Traffic and Threat types.
Compatibility
editThis module has been tested with logs generated by devices running PAN-OS versions 7.1 to 9.0 but limited compatibility is expected for earlier versions.
The ingest-geoip Elasticsearch plugin is required to run this module.
Set up and run the module
editBefore doing these steps, verify that Elasticsearch and Kibana are running and that Elasticsearch is ready to receive data from Filebeat.
If you’re running our hosted Elasticsearch Service on Elastic Cloud, or you’ve enabled security in Elasticsearch and Kibana, you need to specify additional connection information before setting up and running the module. See Quick start: modules for common log formats for the complete setup.
To set up and run the module:
-
Enable the module:
deb and rpm:
filebeat modules enable panwmac:
./filebeat modules enable panw
brew:
filebeat modules enable panwlinux:
./filebeat modules enable panw
win:
PS > .\filebeat.exe modules enable panw
This command enables the module config defined in the
modules.ddirectory. See Specify which modules to run for other ways to enable modules.To see a list of enabled and disabled modules, run:
deb and rpm:
filebeat modules listmac:
./filebeat modules list
brew:
filebeat modules listlinux:
./filebeat modules list
win:
PS > .\filebeat.exe modules list
-
Set up the initial environment:
deb and rpm:
filebeat setup -e
mac:
./filebeat setup -e
linux:
./filebeat setup -e
brew:
filebeat setup -e
win:
PS > .\filebeat.exe setup -e
The
setupcommand loads the recommended index template for writing to Elasticsearch and deploys the sample dashboards (if available) for visualizing the data in Kibana. This is a one-time setup step.The
-eflag is optional and sends output to standard error instead of syslog.The ingest pipelines used to parse log lines are set up automatically the first time you run the module, assuming the Elasticsearch output is enabled. If you’re sending events to Logstash, or plan to use Beats central management, also see Load ingest pipelines manually.
-
Run Filebeat.
If your logs aren’t in the default location, see Configure the module, then run Filebeat after you’ve set the paths variable.
deb and rpm:
service filebeat startmac:
./filebeat -e
brew:
filebeat -e
linux:
./filebeat -e
win:
PS > Start-Service filebeat
If the module is configured correctly, you’ll see
INFO Harvester startedmessages for each file specified in the config.Depending on how you’ve installed Filebeat, you might see errors related to file ownership or permissions when you try to run Filebeat modules. See Config File Ownership and Permissions in the Beats Platform Reference for more information.
-
Explore your data in Kibana:
-
Open your browser and navigate to the Dashboard overview in Kibana:
http://localhost:5601/app/kibana#/dashboards.
Replace
localhostwith the name of the Kibana host. If you’re using an Elastic Cloud instance, log in to your cloud account, then navigate to the Kibana endpoint in your deployment. - If necessary, log in with your Kibana username and password.
-
Enter the module name in the search box, then open a dashboard and explore the visualizations for your parsed logs.
If you don’t see data in Kibana, try changing the date range to a larger range. By default, Kibana shows the last 15 minutes.
-
Open your browser and navigate to the Dashboard overview in Kibana:
http://localhost:5601/app/kibana#/dashboards.
Replace
ECS field mappings
editThese are the PAN-OS to ECS field mappings as well as those fields still not
in ECS that are added under the panw.panos prefix:
Table 4. Traffic log mappings
| PAN-OS Field | ECS Field | Non-standard field |
|---|---|---|
Receive Time |
event.created |
|
Serial Number |
observer.serial_number |
|
Type |
event.category |
|
Subtype |
event.action |
|
Generated Time |
|
|
Source IP |
client.ip source.ip |
|
Destination IP |
server.ip destination.ip |
|
NAT Source IP |
panw.panos.source.nat.ip |
|
NAT Destination IP |
panw.panos.destination.nat.ip |
|
Rule Name |
panw.panos.ruleset |
|
Source User |
client.user.name source.user.name |
|
Destination User |
server.user.name destination.user.name |
|
Application |
network.application |
|
Source Zone |
panw.panos.source.zone |
|
Destination Zone |
panw.panos.destination.zone |
|
Ingress Interface |
panw.panos.source.interface |
|
Egress Interface |
panw.panos.destination.interface |
|
Session ID |
panw.panos.flow_id |
|
Source Port |
client.port source.port |
|
Destination Port |
destination.port server.port |
|
NAT Source Port |
panw.panos.source.nat.port |
|
NAT Destination Port |
panw.panos.destination.nat.port |
|
Flags |
labels |
|
Protocol |
network.transport |
|
Action |
event.outcome |
|
Bytes |
network.bytes |
|
Bytes Sent |
client.bytes destination.bytes |
|
Bytes Received |
server.bytes source.bytes |
|
Packets |
network.packets |
|
Start Time |
event.start |
|
Elapsed Time |
event.duration |
|
Category |
panw.panos.url.category |
|
Sequence Number |
panw.panos.sequence_number |
|
Packets Sent |
server.packets destination.packets |
|
Packets Received |
client.packets source.packets |
|
Device Name |
observer.hostname |
Table 5. Threat logs mappings
| PAN-OS Field | ECS Field | Non-standard field |
|---|---|---|
Receive Time |
event.created |
|
Serial Number |
observer.serial_number |
|
Type |
event.category |
|
Subtype |
event.action |
|
Generated Time |
|
|
Source IP |
client.ip source.ip |
|
Destination IP |
server.ip destination.ip |
|
NAT Source IP |
panw.panos.source.nat.ip |
|
NAT Destination IP |
panw.panos.destination.nat.ip |
|
Rule Name |
panw.panos.ruleset |
|
Source User |
client.user.name source.user.name |
|
Destination User |
server.user.name destination.user.name |
|
Application |
network.application |
|
Source Zone |
panw.panos.source.zone |
|
Destination Zone |
panw.panos.destination.zone |
|
Ingress Interface |
panw.panos.source.interface |
|
Egress Interface |
panw.panos.destination.interface |
|
Session ID |
panw.panos.flow_id |
|
Source Port |
client.port source.port |
|
Destination Port |
destination.port server.port |
|
NAT Source Port |
panw.panos.source.nat.port |
|
NAT Destination Port |
panw.panos.destination.nat.port |
|
Flags |
labels |
|
Protocol |
network.transport |
|
Action |
event.outcome |
|
Miscellaneous |
url.original |
panw.panos.threat.resource |
Threat ID |
panw.panos.threat.id |
|
Category |
panw.panos.url.category |
|
Severity |
log.level |
|
Direction |
network.direction |
|
Source Location |
source.geo.name |
|
Destination Location |
destination.geo.name |
|
PCAP_id |
panw.panos.network.pcap_id |
|
Filedigest |
panw.panos.file.hash |
|
User Agent |
user_agent.original |
|
File Type |
file.type |
|
X-Forwarded-For |
network.forwarded_ip |
|
Referer |
http.request.referer |
|
Sender |
source.user.email |
|
Subject |
panw.panos.subject |
|
Recipient |
destination.user.email |
|
Device Name |
observer.hostname |
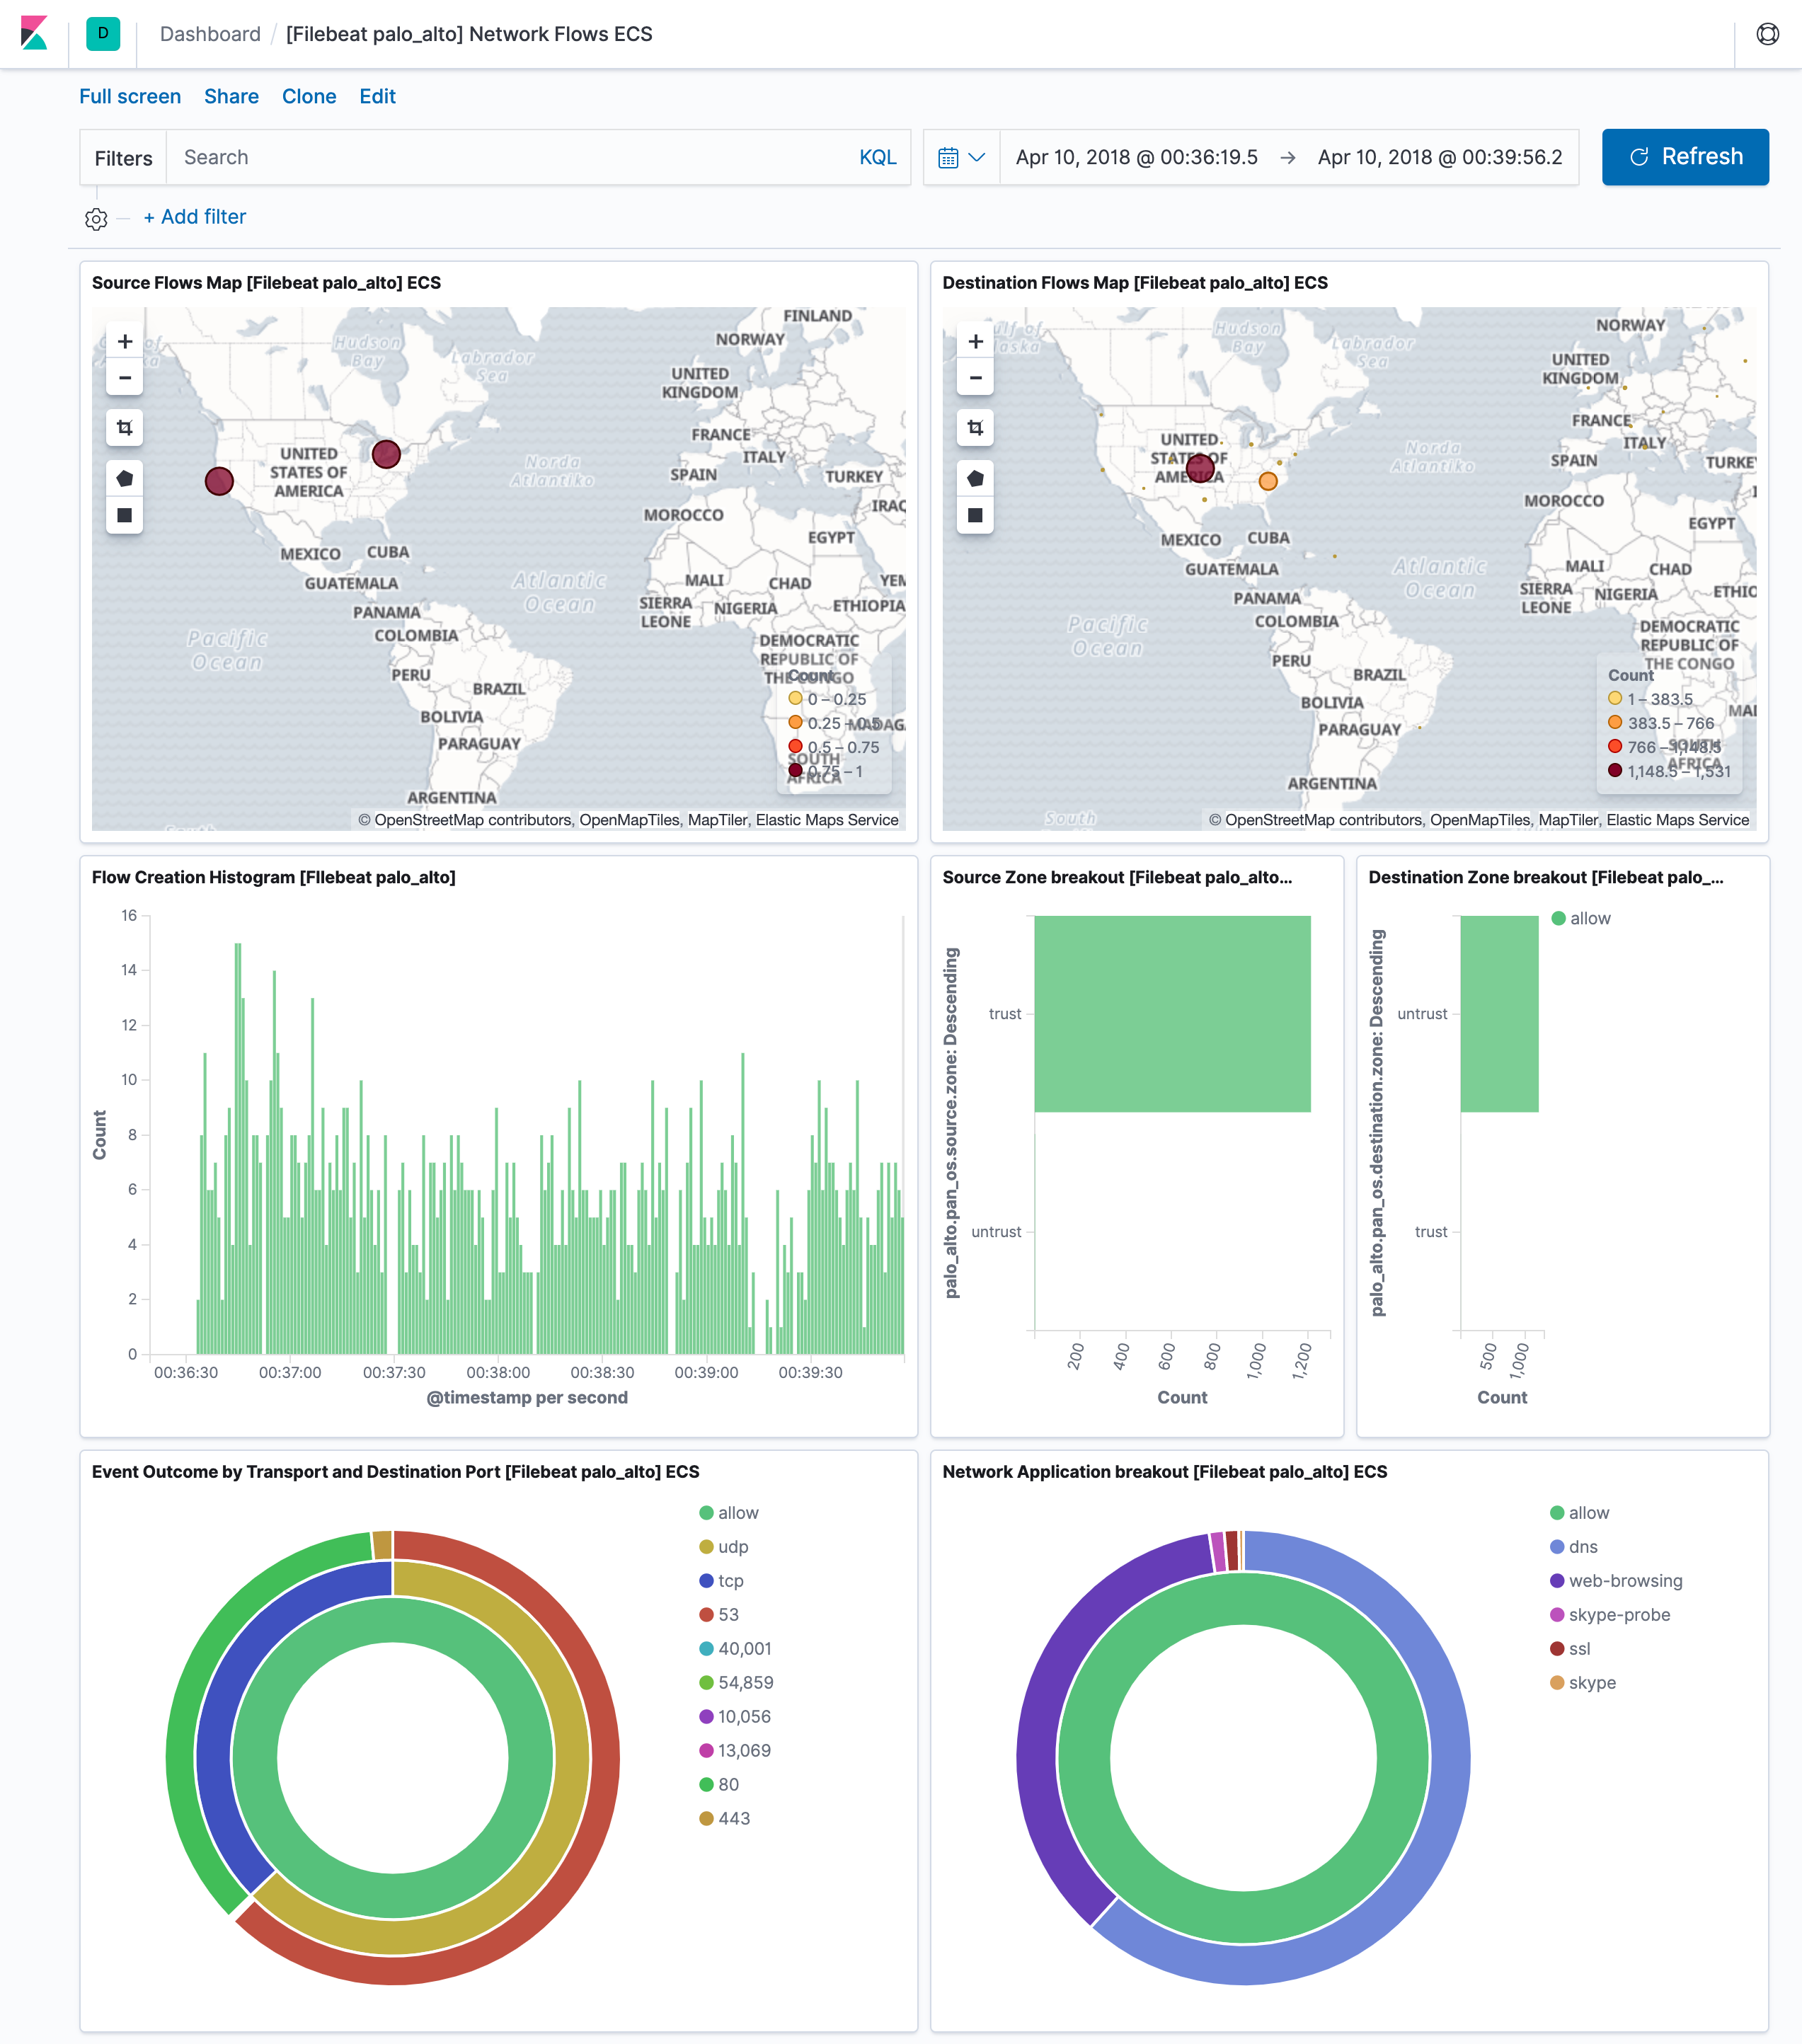
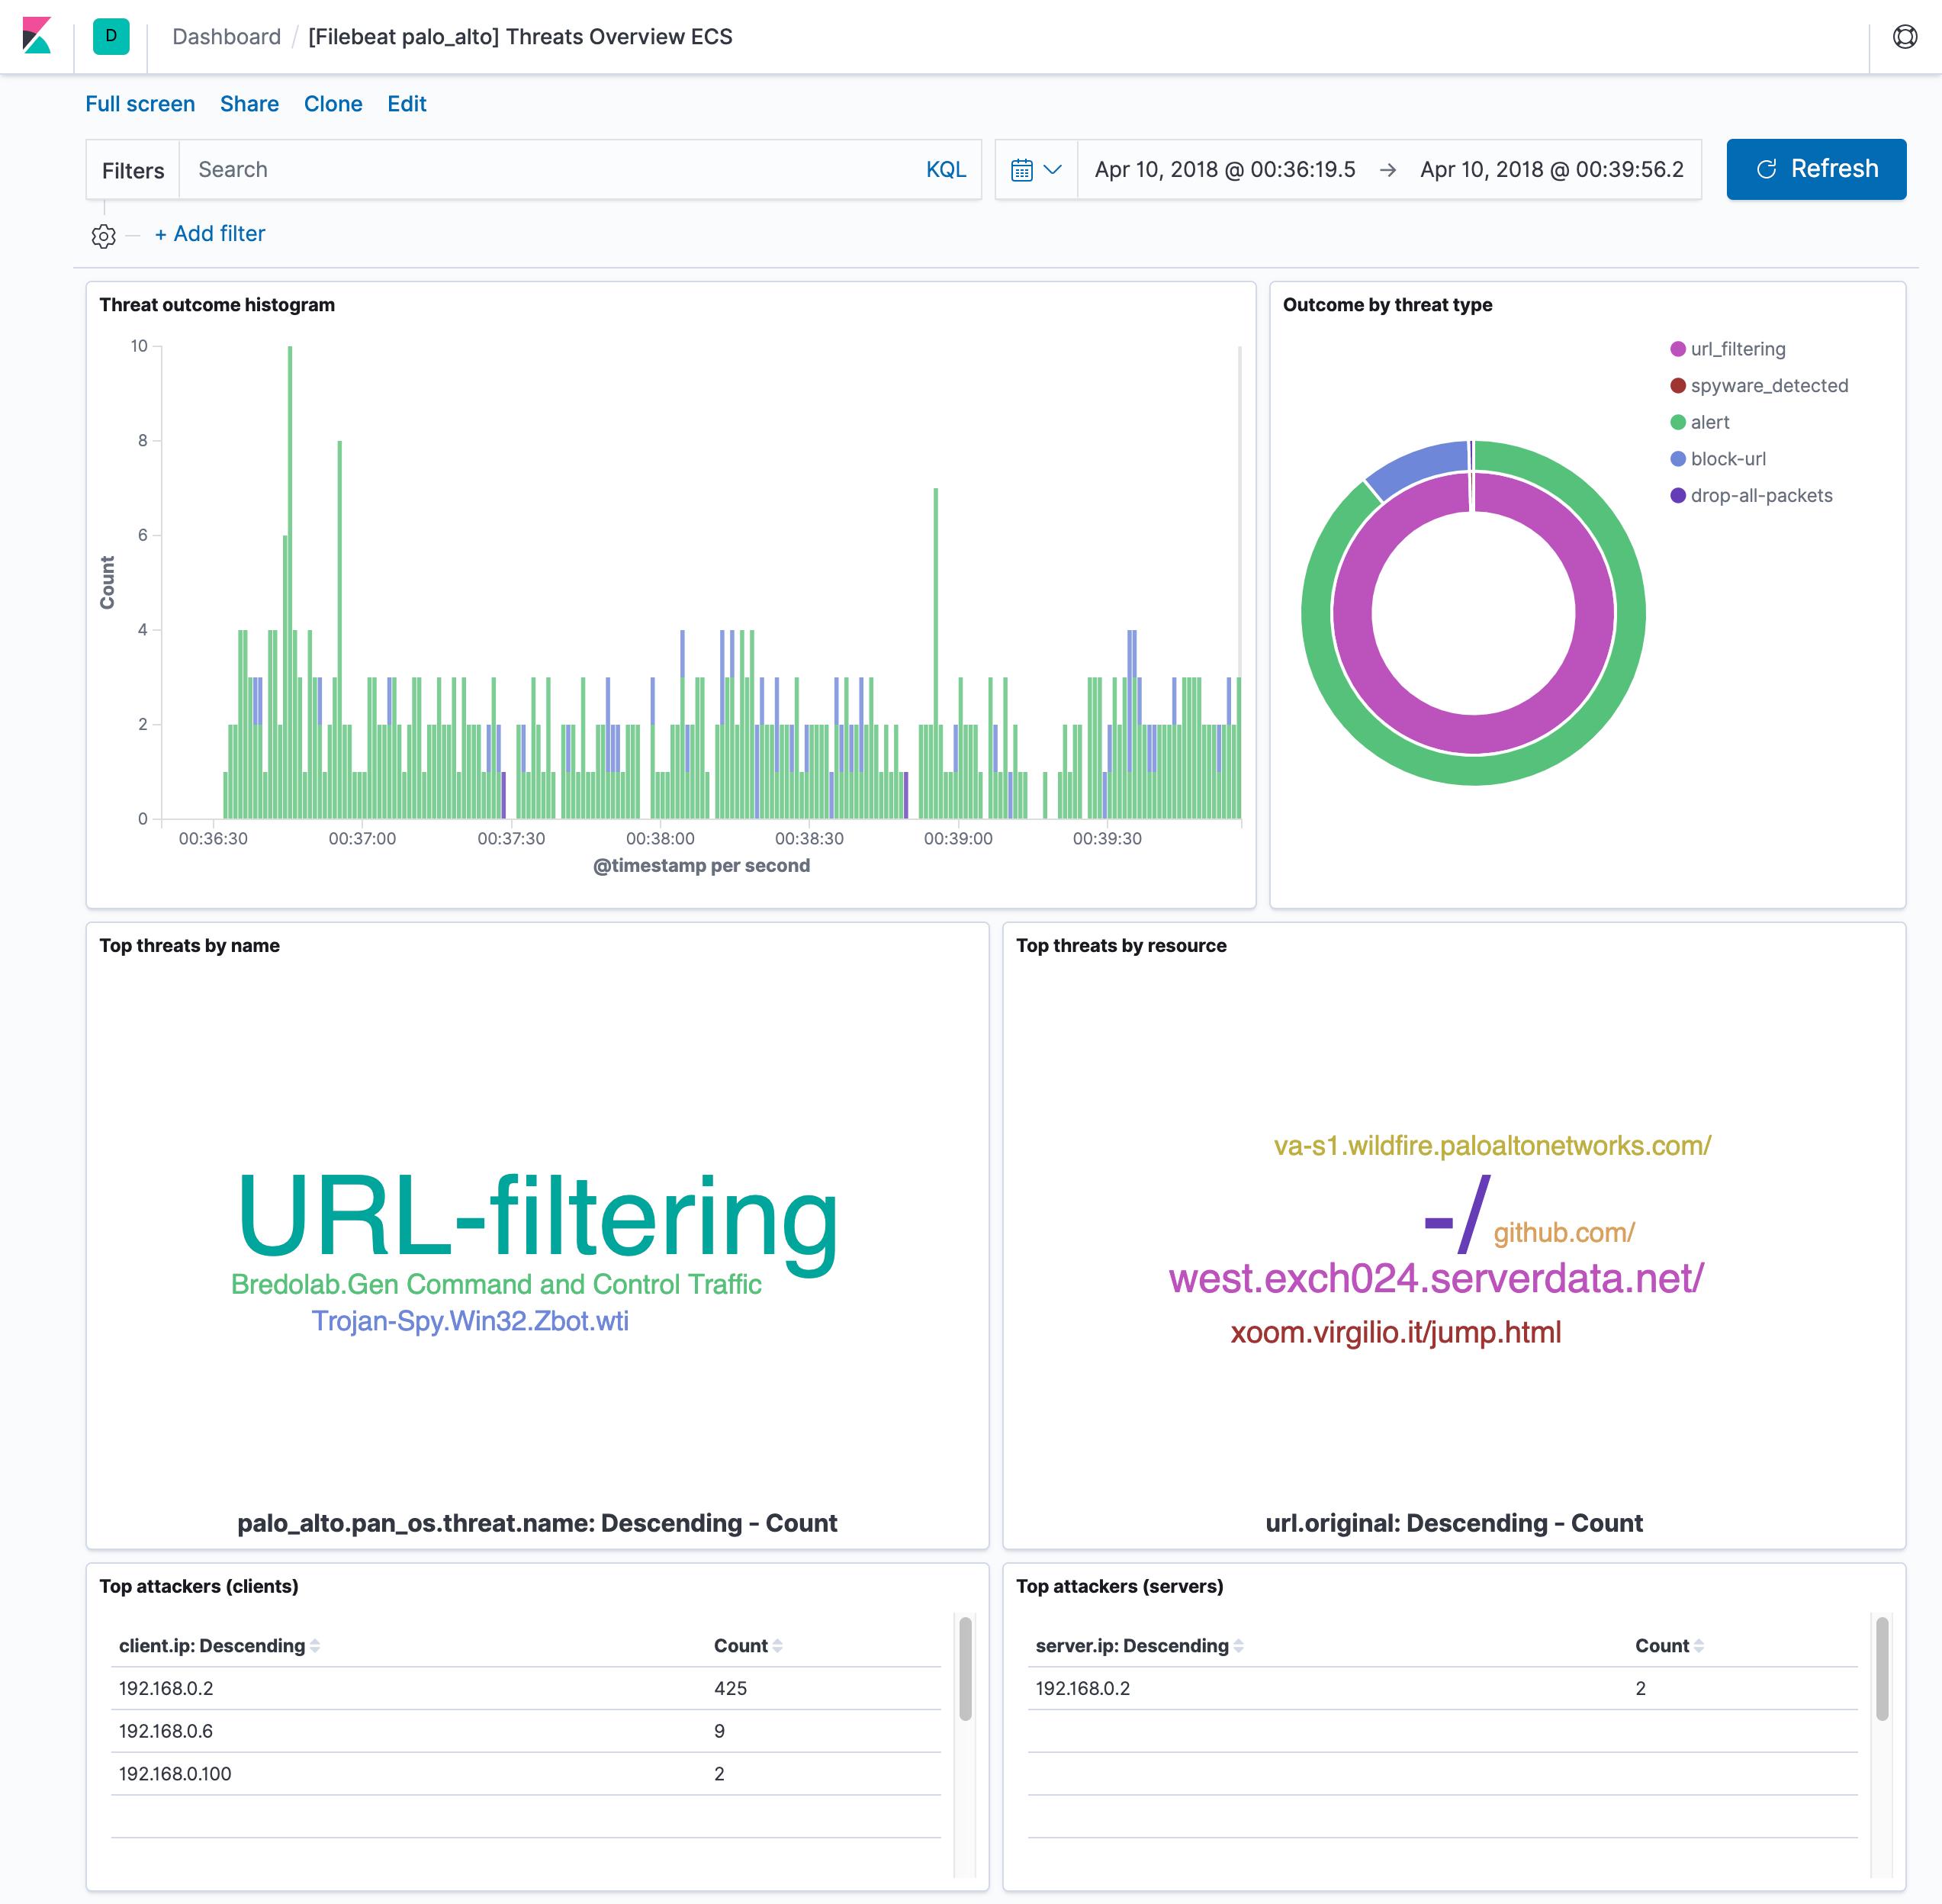
Example dashboard
editThis module comes with two sample dashboards:
Configure the module
editYou can further refine the behavior of the panw module by specifying
variable settings in the
modules.d/panw.yml file, or overriding settings at the command line.
The module is by default configured to run via syslog on port 9001. However it can also be configured to read logs from a file. See the following example.
- module: panw
  panos:
    enabled: true
    var.paths: ["/var/log/pan-os.log"]
    var.input: "file"
Variable settings
editEach fileset has separate variable settings for configuring the behavior of the
module. If you don’t specify variable settings, the panw module uses
the defaults.
For more information, see Specify variable settings. Also see Override input settings.
When you specify a setting at the command line, remember to prefix the
setting with the module name, for example, panw.panos.var.paths
instead of panos.var.paths.
panos fileset settings
editExample config:
  panos:
    var.syslog_host: 0.0.0.0
    var.syslog_port: 514
-
var.paths -
An array of glob-based paths that specify where to look for the log files. All
patterns supported by Go Glob
are also supported here. For example, you can use wildcards to fetch all files
from a predefined level of subdirectories:
/path/to/log/*/*.log. This fetches all.logfiles from the subfolders of/path/to/log. It does not fetch log files from the/path/to/logfolder itself. If this setting is left empty, Filebeat will choose log paths based on your operating system. -
var.syslog_host -
The interface to listen to UDP based syslog traffic. Defaults to
localhost. Set to0.0.0.0to bind to all available interfaces. -
var.syslog_port -
The UDP port to listen for syslog traffic. Defaults to
9001
Ports below 1024 require Filebeat to run as root.
Timezone support
editThis module parses logs that don’t contain timezone information. For these logs,
Filebeat reads the local timezone and uses it when parsing to convert the
timestamp to UTC. The timezone to be used for parsing is included in the event
in the event.timezone field.
To disable this conversion, the event.timezone field can be removed with
the drop_fields processor.
If logs are originated from systems or applications with a different timezone to
the local one, the event.timezone field can be overwritten with the original
timezone using the add_fields processor.
See Filter and enhance the exported data for information about specifying processors in your config.
Fields
editFor a description of each field in the module, see the exported fields section.
On this page