- Beats Platform Reference: other versions:
- Overview
- Community Beats
- Get started with Beats
- Config file format
- Upgrade
- Release highlights
- Breaking changes
- Release notes
- Beats version 7.6.2
- Beats version 7.6.1
- Beats version 7.6.0
- Beats version 7.5.1
- Beats version 7.5.0
- Beats version 7.4.1
- Beats version 7.4.0
- Beats version 7.3.2
- Beats version 7.3.1
- Beats version 7.3.0
- Beats version 7.2.1
- Beats version 7.2.0
- Beats version 7.1.1
- Beats version 7.1.0
- Beats version 7.0.1
- Beats version 7.0.0
- Beats version 7.0.0-GA
- Beats version 7.0.0-rc2
- Beats version 7.0.0-rc1
- Beats version 7.0.0-beta1
- Beats version 7.0.0-alpha2
- Beats version 7.0.0-alpha1
- Beats version 6.8.3
- Beats version 6.8.2
- Beats version 6.8.1
- Beats version 6.7.2
- Beats version 6.7.1
- Beats version 6.7.0
- Beats version 6.6.2
- Beats version 6.6.1
- Beats version 6.6.0
- Beats version 6.5.4
- Beats version 6.5.3
- Beats version 6.5.2
- Beats version 6.5.1
- Beats version 6.5.0
- Beats version 6.4.3
- Beats version 6.4.2
- Beats version 6.4.1
- Beats version 6.4.0
- Beats version 6.3.1
- Beats version 6.3.0
- Beats version 6.2.3
- Beats version 6.2.2
- Beats version 6.2.1
- Beats version 6.2.0
- Beats version 6.1.3
- Beats version 6.1.2
- Beats version 6.1.1
- Beats version 6.1.0
- Beats version 6.0.1
- Beats version 6.0.0
- Beats version 6.0.0-GA
- Beats version 6.0.0-rc2
- Beats version 6.0.0-rc1
- Beats version 6.0.0-beta2
- Beats version 6.0.0-beta1
- Beats version 6.0.0-alpha2
- Beats version 6.0.0-alpha1
- Beats version 5.6.14
- Beats version 5.6.13
- Beats version 5.6.12
- Beats version 5.6.11
- Beats version 5.6.10
- Beats version 5.6.9
- Beats version 5.6.8
- Beats version 5.6.7
- Beats version 5.6.6
- Beats version 5.6.5
- Beats version 5.6.4
- Beats version 5.6.3
- Beats version 5.6.2
- Beats version 5.6.1
- Beats version 5.6.0
- Beats version 5.5.3
- Beats version 5.5.2
- Beats version 5.5.1
- Beats version 5.5.0
- Beats version 5.4.2
- Beats version 5.4.1
- Beats version 5.4.0
- Beats version 5.3.2
- Beats version 5.3.1
- Beats version 5.3.0
- Beats version 5.2.2
- Beats version 5.2.1
- Beats version 5.2.0
- Beats version 5.1.2
- Beats version 5.1.1
- Beats version 5.1.0 (skipped)
- Beats version 5.0.2
- Beats version 5.0.1
- Beats version 5.0.0
- Beats version 5.0.0-GA
- Beats version 5.0.0-rc1
- Beats version 5.0.0-beta1
- Beats version 5.0.0-alpha5
- Beats version 5.0.0-alpha4
- Beats version 5.0.0-alpha3
- Beats version 5.0.0-alpha2
- Beats version 5.0.0-alpha1
- Beats version 1.3.1
- Beats version 1.3.0
- Beats version 1.2.3
- Beats version 1.2.2
- Beats version 1.2.1
- Beats version 1.2.0
- Beats version 1.1.2
- Beats version 1.1.1
- Beats version 1.1.0
- Beats version 1.0.1
- Beats version 1.0.0
- Beats version 1.0.0-rc2
- Beats version 1.0.0-rc1
- Beats version 1.0.0-beta4
- Contribute to Beats
Beats overview
editBeats overview
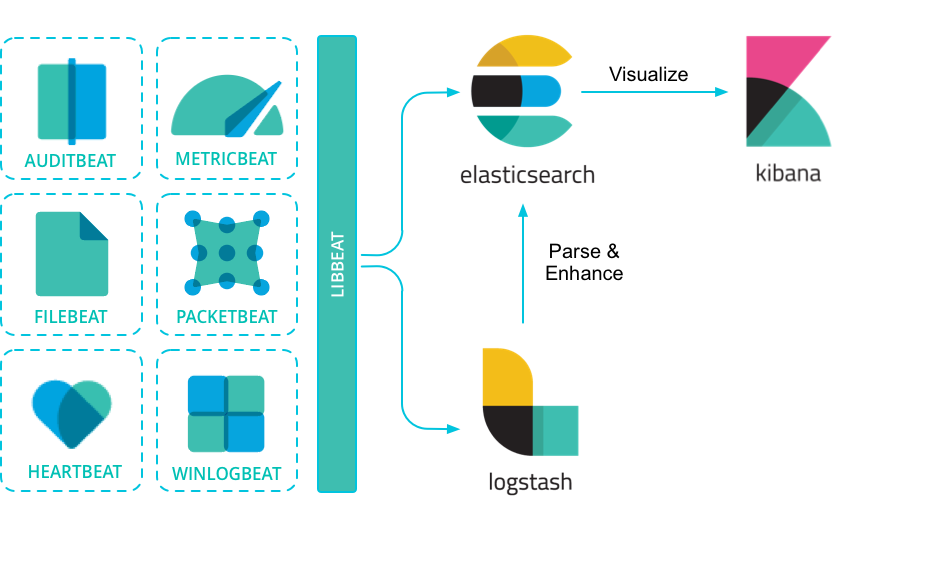
editBeats are open source data shippers that you install as agents on your servers to send operational data to Elasticsearch. Elastic provides Beats for capturing:
|
Audit data |
|
|
Log files |
|
|
Cloud data |
|
|
Availability |
|
|
Systemd journals |
|
|
Metrics |
|
|
Network traffic |
|
|
Windows event logs |
Beats can send data directly to Elasticsearch or via Logstash, where you can further process and enhance the data, before visualizing it in Kibana.

To get started, see Get started with Beats.
Want to get up and running quickly with infrastructure metrics monitoring and centralized log analytics? Try out the Metrics app and the Logs app in Kibana. For more details, see the Metrics Monitoring Guide and the Logs Monitoring Guide.
Need to capture other kinds of data?
editIf you have a specific use case to solve, we encourage you to create a community Beat. We’ve created an infrastructure to simplify the process. The libbeat library, written entirely in Go, offers the API that all Beats use to ship data to Elasticsearch, configure the input options, implement logging, and more. To learn how to create a new Beat, see the Beats Developer Guide.
On this page