- Metricbeat Reference: other versions:
- Overview
- Get started
- Set up and run
- Upgrade Metricbeat
- How Metricbeat works
- Configure
- Modules
- General settings
- Project paths
- Config file loading
- Output
- SSL
- Index lifecycle management (ILM)
- Elasticsearch index template
- Kibana endpoint
- Kibana dashboards
- Processors
- Define processors
- add_cloud_metadata
- add_docker_metadata
- add_fields
- add_host_metadata
- add_id
- add_kubernetes_metadata
- add_labels
- add_locale
- add_observer_metadata
- add_process_metadata
- add_tags
- community_id
- convert
- copy_fields
- decode_base64_field
- decode_json_fields
- decompress_gzip_field
- dissect
- dns
- drop_event
- drop_fields
- extract_array
- fingerprint
- include_fields
- registered_domain
- rename
- script
- truncate_fields
- Autodiscover
- Internal queue
- Logging
- HTTP endpoint
- Regular expression support
- metricbeat.reference.yml
- How to guides
- Beats central management
- Modules
- activemq module
- Aerospike module
- Apache module
- App Search module
- aws module
- azure module
- Beat module
- Ceph module
- CockroachDB module
- consul module
- coredns module
- Couchbase module
- couchdb module
- Docker module
- Dropwizard module
- Elasticsearch module
- Elasticsearch ccr metricset
- Elasticsearch cluster_stats metricset
- Elasticsearch enrich metricset
- Elasticsearch index metricset
- Elasticsearch index_recovery metricset
- Elasticsearch index_summary metricset
- Elasticsearch ml_job metricset
- Elasticsearch node metricset
- Elasticsearch node_stats metricset
- Elasticsearch pending_tasks metricset
- Elasticsearch shard metricset
- envoyproxy module
- Etcd module
- Golang module
- Google Cloud Platform module
- Graphite module
- HAProxy module
- HTTP module
- Jolokia module
- Kafka module
- Kibana module
- Kubernetes module
- Kubernetes apiserver metricset
- Kubernetes container metricset
- Kubernetes controllermanager metricset
- Kubernetes event metricset
- Kubernetes node metricset
- Kubernetes pod metricset
- Kubernetes proxy metricset
- Kubernetes scheduler metricset
- Kubernetes state_container metricset
- Kubernetes state_cronjob metricset
- Kubernetes state_deployment metricset
- Kubernetes state_node metricset
- Kubernetes state_persistentvolumeclaim metricset
- Kubernetes state_pod metricset
- Kubernetes state_replicaset metricset
- Kubernetes state_resourcequota metricset
- Kubernetes state_service metricset
- Kubernetes state_statefulset metricset
- Kubernetes system metricset
- Kubernetes volume metricset
- kvm module
- Logstash module
- Memcached module
- MongoDB module
- MSSQL module
- Munin module
- MySQL module
- Nats module
- Nginx module
- Oracle module
- PHP_FPM module
- PostgreSQL module
- Prometheus module
- RabbitMQ module
- Redis module
- sql module
- Stan module
- Statsd module
- System module
- System core metricset
- System cpu metricset
- System diskio metricset
- System entropy metricset
- System filesystem metricset
- System fsstat metricset
- System load metricset
- System memory metricset
- System network metricset
- System network_summary metricset
- System process metricset
- System process_summary metricset
- System raid metricset
- System service metricset
- System socket metricset
- System socket_summary metricset
- System uptime metricset
- Tomcat module
- traefik module
- uwsgi module
- vSphere module
- Windows module
- ZooKeeper module
- Exported fields
- activemq fields
- Aerospike fields
- Apache fields
- App Search fields
- aws fields
- azure fields
- Beat fields
- Beat fields
- Ceph fields
- Cloud provider metadata fields
- CockroachDB fields
- Common fields
- consul fields
- coredns fields
- Couchbase fields
- couchdb fields
- Docker fields
- Docker fields
- Dropwizard fields
- ECS fields
- Elasticsearch fields
- envoyproxy fields
- Etcd fields
- Golang fields
- Google Cloud Platform fields
- Graphite fields
- HAProxy fields
- Host fields
- HTTP fields
- Jolokia fields
- Jolokia Discovery autodiscover provider fields
- Kafka fields
- Kibana fields
- Kubernetes fields
- Kubernetes fields
- kvm fields
- Logstash fields
- Memcached fields
- MongoDB fields
- MSSQL fields
- Munin fields
- MySQL fields
- Nats fields
- Nginx fields
- Oracle fields
- PHP_FPM fields
- PostgreSQL fields
- Process fields
- Prometheus fields
- RabbitMQ fields
- Redis fields
- sql fields
- Stan fields
- Statsd fields
- System fields
- Tomcat fields
- traefik fields
- uwsgi fields
- vSphere fields
- Windows fields
- ZooKeeper fields
- Monitor
- Secure
- Troubleshoot
- Get help
- Debug
- Common problems
- "open /compat/linux/proc: no such file or directory" error on FreeBSD
- Metricbeat collects system metrics for interfaces you didn’t configure
- Metricbeat uses too much bandwidth
- Error loading config file
- Found unexpected or unknown characters
- Logstash connection doesn’t work
- @metadata is missing in Logstash
- Not sure whether to use Logstash or Beats
- SSL client fails to connect to Logstash
- Monitoring UI shows fewer Beats than expected
- Contribute to Beats
aws module
editaws module
editThis module periodically fetches monitoring metrics from AWS CloudWatch using GetMetricData API for AWS services. Note: extra AWS charges on GetMetricData API requests will be generated by this module.
The default metricsets are ec2, sqs, s3_request, s3_daily_storage, cloudwatch and rds.
Module-specific configuration notes
editThe aws module requires AWS credentials configuration in order to make AWS API calls.
Users can either use AWS_ACCESS_KEY_ID, AWS_SECRET_ACCESS_KEY and/or
AWS_SESSION_TOKEN, or use shared AWS credentials file.
Please see AWS credentials options for more details.
This module also accepts optional configuration regions to specify which
AWS regions to query metrics from. If the regions parameter is not set in the
config file, then by default, the aws module will query metrics from all available
AWS regions.
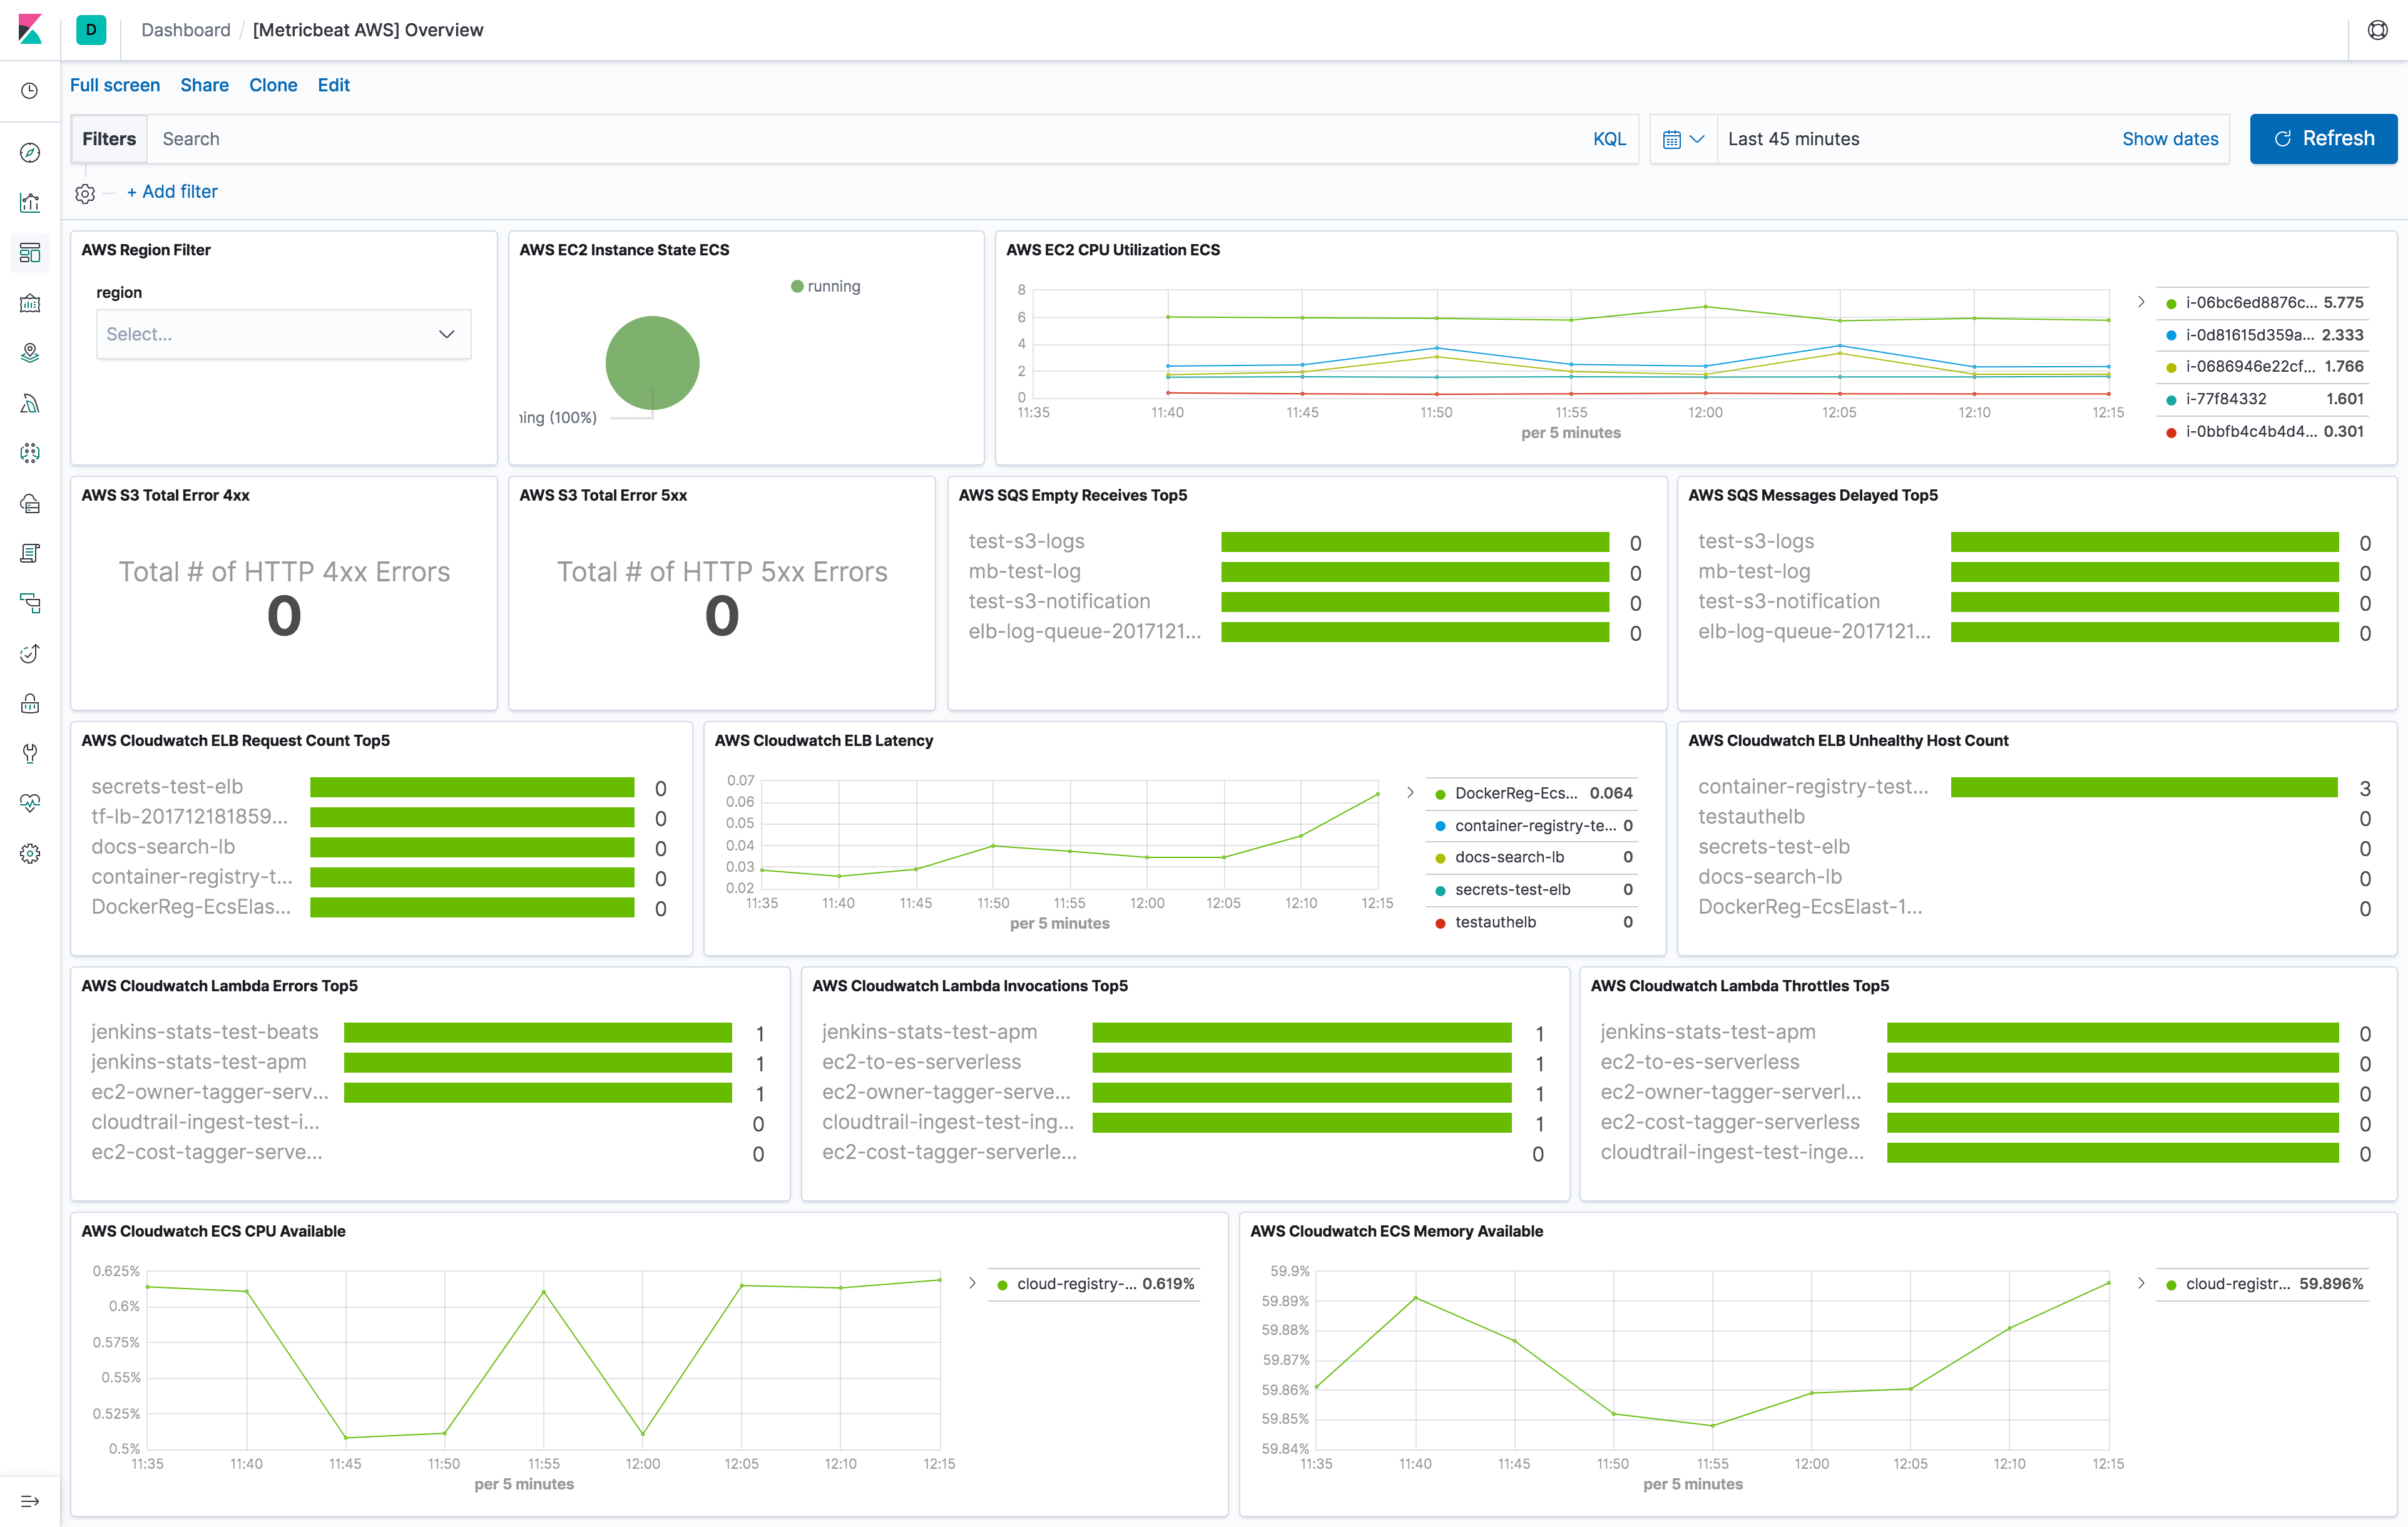
The aws module comes with a predefined dashboard. For example:
Metricsets
editCurrently, we have ec2, sqs, s3_request, s3_daily_storage, cloudwatch, billing,ebs, elb, rds, sns, sqs and usage metricset in aws module.
Collecting tags for ec2, cloudwatch, ebs and elb metricset is supported.
- tags.: Tag key value pairs from aws resources. A tag is a label that user assigns to an AWS resource.
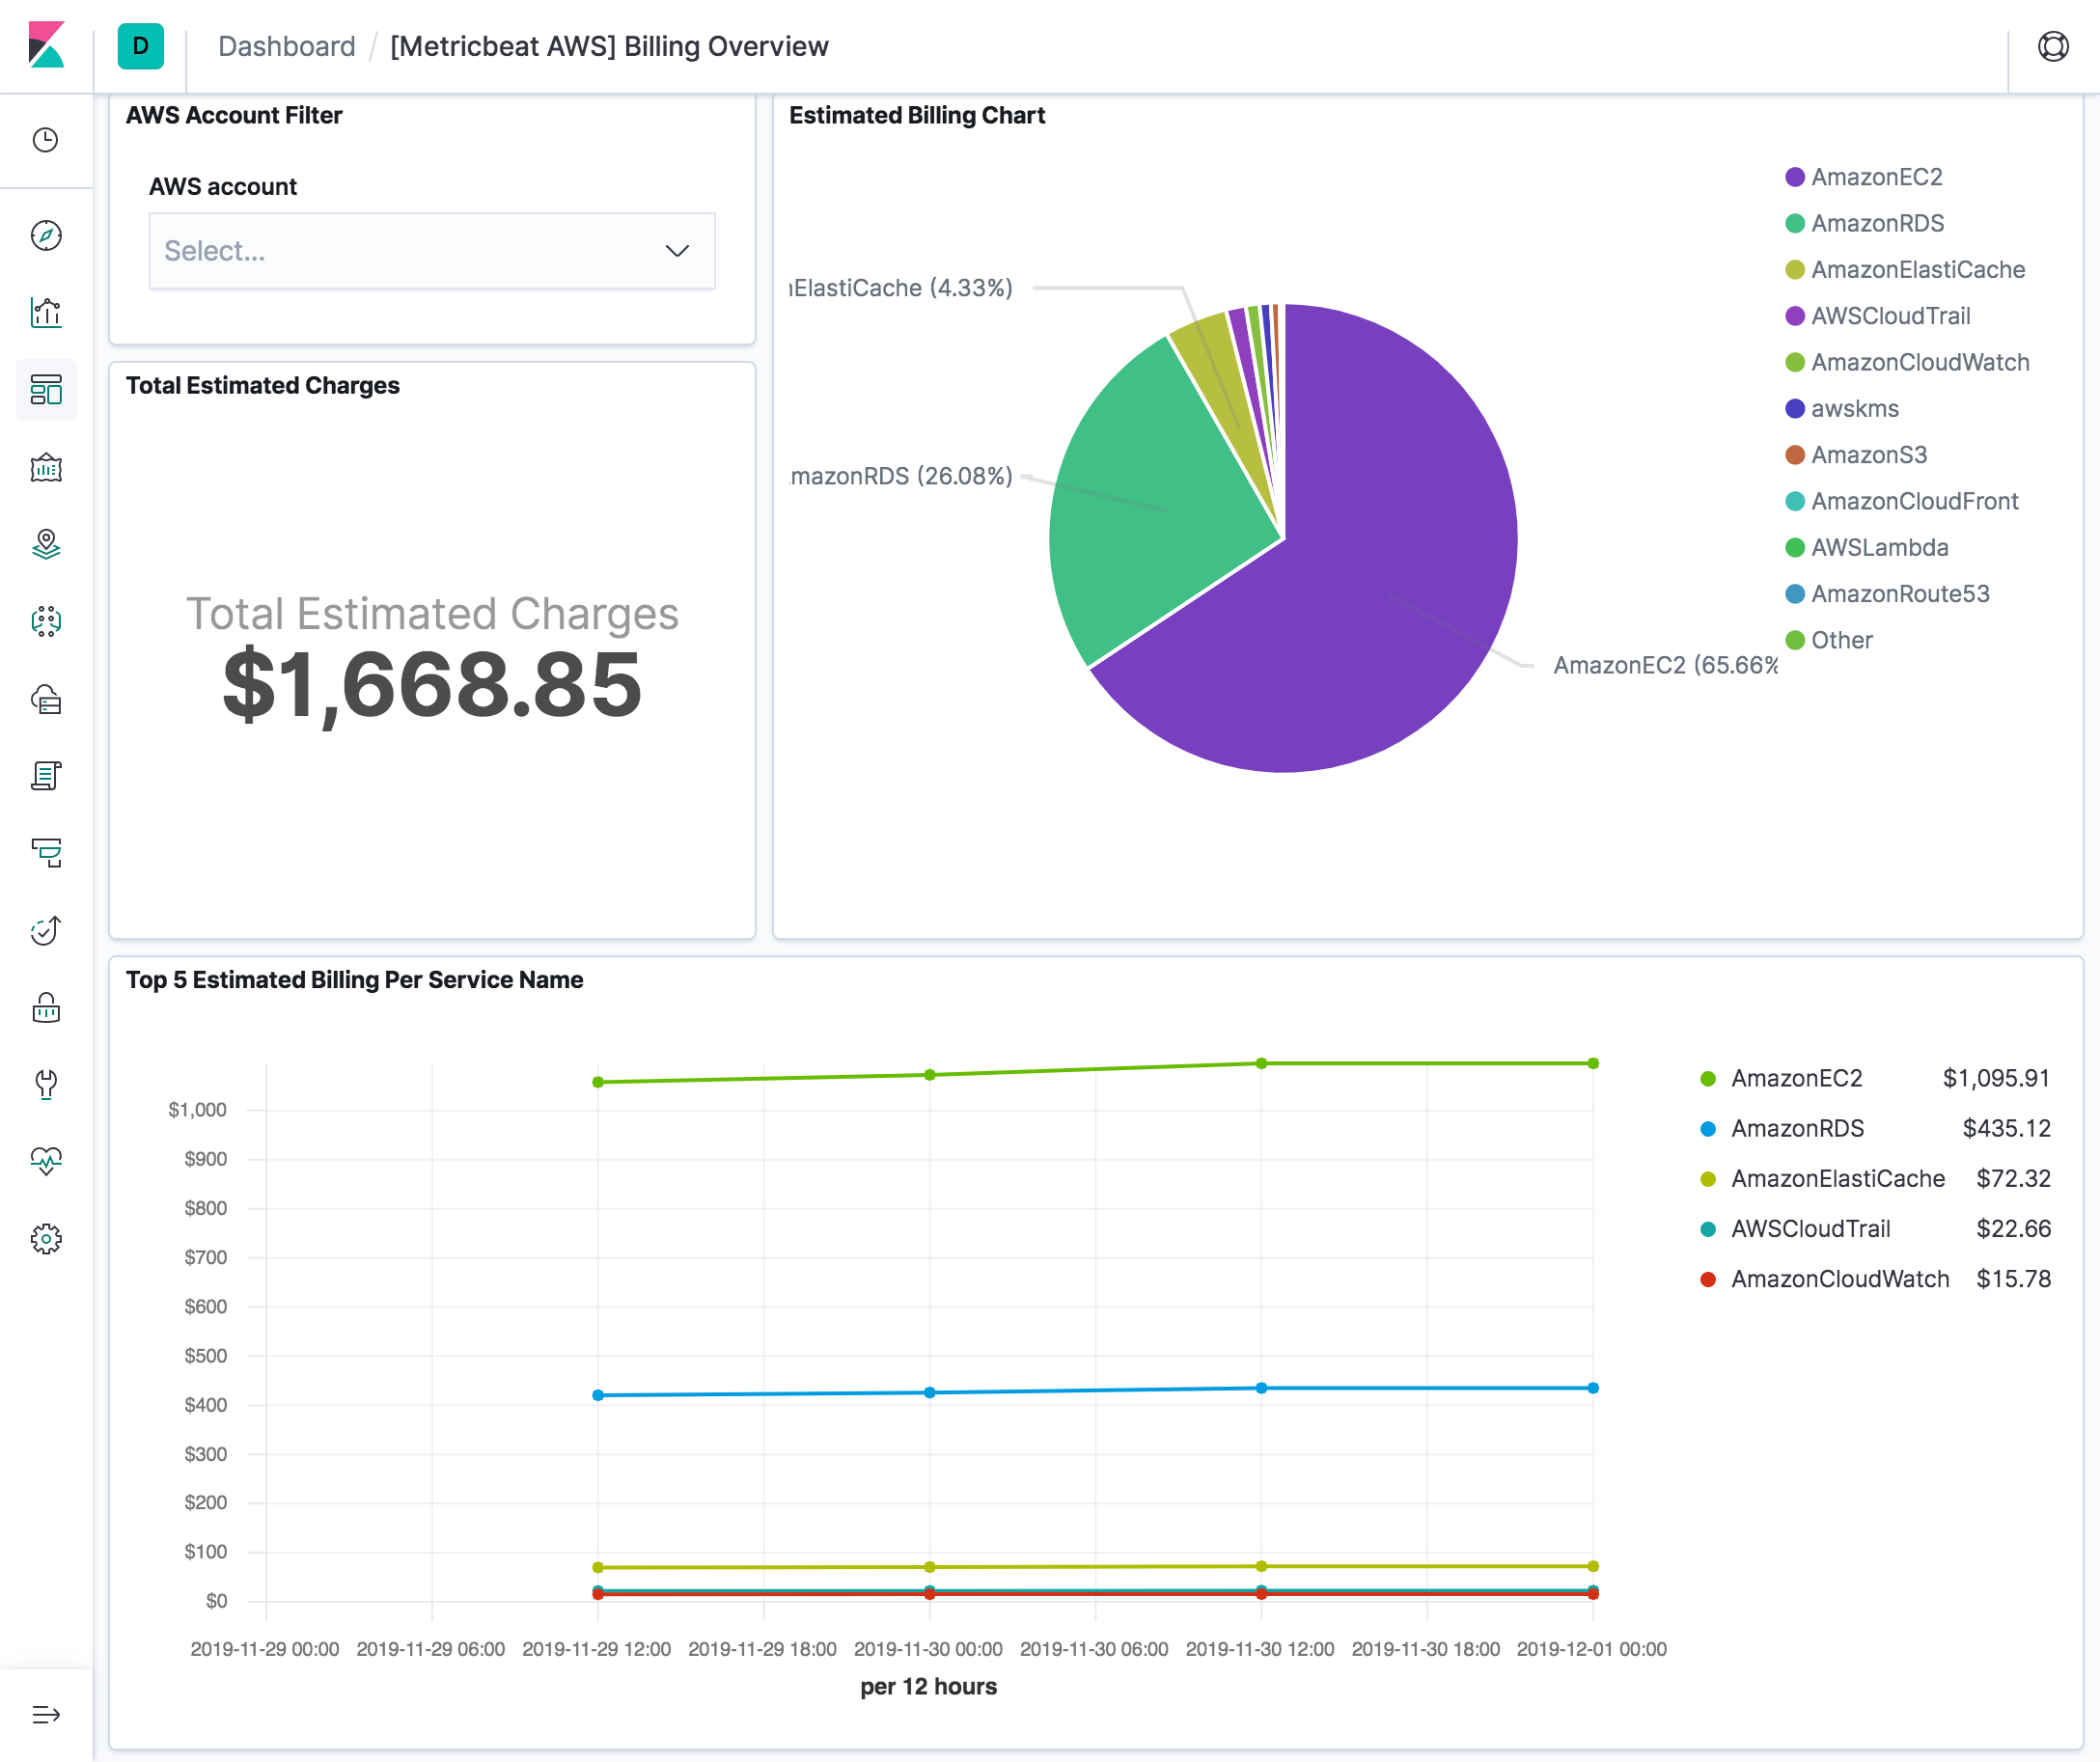
billing
editBilling metric data includes the estimated charges for every service in the AWS
account and the estimated overall total charge for the AWS account. The estimated
charges are calculated and sent several times daily to CloudWatch. Therefore,
period in aws module configuration is set to 12h.
The billing metricset comes with a predefined dashboard:
cloudwatch
editThis metricset allows users to query metrics from AWS CloudWatch with any given namespaces or specific instance with a given period. Please see AWS Services That Publish CloudWatch Metrics for a list of AWS services that publish metrics to CloudWatch.
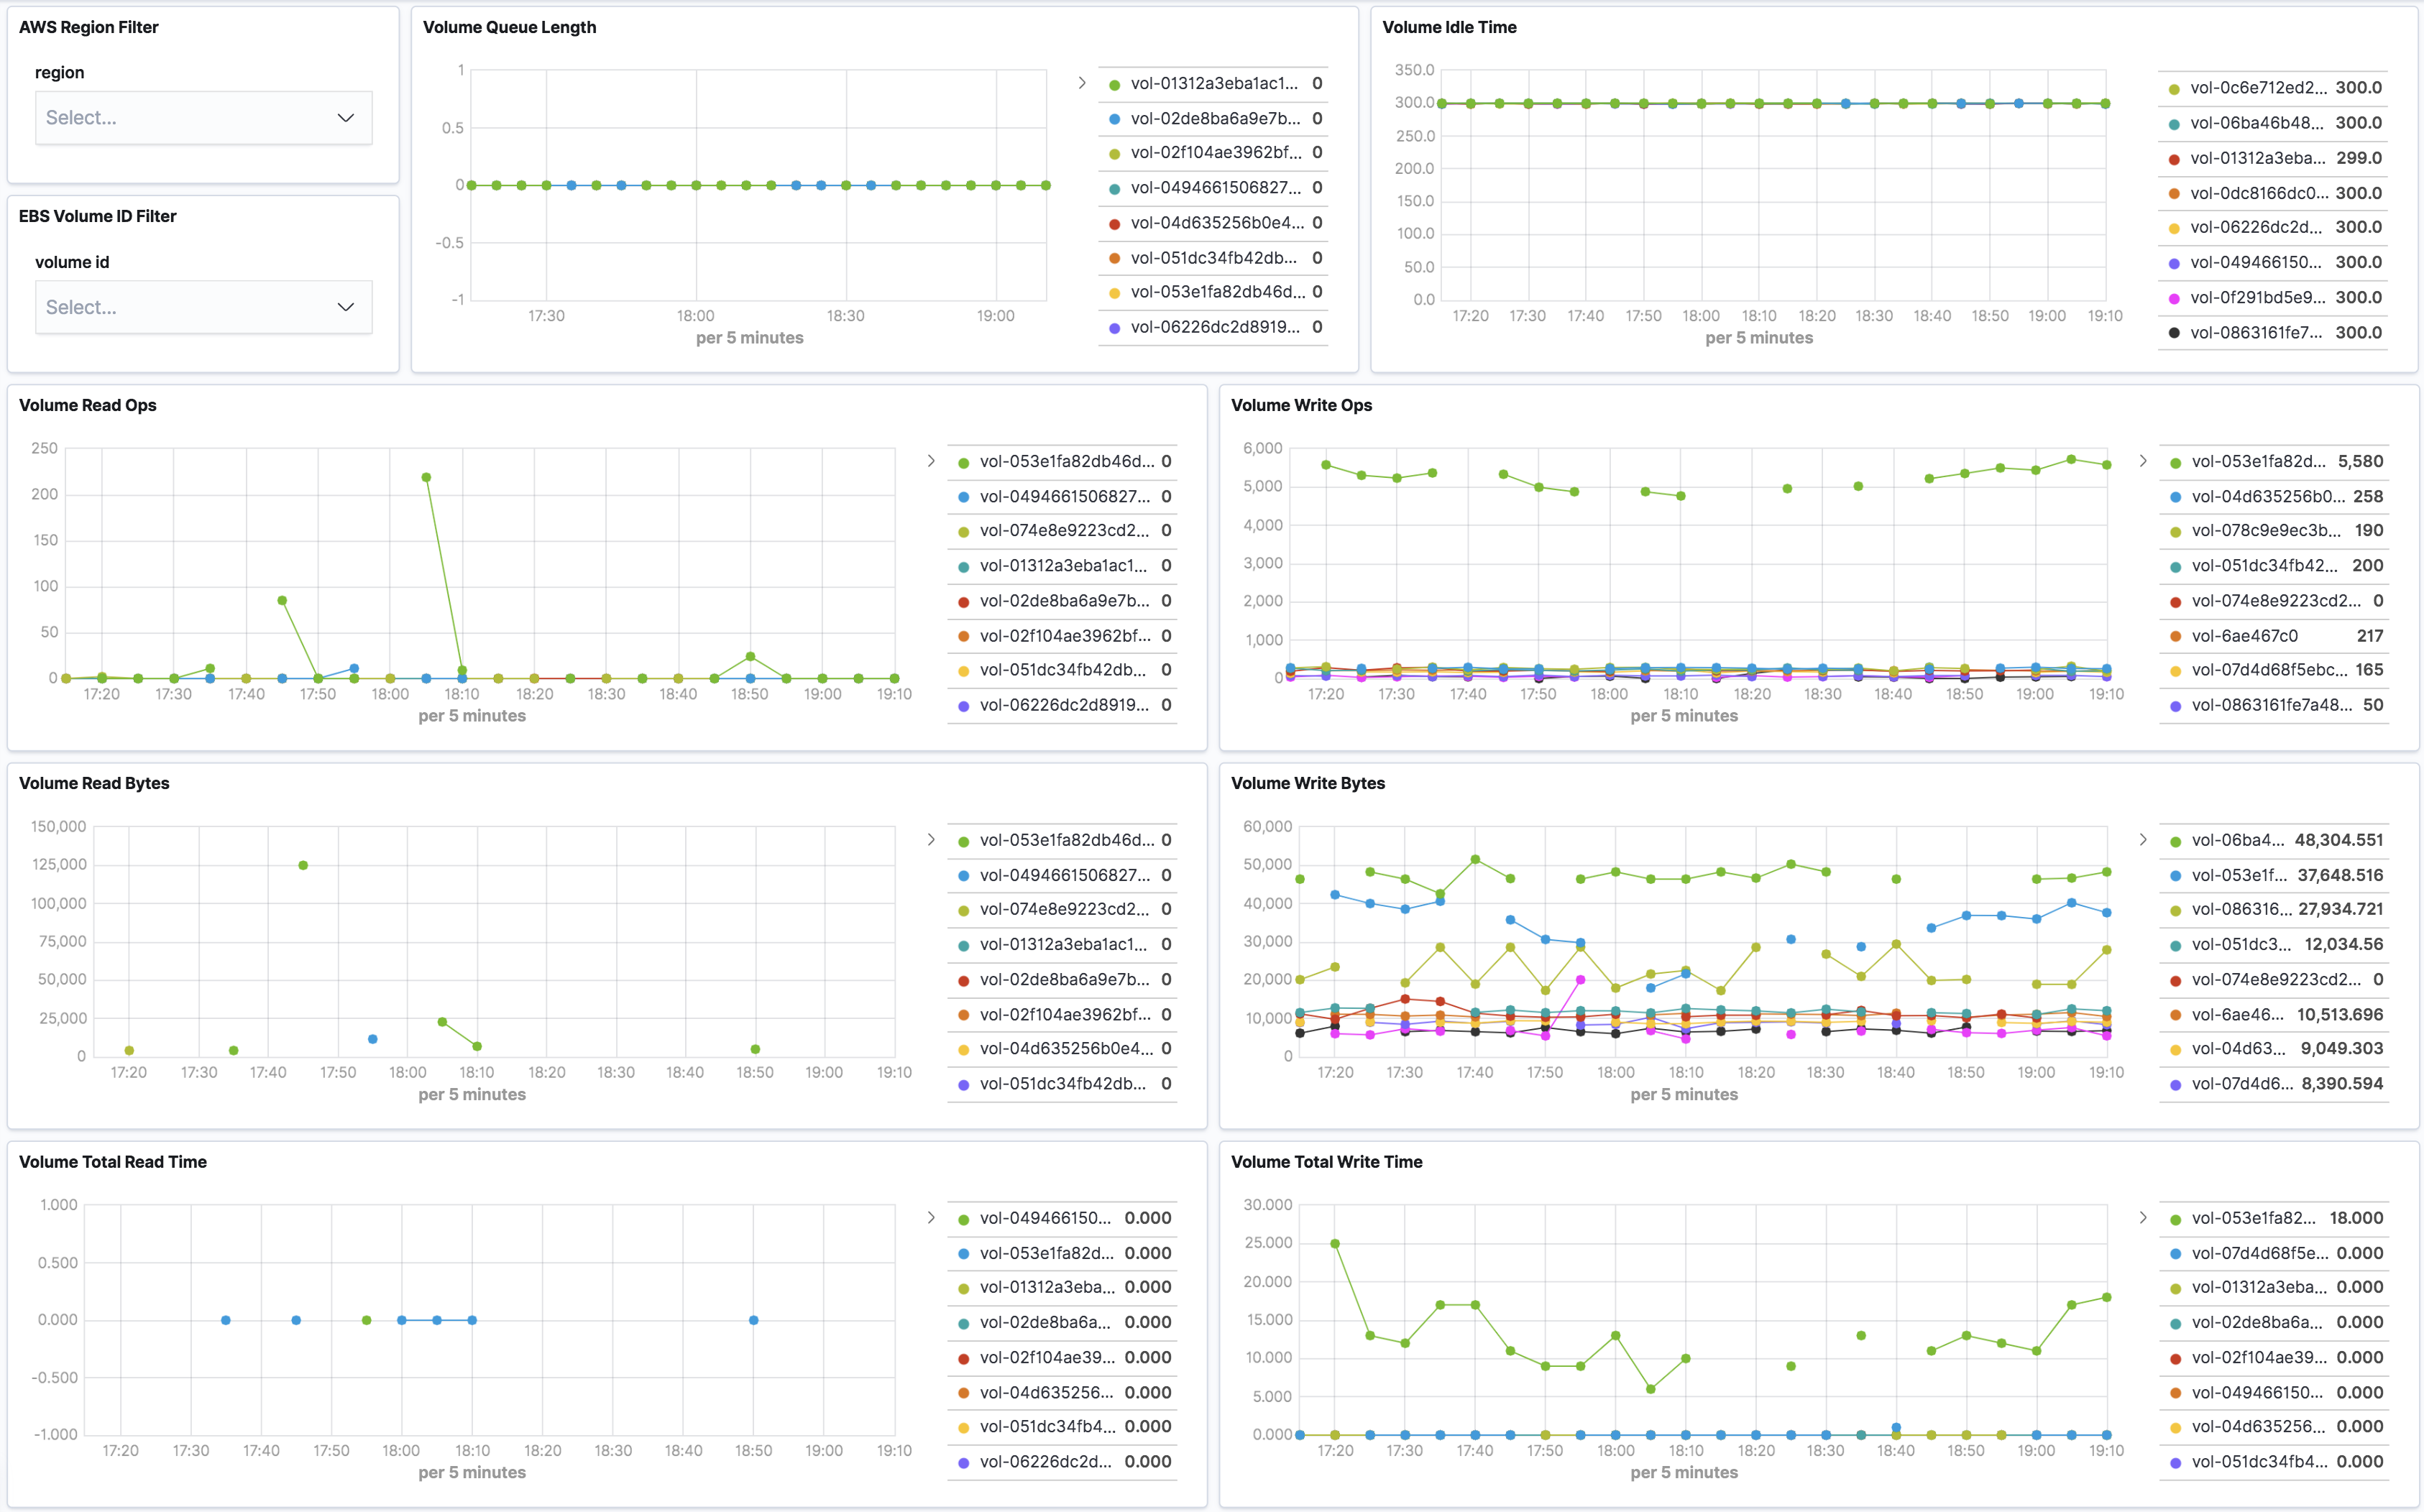
ebs
editFor basic monitoring in AWS EBS volumes, data is available automatically in
5-minute periods at no charge. This includes data for the root device volumes
for EBS-backed instances. User can also enable detailed monitoring for
provisioned IOPS SSD (io1) volumes to automatically send one-minute metrics to
CloudWatch. Default period in aws module configuration is set to 5m for ebs
metricset.
The ebs metricset comes with a predefined dashboard:
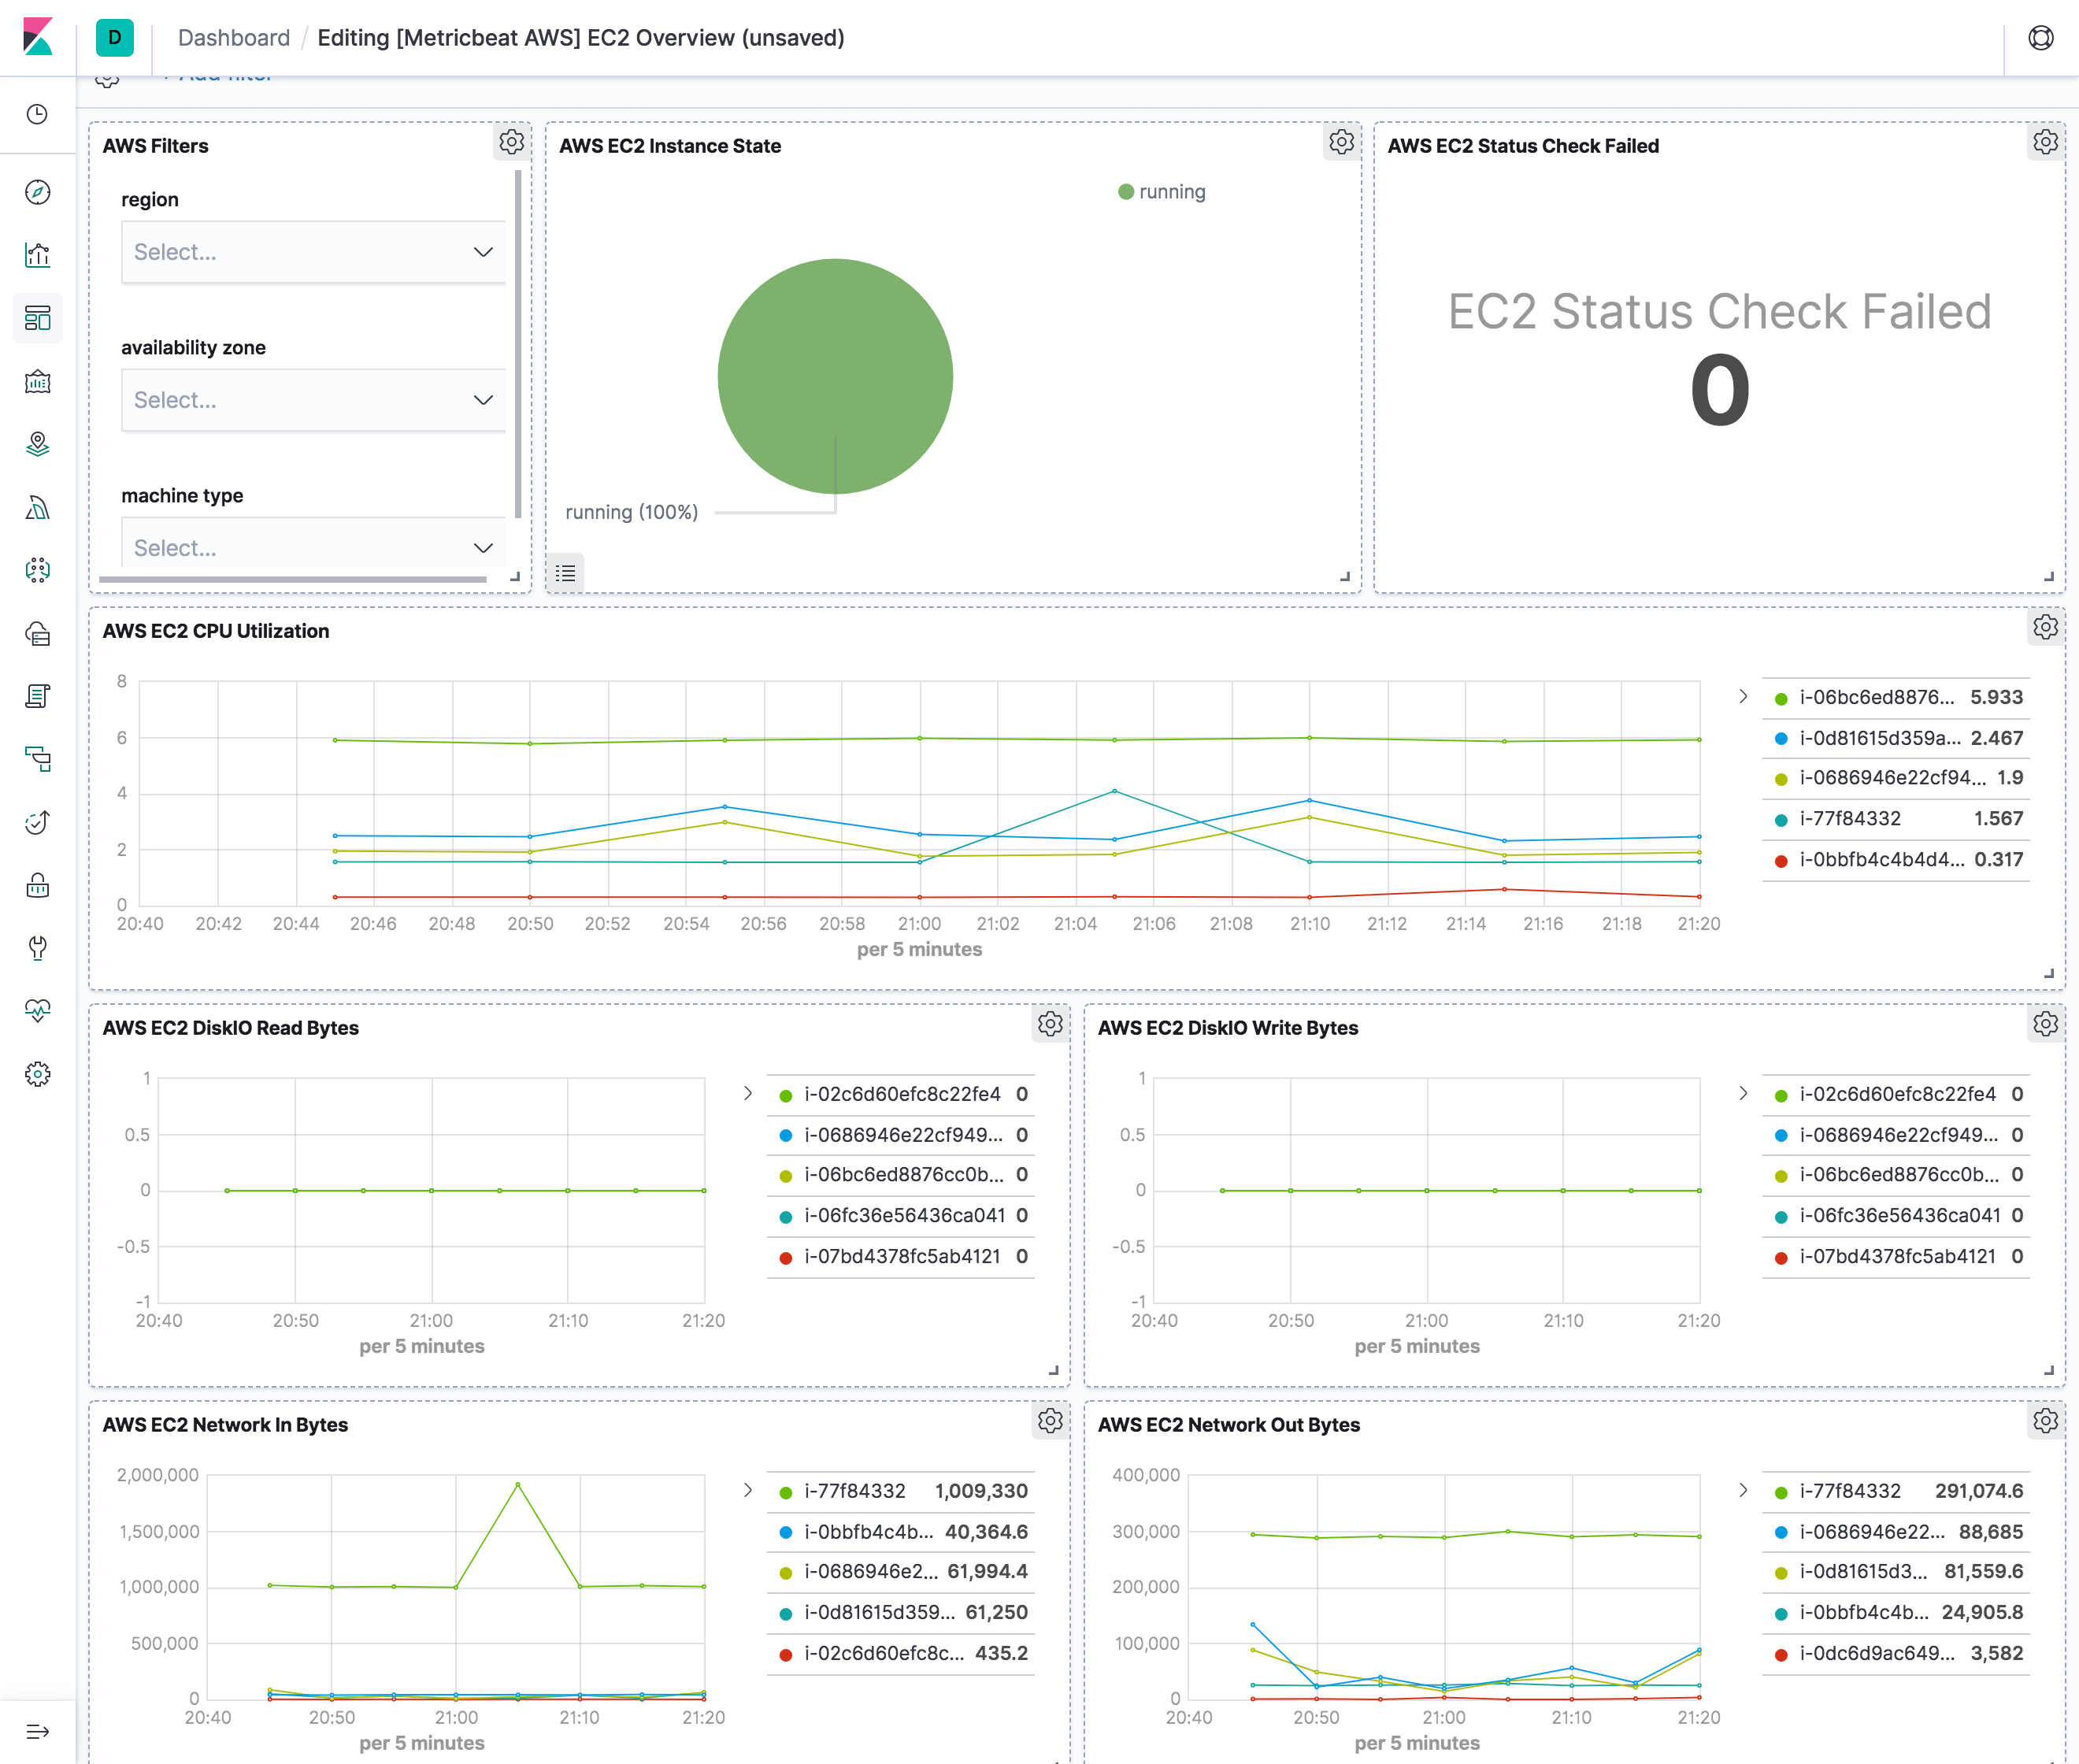
ec2
editBy default, Amazon EC2 sends metric data to CloudWatch every 5 minutes. With this basic monitoring, period in aws module
configuration should be larger or equal than 300s. If period is set to be less than 300s, the same cloudwatch metrics
will be collected more than once which will cause extra fees without getting more granular metrics. For example, in US East (N. Virginia) region, it costs
$0.01/1000 metrics requested using GetMetricData. Please see AWS CloudWatch Pricing
for more details. To avoid unnecessary charges, period is preferred to be set to 300s or multiples of 300s, such as
600s and 900s. For more granular monitoring data you can enable detailed monitoring on the instance to get metrics every 1 minute. Please see
Enabling Detailed Monitoring for instructions
on how to enable detailed monitoring. With detailed monitoring enabled, period in aws module configuration can be any number
larger than 60s. Since AWS sends metric data to CloudWatch in 1-minute periods, setting metricbeat module period less
than 60s will cause extra API requests which means extra charges on AWS. To avoid unnecessary charges, period is
preferred to be set to 60s or multiples of 60s, such as 120s and 180s.
The ec2 metricset comes with a predefined dashboard:
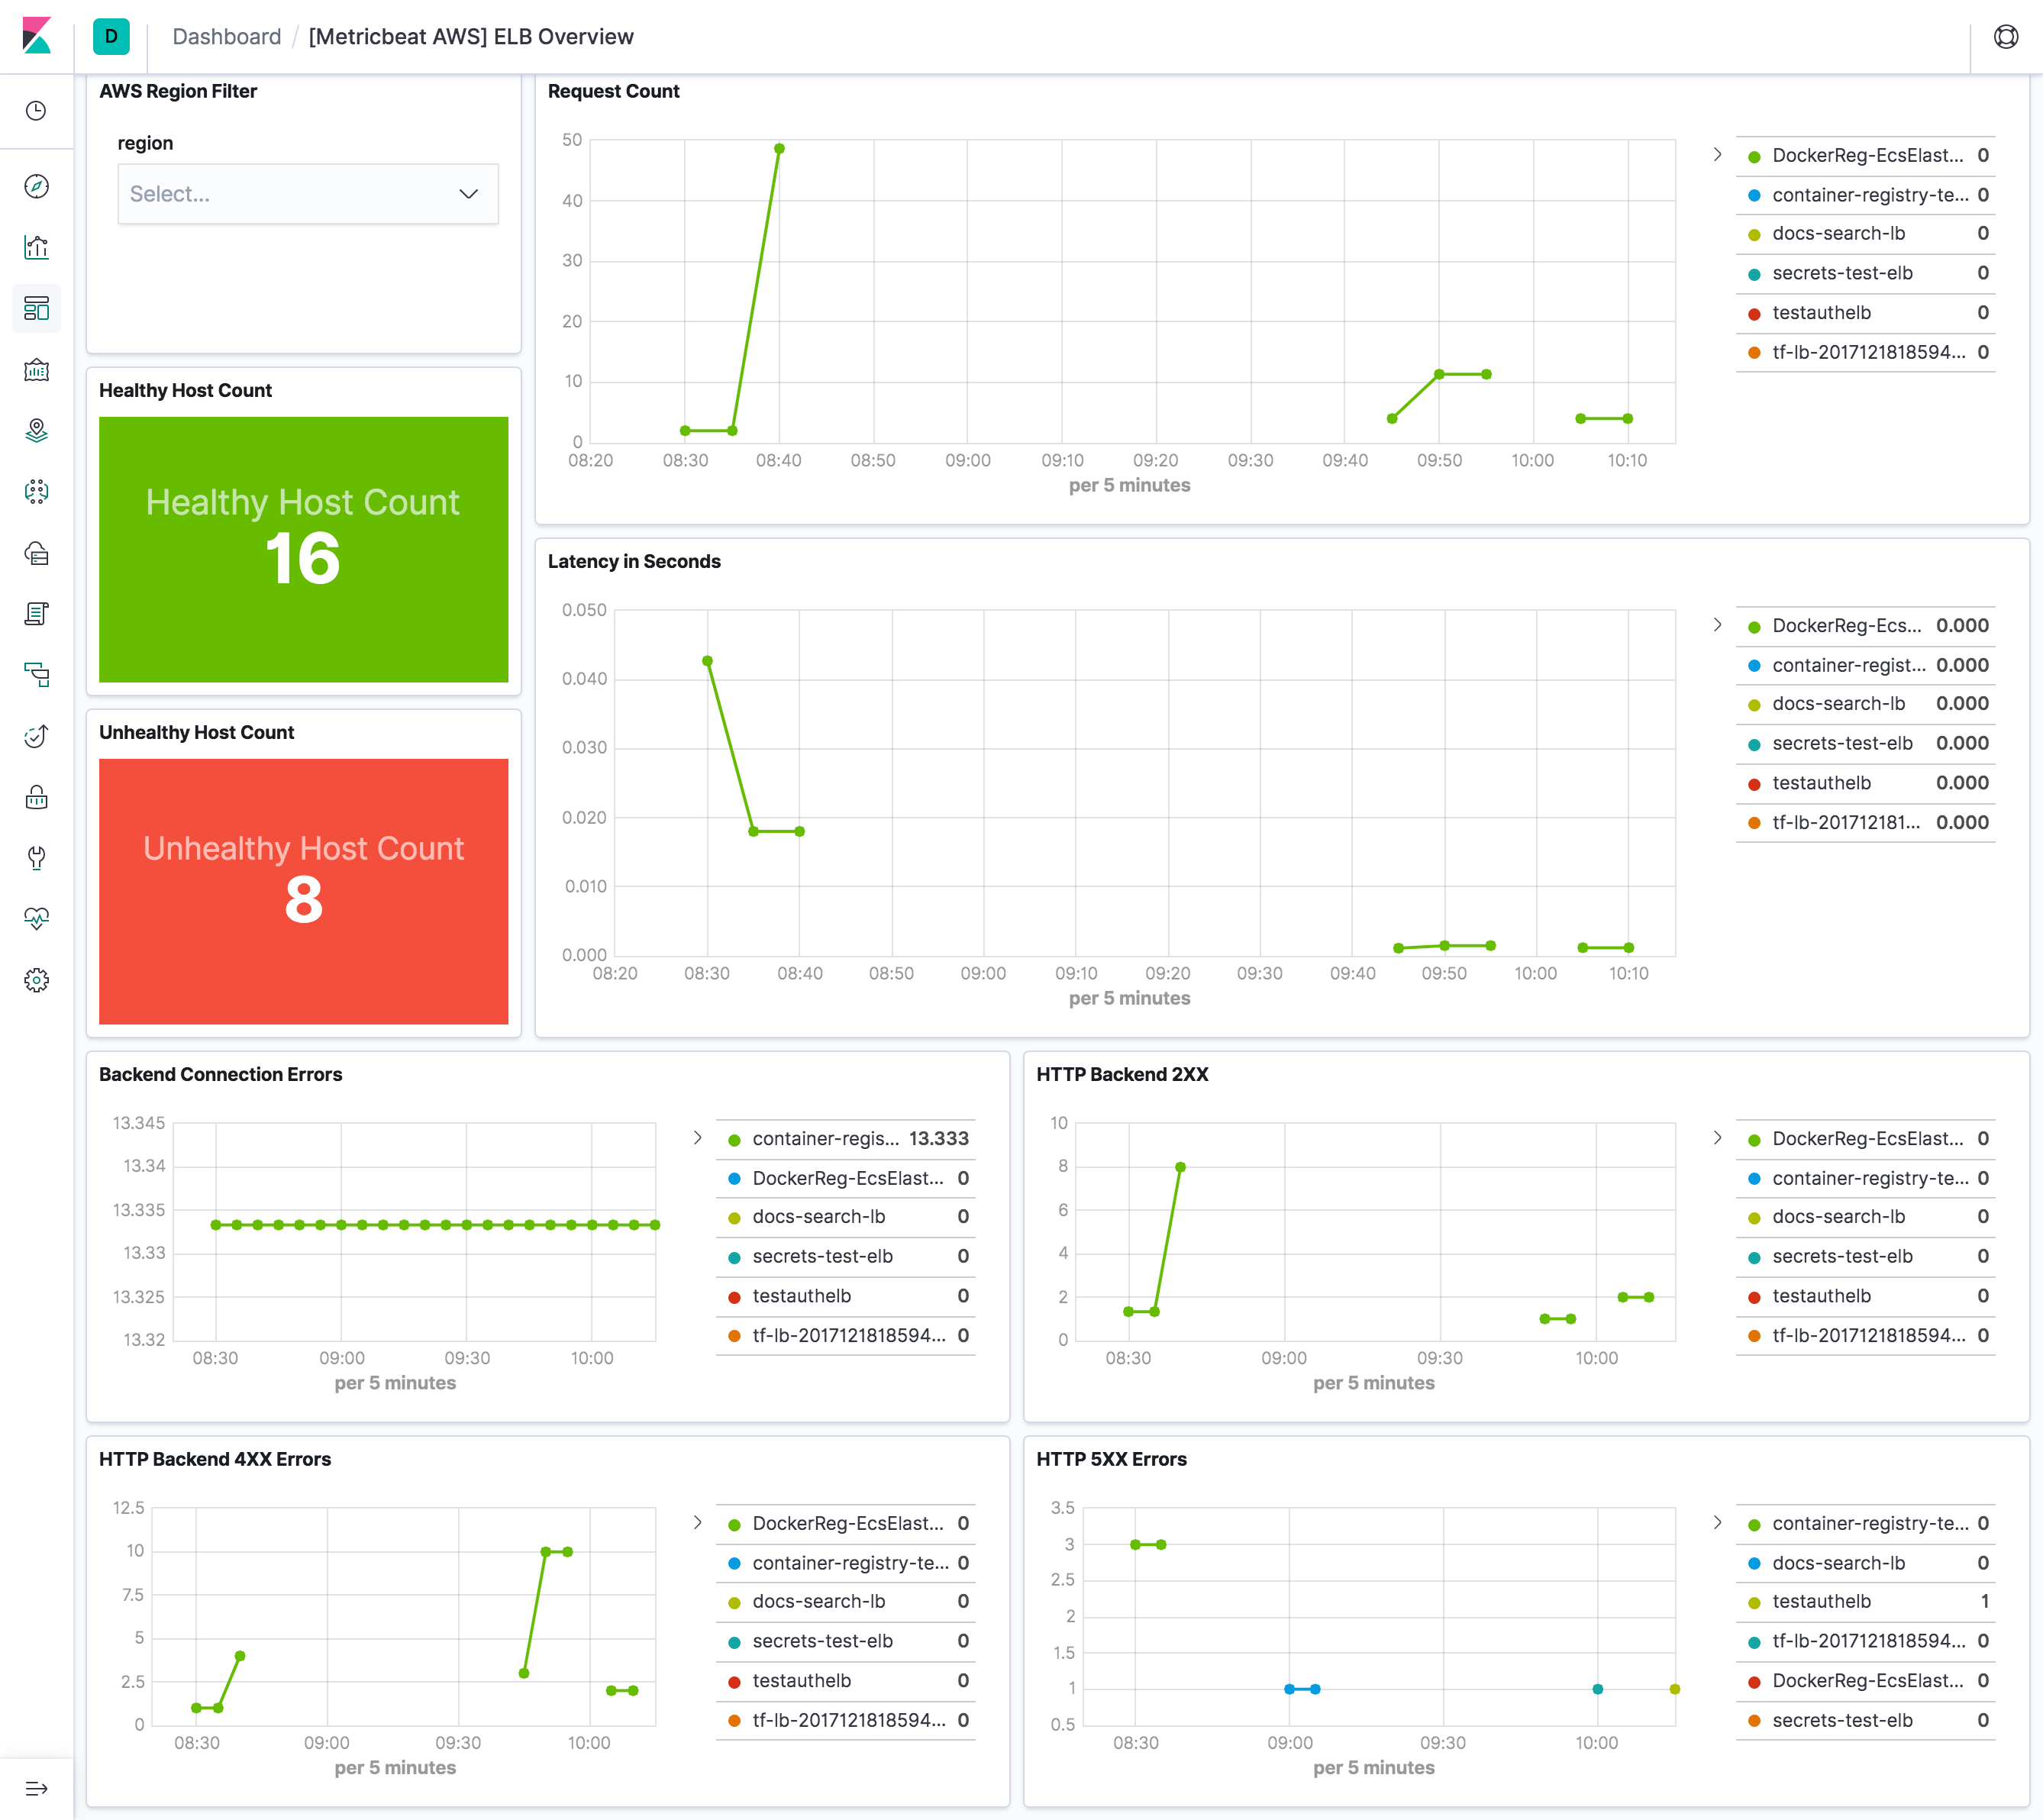
elb
editelb metricset collects CloudWatch metrics from classic load balancer, application load balancer and network load balancer.
All three kinds of elastic load balancing reports metrics to Cloudwatch only when requests are flowing
through the load balancer. If there are requests flowing through the load balancer,
Elastic Load Balancing measures and sends its metrics in 60-second intervals.
If there are no requests flowing through the load balancer or no data for a metric,
the metric is not reported.
Therefore, period in aws module configuration is set to 1m.
The elb metricset comes with a predefined dashboard:
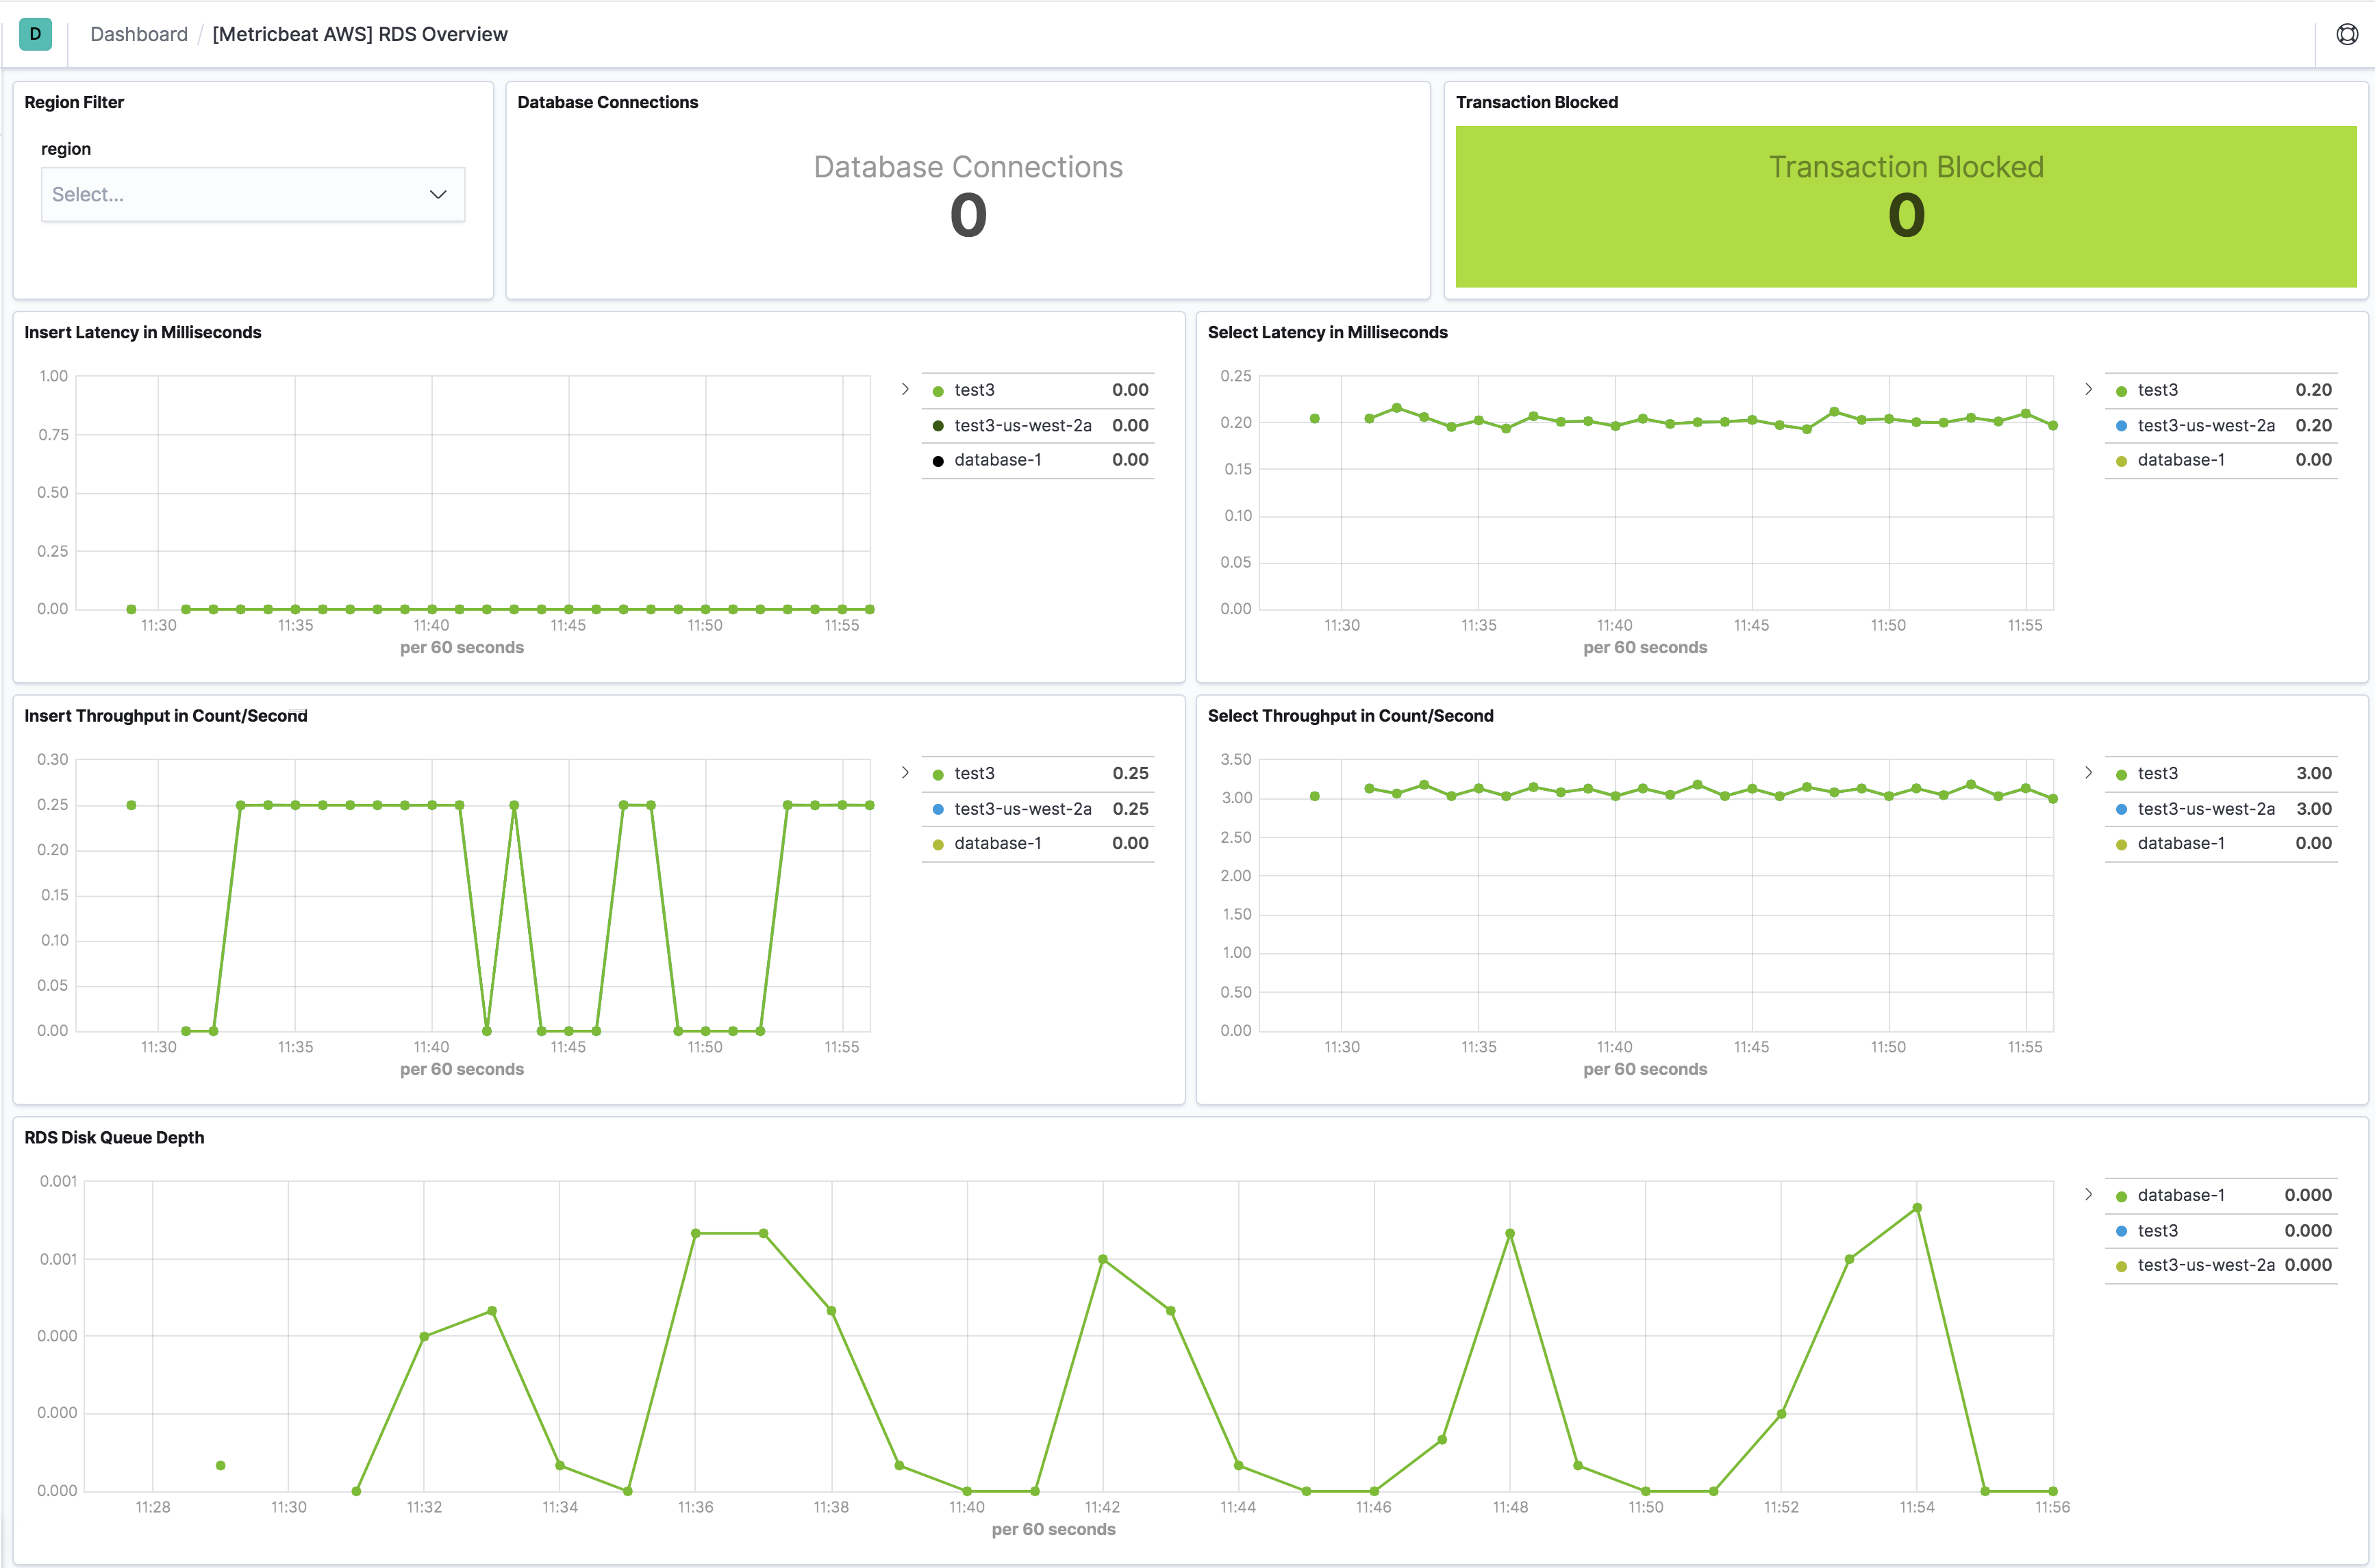
rds
editperiod for rds metricset is recommended to be 60s or multiples of 60s because Amazon RDS sends metrics and
dimensions to Amazon CloudWatch every minute.
The rds metricset comes with a predefined dashboard:
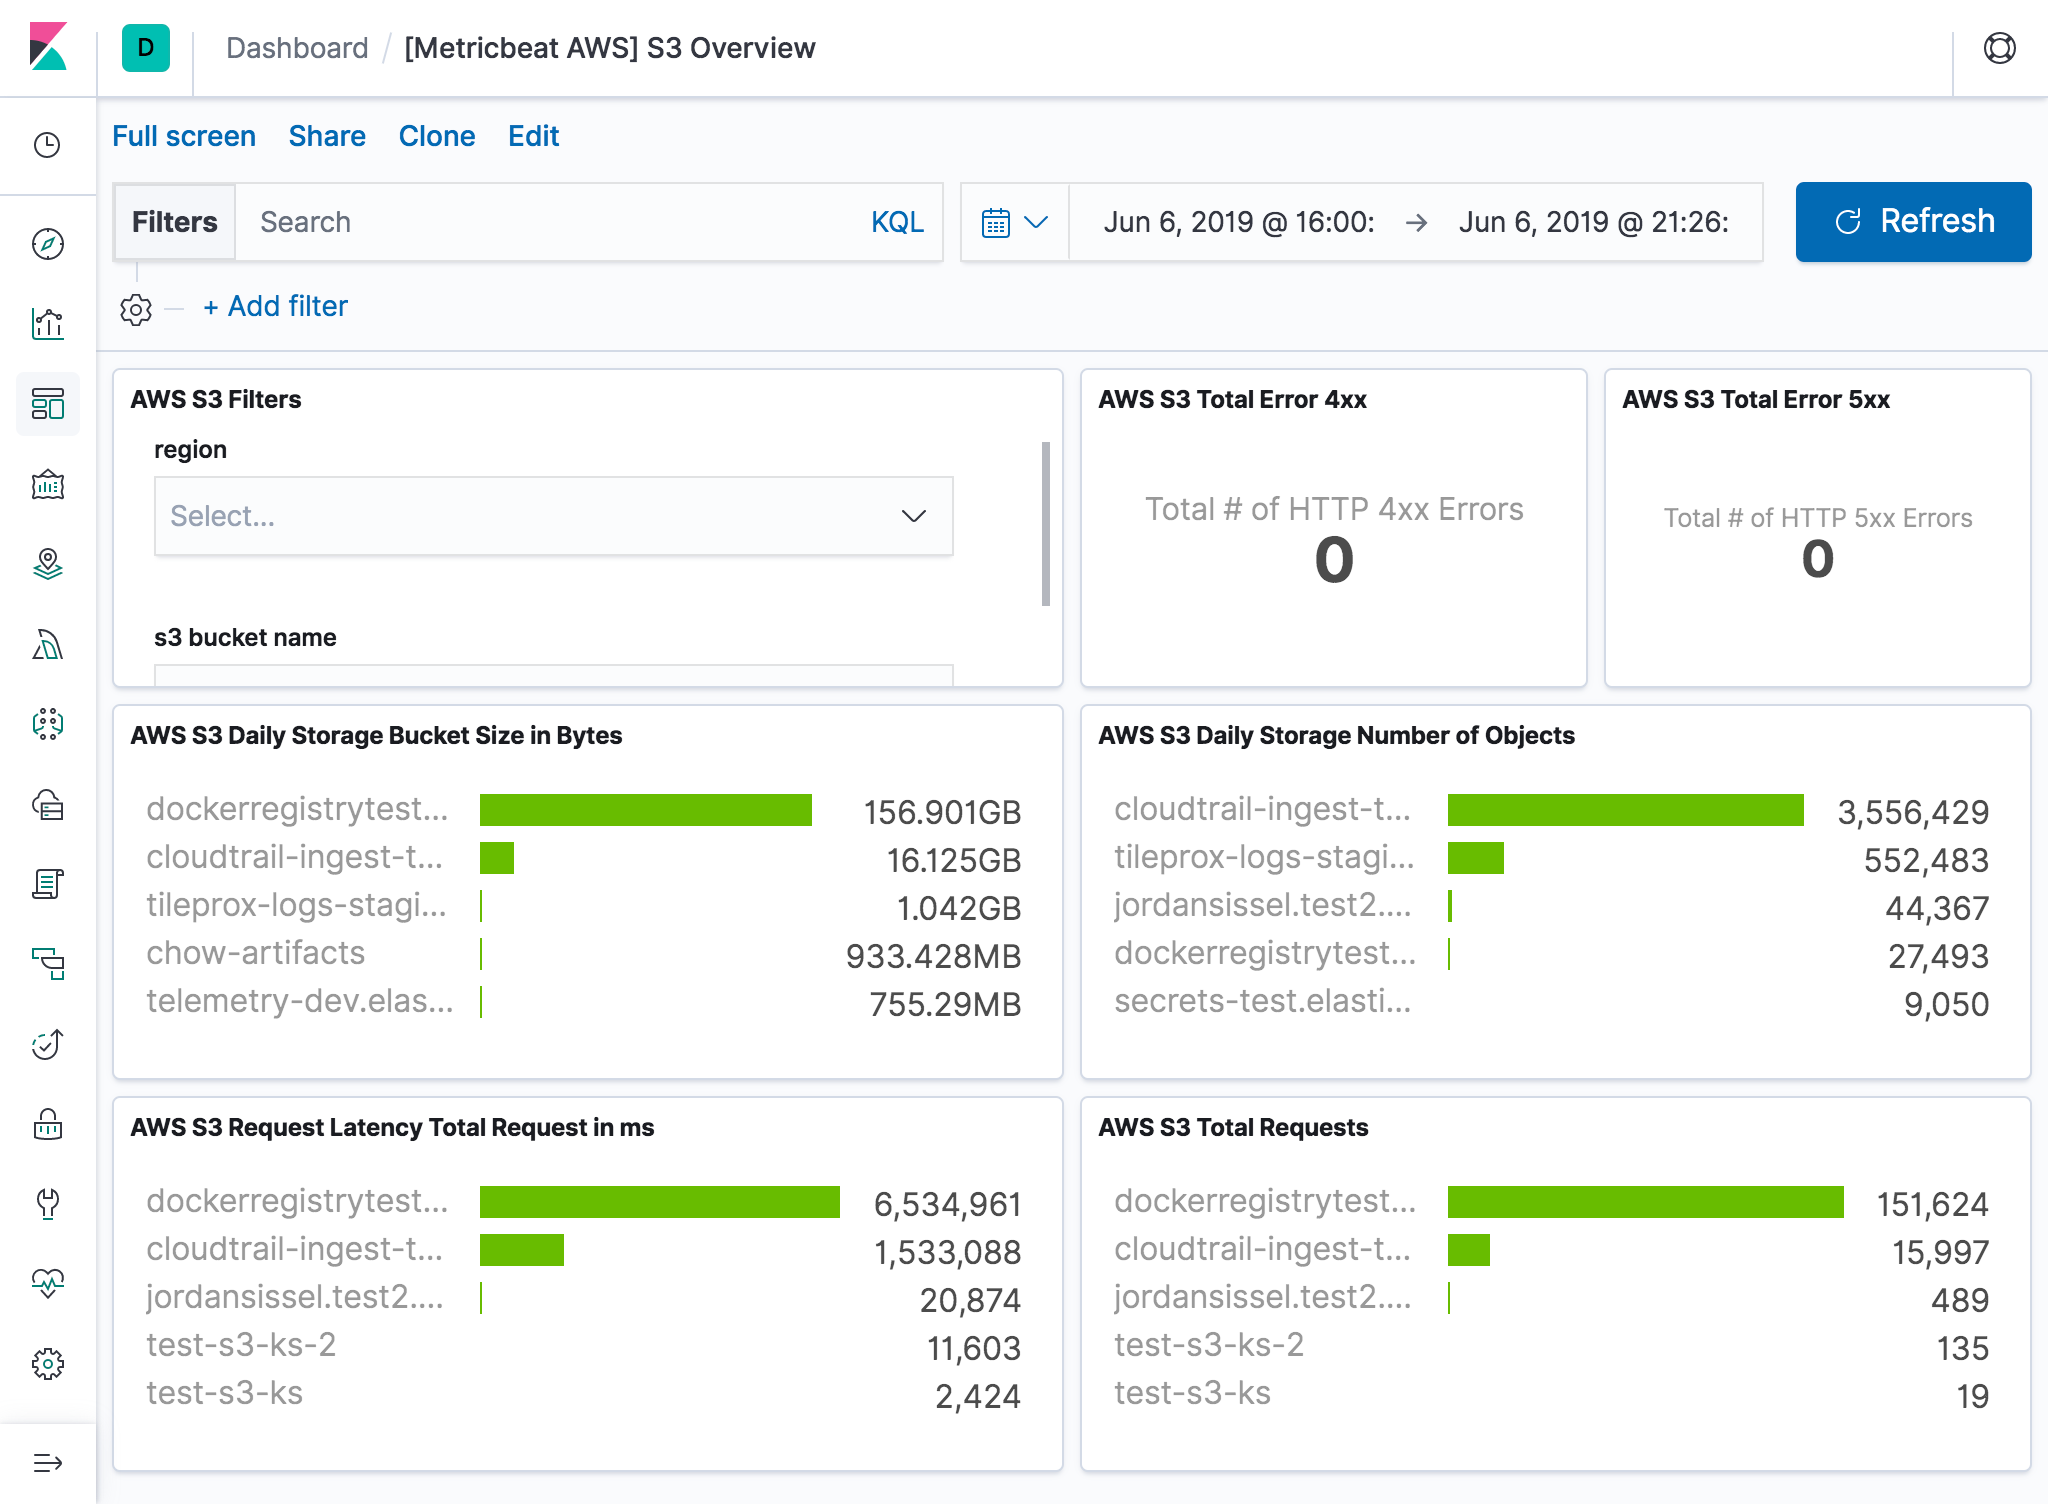
s3_daily_storage
editDaily storage metrics for S3 buckets are reported once per day with no additional cost. Since they are daily metrics,
period for s3_daily_storage metricset is recommended to be 86400s or multiples of 86400s.
s3_request
editRequest metrics are available
at 1-minute intervals with additional charges. The s3_request metricset will give more
granular data to track S3 bucket usage. The period for s3_request metricset can be set to 60s or multiples of 60s.
But because of the extra charges for querying these metrics, the period is recommended to set to 86400s. The user can
always adjust this to the granularity they want. Request metrics are not enabled by default for S3 buckets. Please see
How to
Configure Request Metrics for S3 for instructions on how to enable request metrics for
each S3 bucket.
The s3_daily_storage and s3_request metricset comes with a predefined combined dashboard:
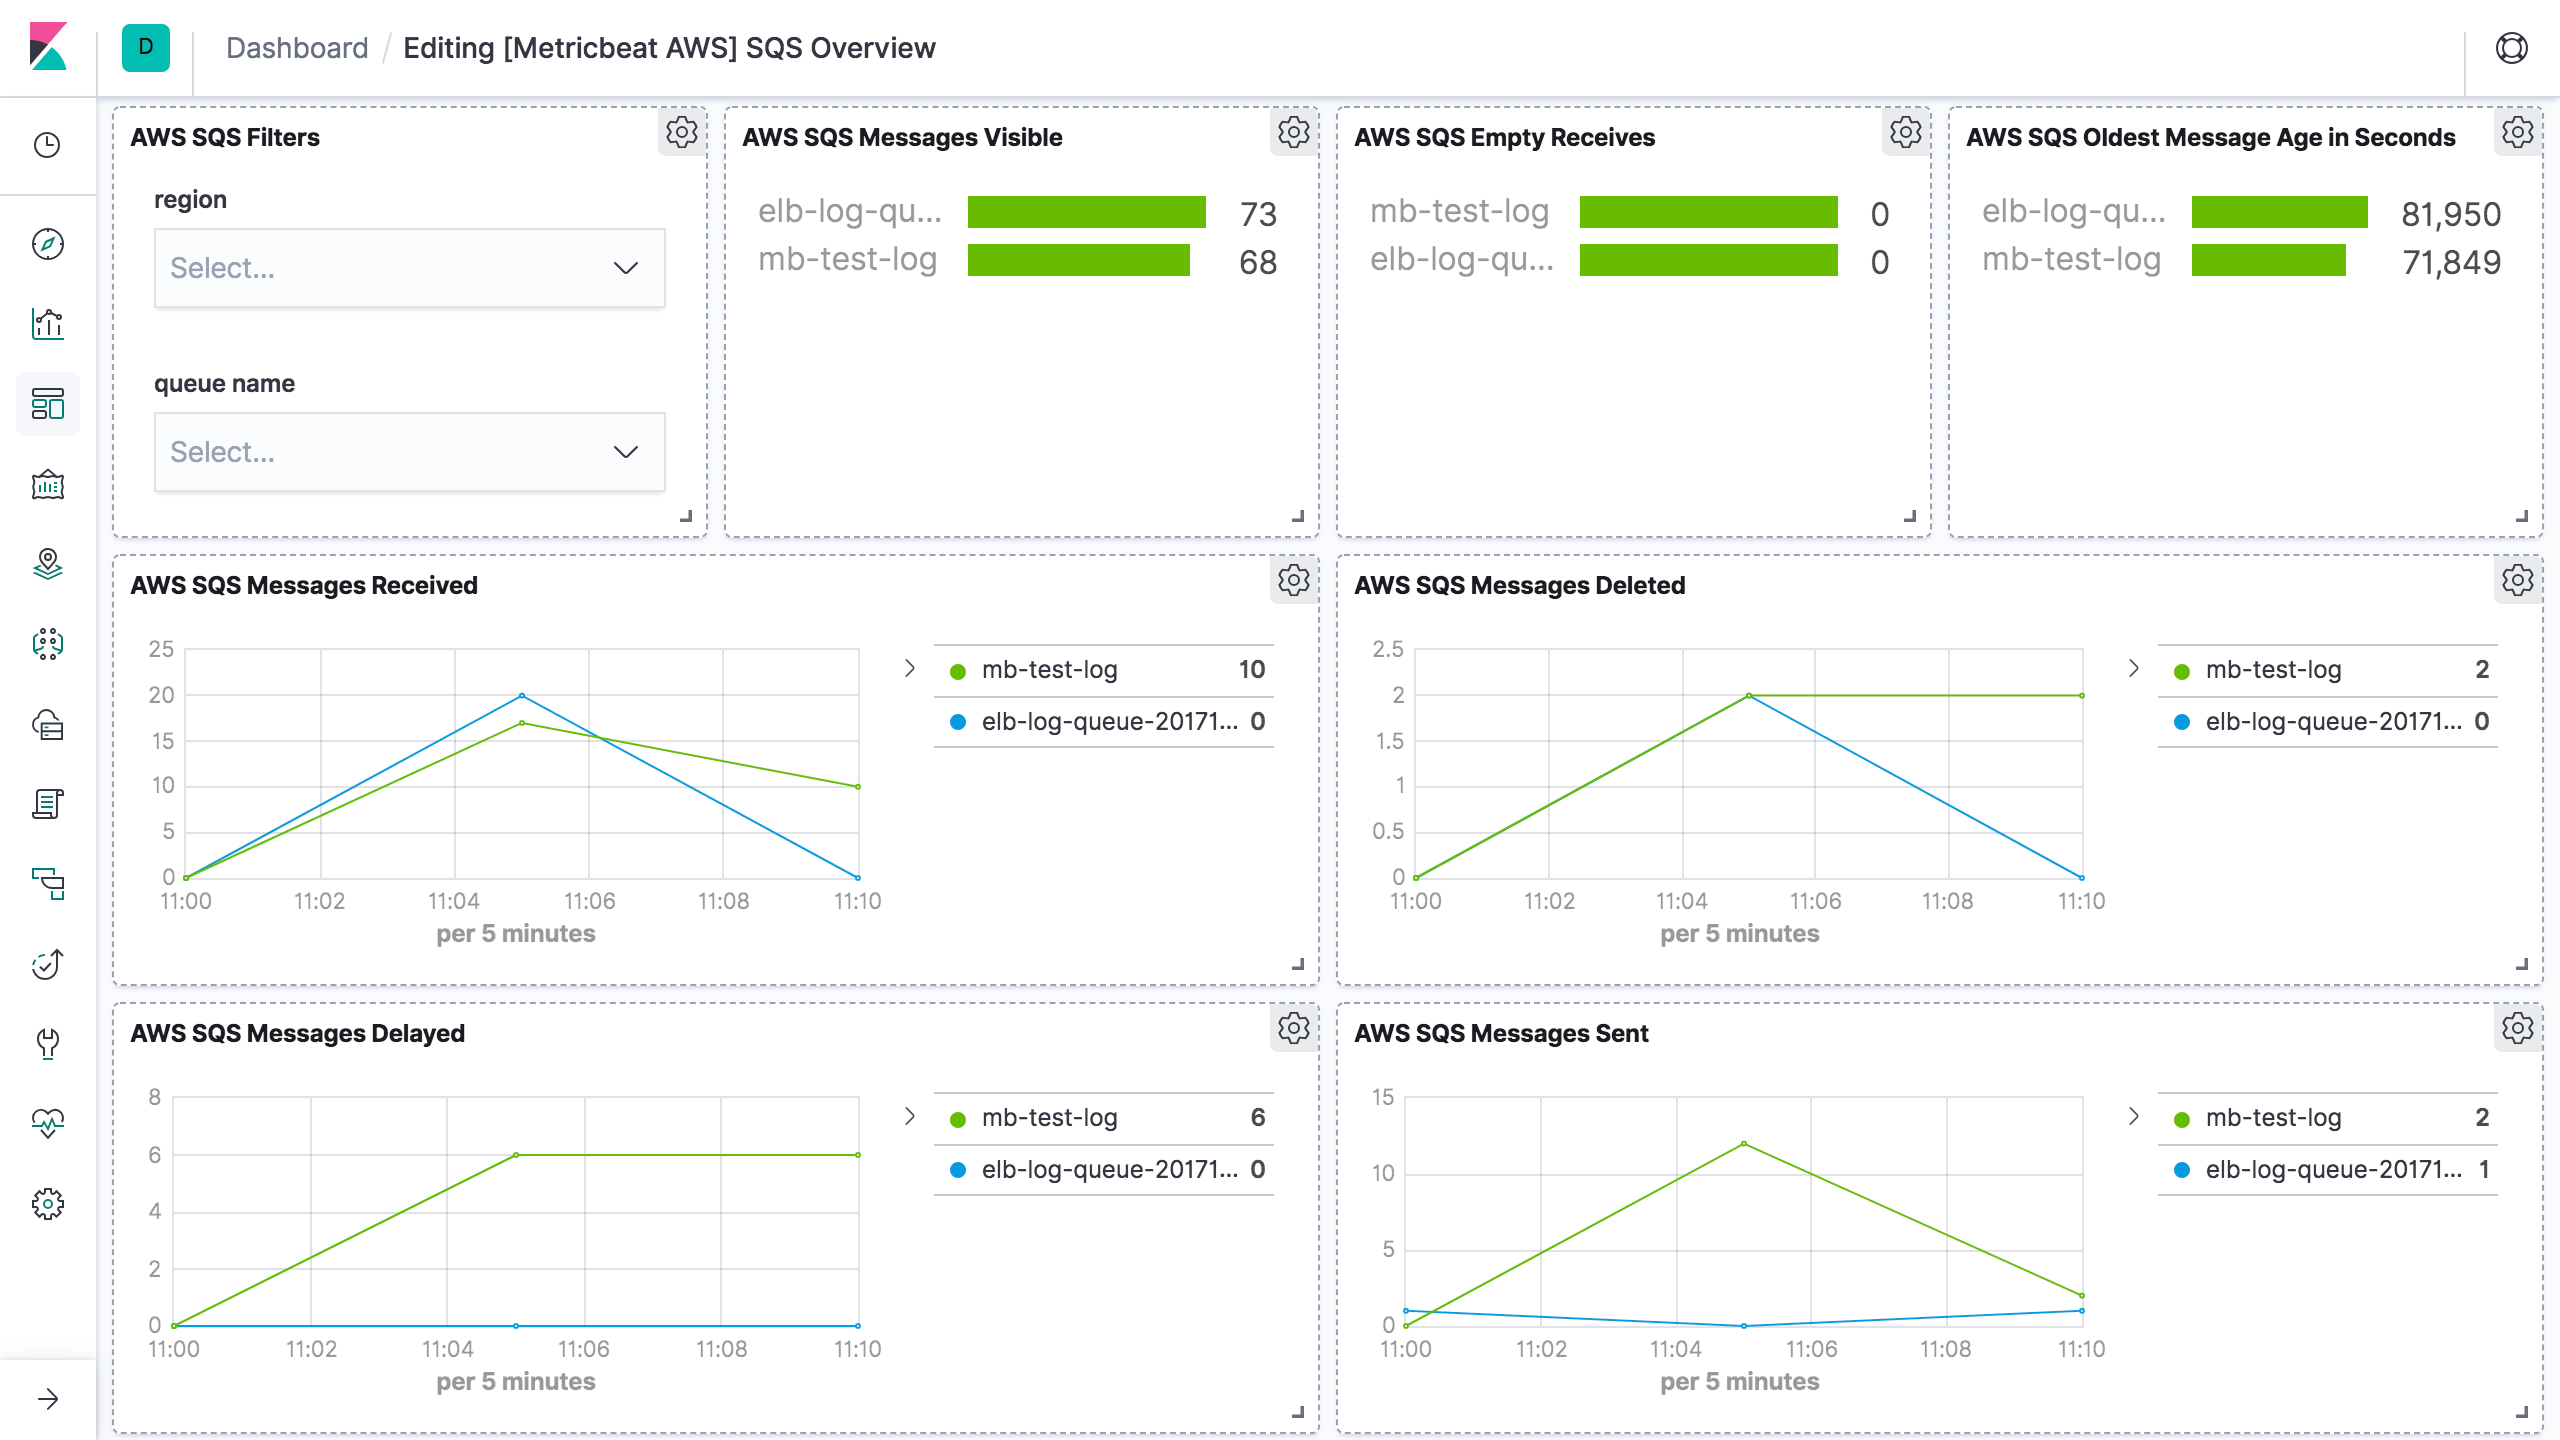
sqs
editCloudWatch metrics for Amazon SQS queues are automatically collected and pushed to CloudWatch every 5 minutes,
the period for sqs metricset is recommended to be 300s or multiples of 300s.
The sqs metricset comes with a predefined dashboard:
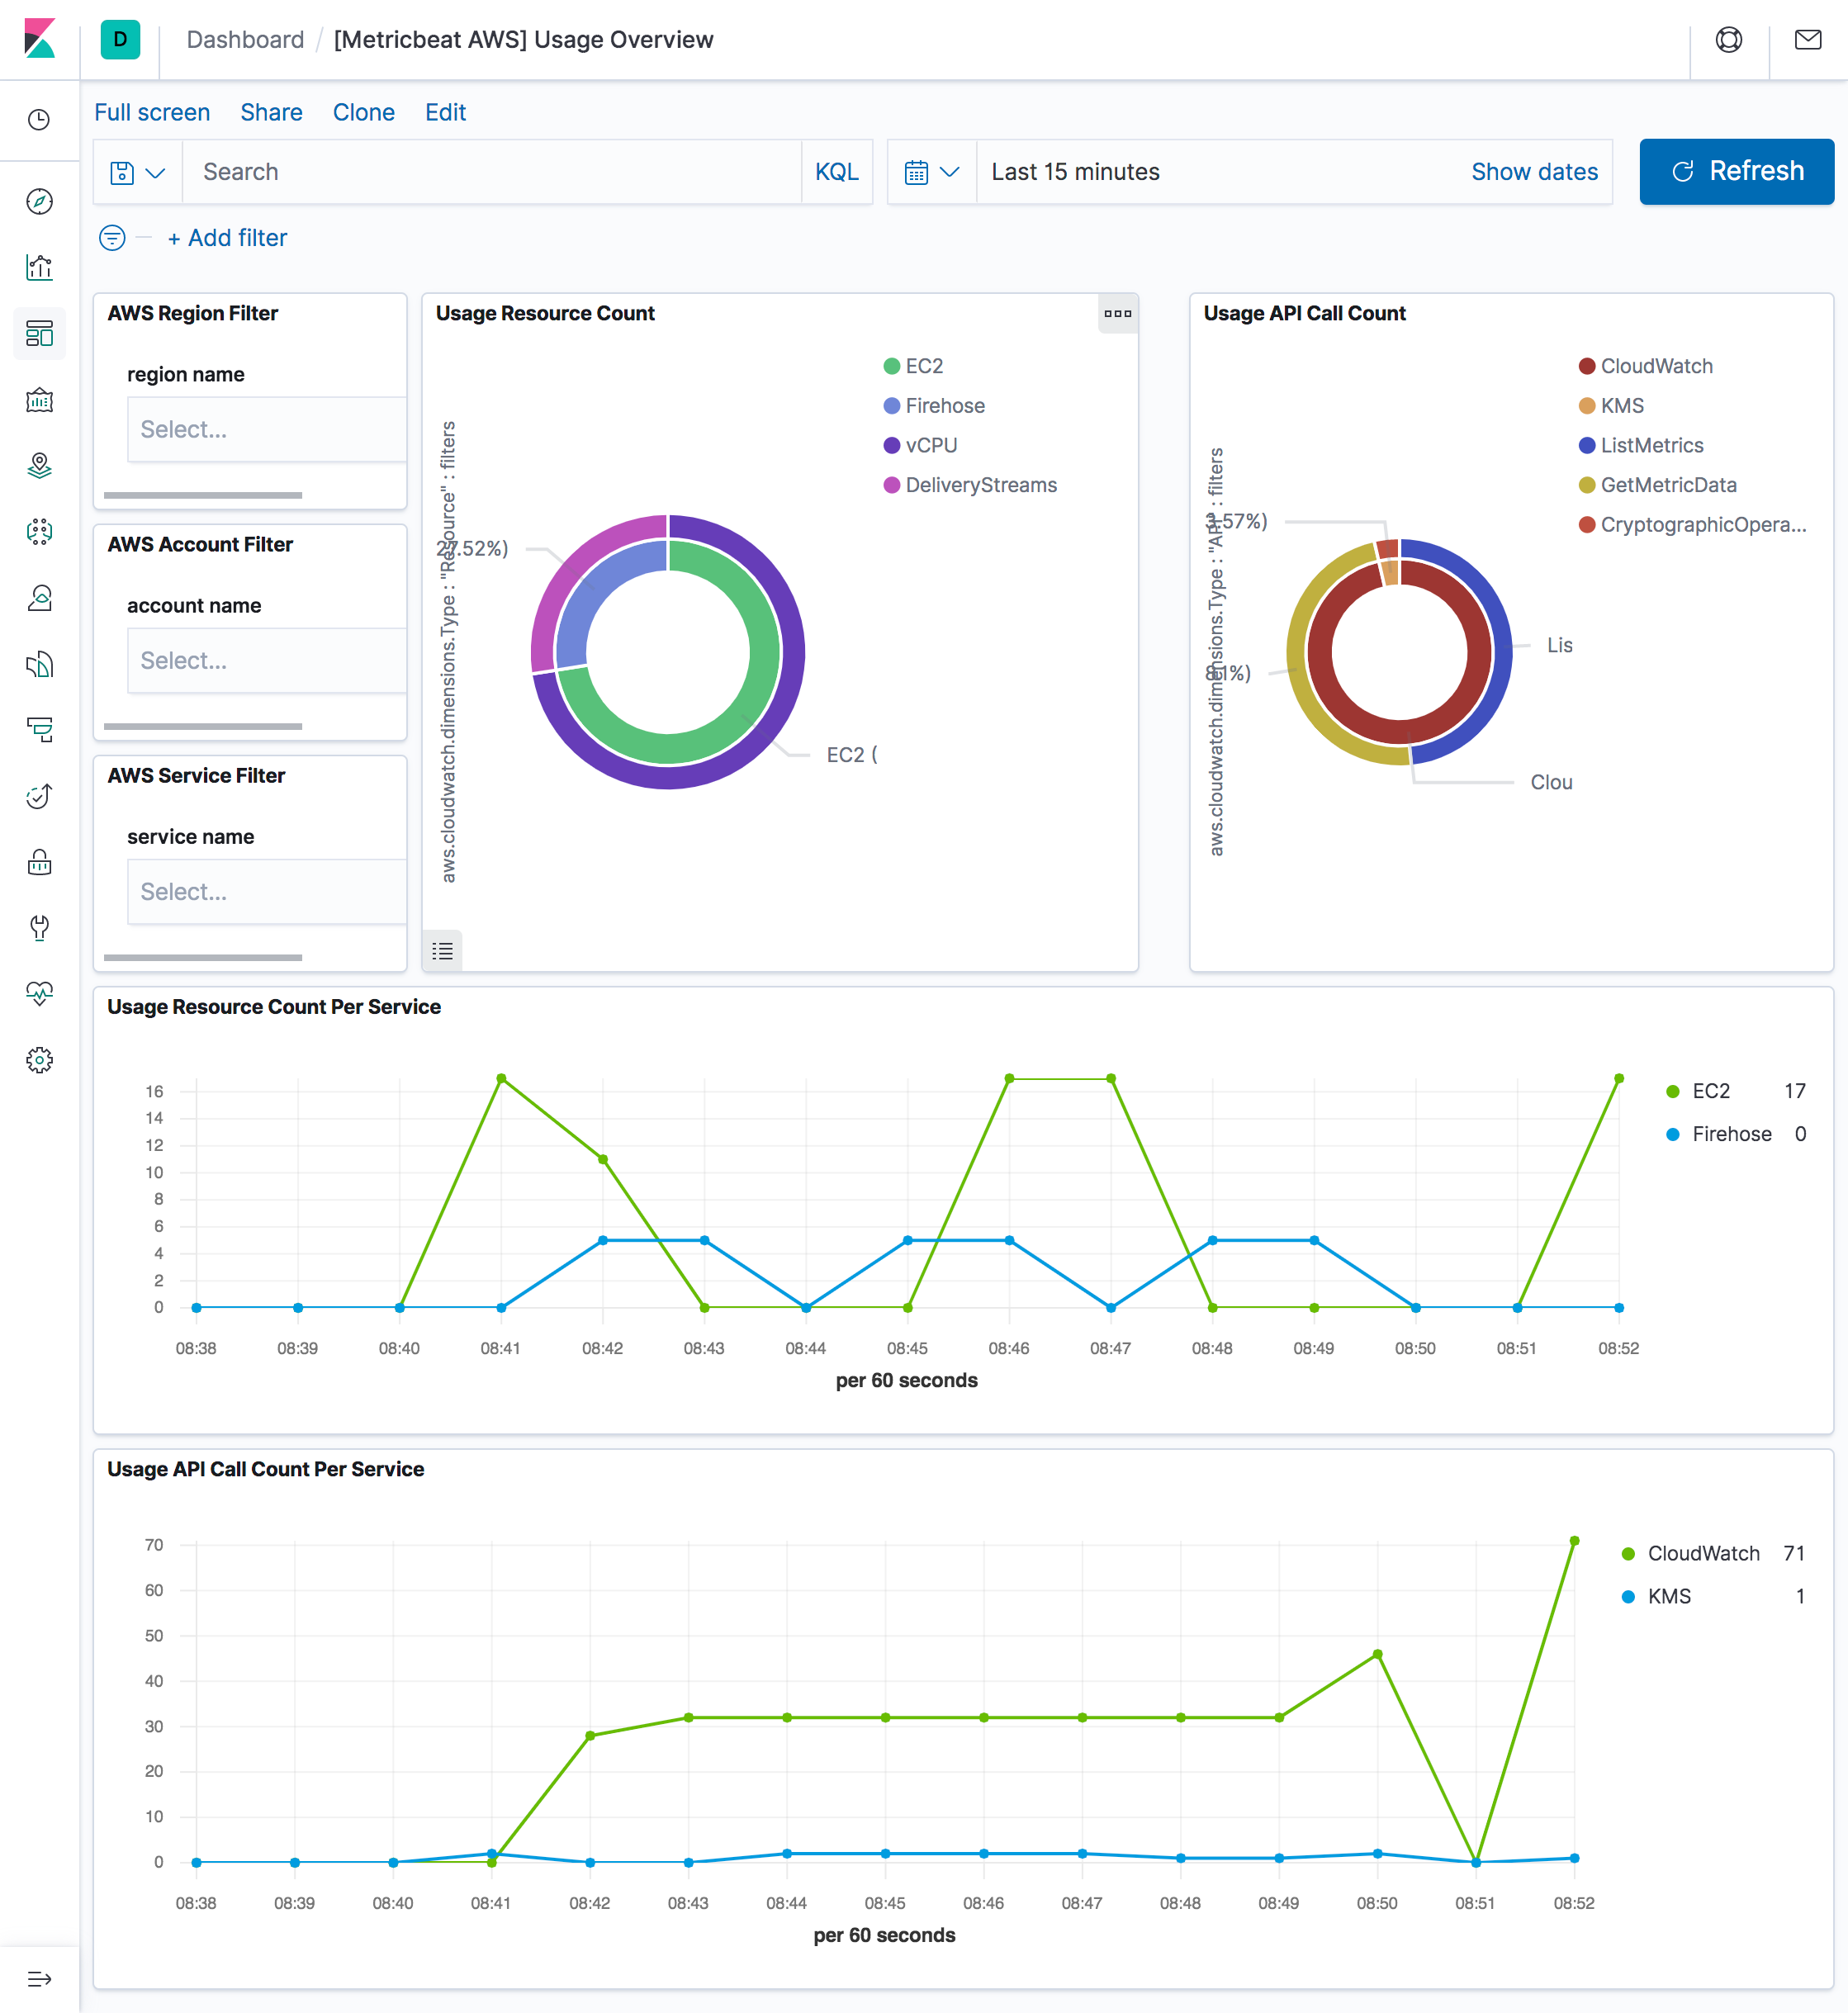
usage
editCloudWatch collects metrics that track the usage of some AWS resources. These
metrics correspond to AWS service quotas. Tracking these metrics can help
proactively manage quotas. Service quota usage metrics are in the AWS/Usage
namespace and are collected every minute. Therefore, period in aws module
configuration for usage metricset is set to 1m.
The usage metricset comes with a predefined dashboard:
AWS API requests count per metricset
editThis session is to document what are the AWS API called made by each metricset
in aws module. This will be useful for users to estimate costs for using aws
module.
Note: some AWS APIs need pagination like ListMetrics and GetMetricData. Count value is depends on the number of results.
ListMetrics max page size: 500, based on AWS API ListMetrics
GetMetricData max page size: 100, based on AWS API GetMetricData
cloudwatch
editAWS API Name |
AWS API Count |
Frequency |
IAM ListAccountAliases |
1 |
Once on startup |
STS GetCallerIdentity |
1 |
Once on startup |
EC2 DescribeRegions |
1 |
Once on startup |
CloudWatch ListMetrics |
Total number of results / ListMetrics max page size |
Per region per namespace per collection period |
CloudWatch GetMetricData |
Total number of results / GetMetricData max page size |
Per region per namespace per collection period |
billing, ebs, elb, sns and usage are the same as cloudwatch metricset.
ec2
editAWS API Name |
AWS API Count |
Frequency |
IAM ListAccountAliases |
1 |
Once on startup |
STS GetCallerIdentity |
1 |
Once on startup |
EC2 DescribeRegions |
1 |
Once on startup |
EC2 DescribeInstances |
1 |
Per region per collection period |
CloudWatch ListMetrics |
Total number of results / ListMetrics max page size |
Per region per collection period |
CloudWatch GetMetricData |
Total number of results / GetMetricData max page size |
Per region per collection period |
rds
editAWS API Name |
AWS API Count |
Frequency |
IAM ListAccountAliases |
1 |
Once on startup |
STS GetCallerIdentity |
1 |
Once on startup |
EC2 DescribeRegions |
1 |
Once on startup |
RDS DescribeDBInstances |
1 |
Per region per collection period |
CloudWatch ListMetrics |
Total number of results / ListMetrics max page size |
Per region per collection period |
CloudWatch GetMetricData |
Total number of results / GetMetricData max page size |
Per region per collection period |
sqs
editAWS API Name |
AWS API Count |
Frequency |
IAM ListAccountAliases |
1 |
Once on startup |
STS GetCallerIdentity |
1 |
Once on startup |
EC2 DescribeRegions |
1 |
Once on startup |
CloudWatch ListMetrics |
Total number of results / ListMetrics max page size |
Per region per collection period |
CloudWatch GetMetricData |
Total number of results / GetMetricData max page size |
Per region per collection period |
s3_daily_storage and s3_request
editAWS API Name |
AWS API Count |
Frequency |
IAM ListAccountAliases |
1 |
Once on startup |
STS GetCallerIdentity |
1 |
Once on startup |
EC2 DescribeRegions |
1 |
Once on startup |
CloudWatch ListMetrics |
Total number of results / ListMetrics max page size |
Per region per collection period |
CloudWatch GetMetricData |
Total number of results / GetMetricData max page size |
Per region per collection period |
AWS Credentials Configuration
editTo configure AWS credentials, either put the credentials into the Metricbeat configuration, or use a shared credentials file, as shown in the following examples.
Supported Formats
edit-
Use
AWS_ACCESS_KEY_ID,AWS_SECRET_ACCESS_KEYand/orAWS_SESSION_TOKEN
Users can either put the credentials into metricbeat module configuration or use
environment variable AWS_ACCESS_KEY_ID, AWS_SECRET_ACCESS_KEY and/or
AWS_SESSION_TOKEN instead.
-
Use AWS credentials in Metricbeat configuration
metricbeat.modules:
- module: aws
  period: 300s
  metricsets:
    - ec2
  access_key_id: '<access_key_id>'
  secret_access_key: '<secret_access_key>'
  session_token: '<session_token>'
or
metricbeat.modules:
- module: aws
  period: 300s
  metricsets:
    - ec2
  access_key_id: '${AWS_ACCESS_KEY_ID:""}'
  secret_access_key: '${AWS_SECRET_ACCESS_KEY:""}'
  session_token: '${AWS_SESSION_TOKEN:""}'
-
Use shared AWS credentials file
metricbeat.modules:
- module: aws
  period: 300s
  metricsets:
    - ec2
  credential_profile_name: test-mb
credential_profile_name is optional. If you use different credentials for
different tools or applications, you can use profiles to configure multiple
access keys in the same configuration file. If there is no credential_profile_name
given, the default profile will be used.
shared_credential_file is optional to specify the directory of your shared
credentials file. If it’s empty, the default directory will be used.
In Windows, shared credentials file is at C:\Users\<yourUserName>\.aws\credentials.
For Linux, macOS or Unix, the file is located at ~/.aws/credentials. Please see
Create Shared Credentials File
for more details.
AWS Credentials Types
editThere are two different types of AWS credentials can be used: access keys and temporary security credentials.
- Access keys
AWS_ACCESS_KEY_ID and AWS_SECRET_ACCESS_KEY are the two parts of access keys.
They are long-term credentials for an IAM user or the AWS account root user.
Please see
AWS Access Keys
and Secret Access Keys
for more details.
- Temporary security credentials
temporary security credentials has a limited lifetime and consists of an
access key ID, a secret access key, and a security token which typically returned
from GetSessionToken. MFA-enabled IAM users would need to submit an MFA code
while calling GetSessionToken. default_region identifies the AWS Region
whose servers you want to send your first API request to by default. This is
typically the Region closest to you, but it can be any Region. Please see
Temporary Security Credentials
for more details.
sts get-session-token AWS CLI can be used to generate temporary credentials. For example. with MFA-enabled:
aws> sts get-session-token --serial-number arn:aws:iam::1234:mfa/your-email@example.com --token-code 456789 --duration-seconds 129600
Because temporary security credentials are short term, after they expire, the user needs to generate new ones and modify the aws.yml config file with the new credentials. Unless live reloading feature is enabled for Metricbeat, the user needs to manually restart Metricbeat after updating the config file in order to continue collecting Cloudwatch metrics. This will cause data loss if the config file is not updated with new credentials before the old ones expire. For Metricbeat, we recommend users to use access keys in config file to enable aws module making AWS api calls without have to generate new temporary credentials and update the config frequently.
IAM policy is an entity that defines permissions to an object within your AWS environment. Specific permissions needs to be added into the IAM user’s policy to authorize Metricbeat to collect AWS monitoring metrics. Please see documentation under each metricset for required permissions.
Example configuration
editThe aws module supports the standard configuration options that are described in Modules. Here is an example configuration:
metricbeat.modules:
- module: aws
  period: 300s
  credential_profile_name: test-mb
  metricsets:
    - ec2
- module: aws
  period: 300s
  credential_profile_name: test-mb
  metricsets:
    - sqs
  regions:
    - us-west-1
- module: aws
  period: 86400s
  metricsets:
    - s3_request
    - s3_daily_storage
  access_key_id: '${AWS_ACCESS_KEY_ID:""}'
  secret_access_key: '${AWS_SECRET_ACCESS_KEY:""}'
  session_token: '${AWS_SESSION_TOKEN:""}'
- module: aws
  period: 300s
  credential_profile_name: test-mb
  metricsets:
    - cloudwatch
  metrics:
    - namespace: AWS/EC2
      name: ["CPUUtilization"]
      dimensions:
        - name: InstanceId
          value: i-0686946e22cf9494a
    - namespace: AWS/EBS
    - namespace: AWS/ELB
      tags.resource_type_filter: elasticloadbalancing
- module: aws
  period: 60s
  credential_profile_name: test-mb
  metricsets:
    - rds
Metricsets
editThe following metricsets are available:
On this page