- Packetbeat Reference: other versions:
- Overview
- Getting started with Packetbeat
- Setting up and running Packetbeat
- Upgrading Packetbeat
- Configuring Packetbeat
- Set traffic capturing options
- Set up flows to monitor network traffic
- Specify which transaction protocols to monitor
- Specify which processes to monitor
- Specify general settings
- Configure the internal queue
- Configure the output
- Configure index lifecycle management
- Specify SSL settings
- Filter and enhance the exported data
- Define processors
- Add cloud metadata
- Add fields
- Add labels
- Add the local time zone
- Add tags
- Decode JSON fields
- Drop events
- Drop fields from events
- Keep fields from events
- Rename fields from events
- Add Kubernetes metadata
- Add Docker metadata
- Add Host metadata
- Dissect strings
- DNS Reverse Lookup
- Add process metadata
- Parse data by using ingest node
- Enrich events with geoIP information
- Configure project paths
- Configure the Kibana endpoint
- Load the Kibana dashboards
- Load the Elasticsearch index template
- Configure logging
- Use environment variables in the configuration
- YAML tips and gotchas
- HTTP Endpoint
- packetbeat.reference.yml
- Exported fields
- AMQP fields
- Beat fields
- Cassandra fields
- Cloud provider metadata fields
- Common fields
- DHCPv4 fields
- DNS fields
- Docker fields
- ECS fields
- Flow Event fields
- Host fields
- HTTP fields
- ICMP fields
- Kubernetes fields
- Memcache fields
- MongoDb fields
- MySQL fields
- NFS fields
- PostgreSQL fields
- Process fields
- Raw fields
- Redis fields
- Thrift-RPC fields
- TLS fields
- Transaction Event fields
- Measurements (Transactions) fields
- Monitoring Packetbeat
- Securing Packetbeat
- Visualizing Packetbeat data in Kibana
- Troubleshooting
- Contributing to Beats
Step 6: View the sample Kibana dashboards
editStep 6: View the sample Kibana dashboards
editTo make it easier for you to get application performance insights
from packet data, we have created example Packetbeat dashboards. You loaded
the dashboards earlier when you ran the setup command.
To open the dashboards, launch the Kibana web interface by pointing your browser
to port 5601. For example, http://localhost:5601.
Replace localhost with the name of the Kibana host. If you’re using an
Elastic Cloud instance, log in to your cloud account,
then navigate to the Kibana endpoint in your deployment.
On the Discover page, make sure that the predefined packetbeat-* index
pattern is selected to see Packetbeat data.
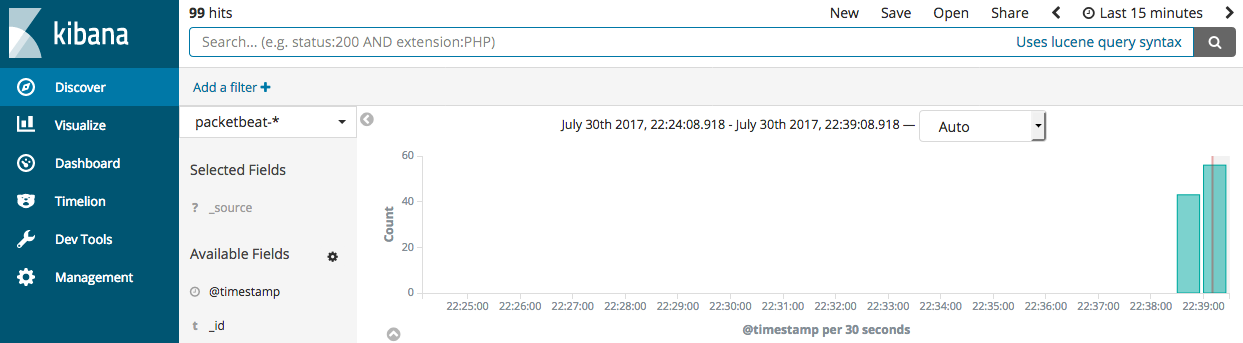
If you don’t see data in Kibana, try changing the date range to a larger range. By default, Kibana shows the last 15 minutes.
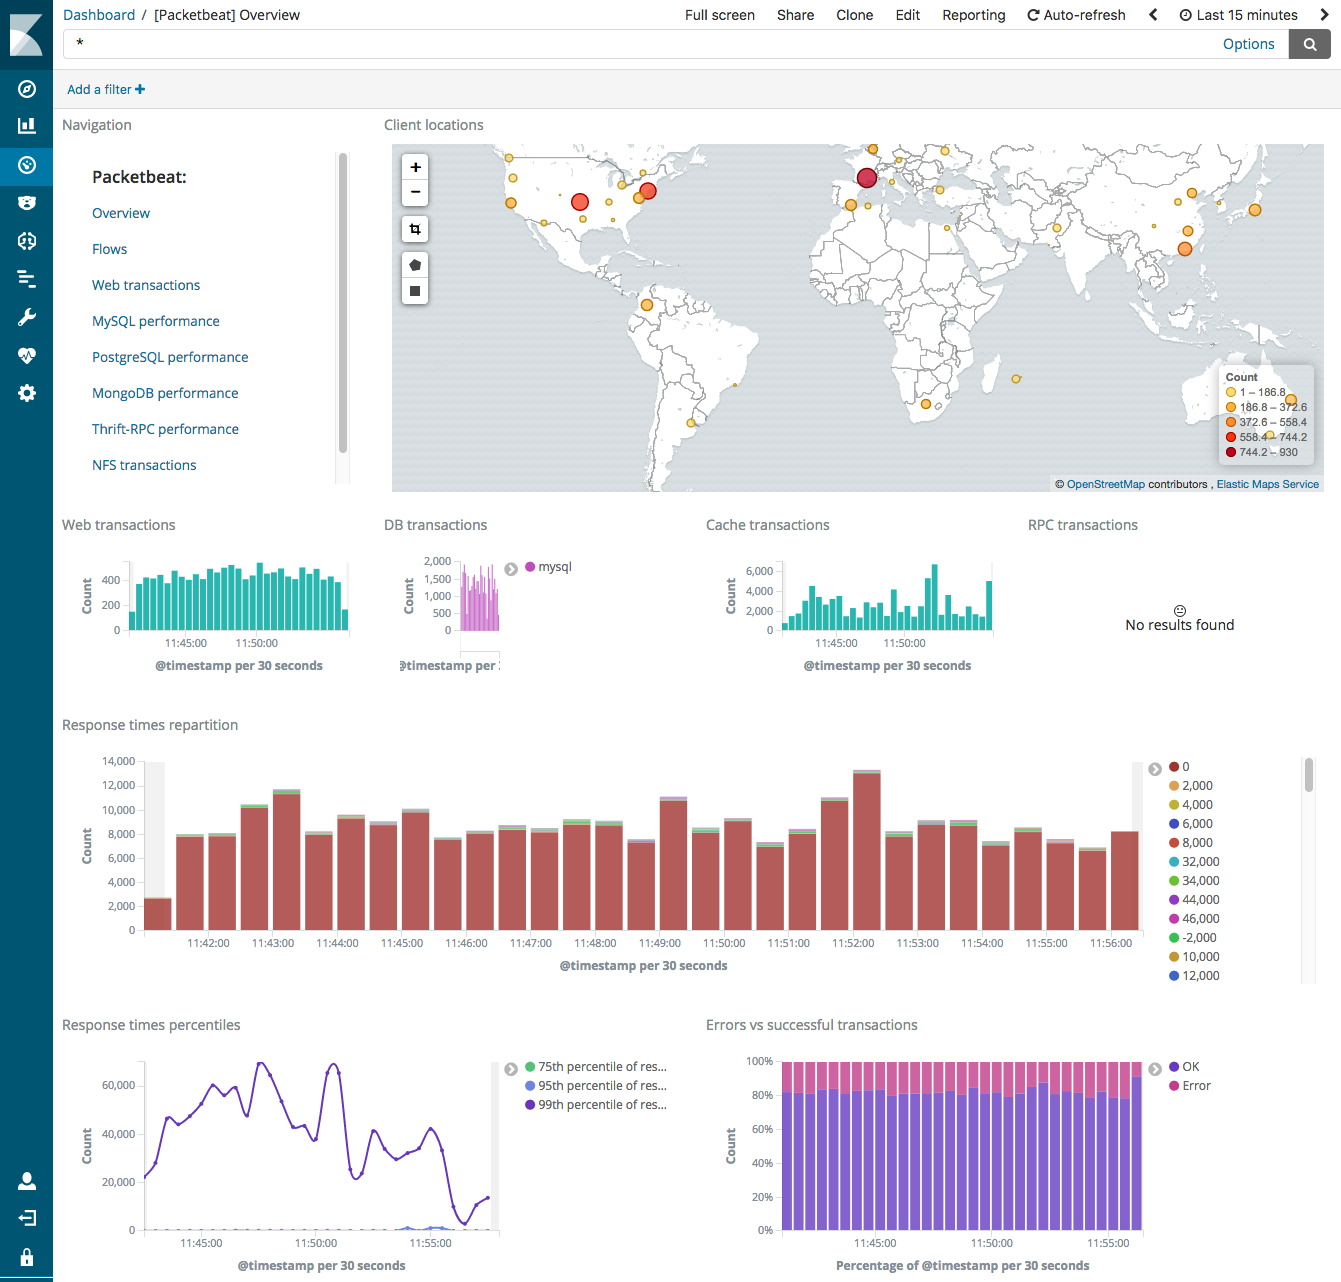
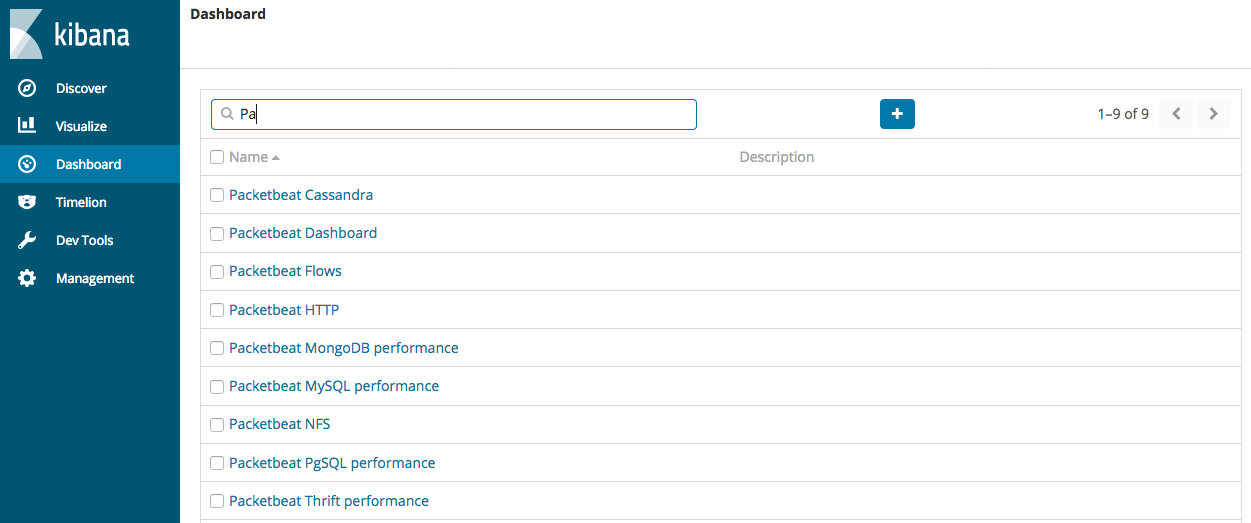
Go to the Dashboard page and select the dashboard that you want to open.
The dashboards are provided as examples. We recommend that you customize them to meet your needs.
To populate the client locations map in the overview dashboard, follow the steps described in Enrich events with geoIP information.