- Packetbeat Reference: other versions:
- Overview
- Get started
- Set up and run
- Upgrade Packetbeat
- Configure
- Traffic sniffing
- Network flows
- Protocols
- Processes
- General settings
- Project paths
- Output
- SSL
- Index lifecycle management (ILM)
- Elasticsearch index template
- Kibana endpoint
- Kibana dashboards
- Processors
- Define processors
- add_cloud_metadata
- add_docker_metadata
- add_fields
- add_host_metadata
- add_id
- add_kubernetes_metadata
- add_labels
- add_locale
- add_observer_metadata
- add_process_metadata
- add_tags
- community_id
- convert
- copy_fields
- decode_base64_field
- decode_json_fields
- decompress_gzip_field
- dissect
- dns
- drop_event
- drop_fields
- extract_array
- fingerprint
- include_fields
- registered_domain
- rename
- truncate_fields
- Internal queue
- Logging
- HTTP endpoint
- packetbeat.reference.yml
- How to guides
- Exported fields
- AMQP fields
- Beat fields
- Cassandra fields
- Cloud provider metadata fields
- Common fields
- DHCPv4 fields
- DNS fields
- Docker fields
- ECS fields
- Flow Event fields
- Host fields
- HTTP fields
- ICMP fields
- Jolokia Discovery autodiscover provider fields
- Kubernetes fields
- Memcache fields
- MongoDb fields
- MySQL fields
- NFS fields
- PostgreSQL fields
- Process fields
- Raw fields
- Redis fields
- Thrift-RPC fields
- Detailed TLS fields
- Transaction Event fields
- Measurements (Transactions) fields
- Monitor
- Secure
- Visualize Packetbeat data in Kibana
- Troubleshoot
- Get help
- Debug
- Record a trace
- Common problems
- Dashboard in Kibana is breaking up data fields incorrectly
- Packetbeat doesn’t see any packets when using mirror ports
- Packetbeat can’t capture traffic from Windows loopback interface
- Packetbeat is missing long running transactions
- Packetbeat isn’t capturing MySQL performance data
- Packetbeat uses too much bandwidth
- Error loading config file
- Found unexpected or unknown characters
- Logstash connection doesn’t work
- @metadata is missing in Logstash
- Not sure whether to use Logstash or Beats
- SSL client fails to connect to Logstash
- Monitoring UI shows fewer Beats than expected
- Fields show up as nested JSON in Kibana
- Contribute to Beats
Step 6: View the sample Kibana dashboards
editStep 6: View the sample Kibana dashboards
editTo make it easier for you to get application performance insights
from packet data, we have created example Packetbeat dashboards. You loaded
the dashboards earlier when you ran the setup command.
To open the dashboards, launch the Kibana web interface by pointing your browser
to port 5601. For example, http://localhost:5601.
Replace localhost with the name of the Kibana host. If you’re using an
Elastic Cloud instance, log in to your cloud account,
then navigate to the Kibana endpoint in your deployment.
On the Discover page, make sure that the predefined packetbeat-* index
pattern is selected to see Packetbeat data.
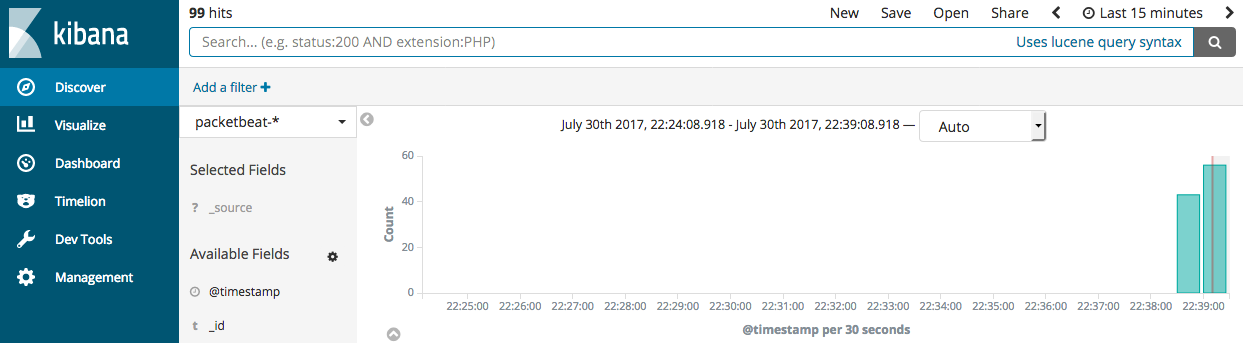
If you don’t see data in Kibana, try changing the date range to a larger range. By default, Kibana shows the last 15 minutes.
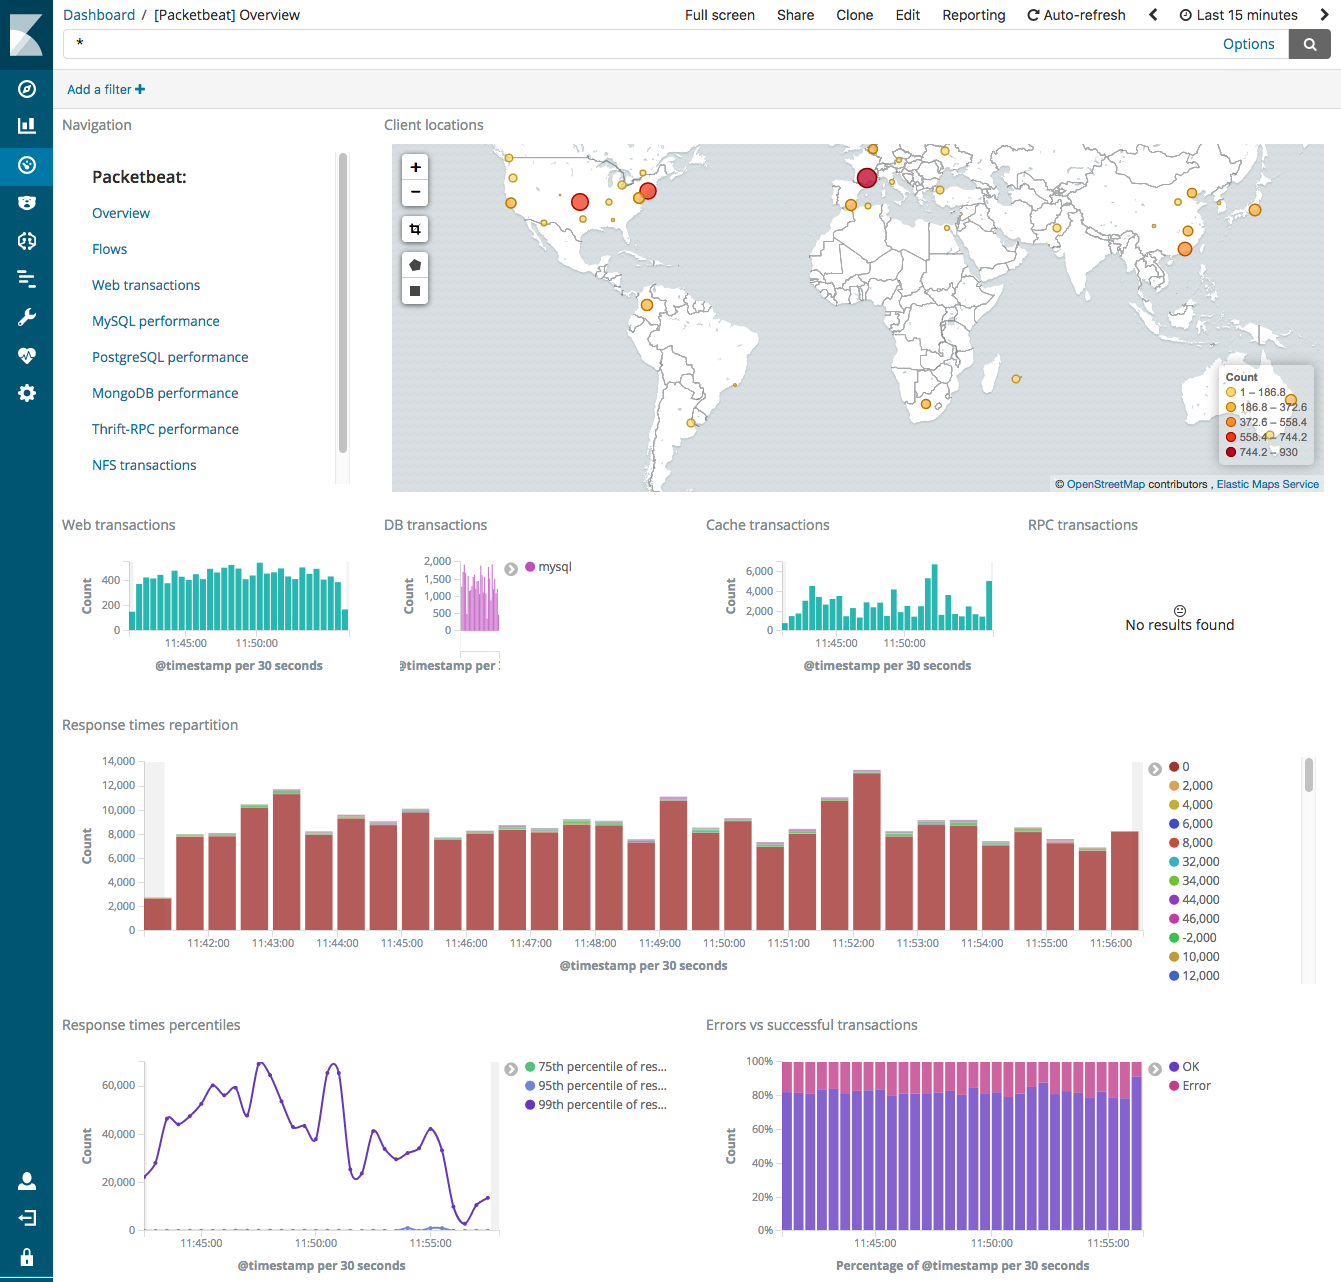
Go to the Dashboard page and select the dashboard that you want to open.
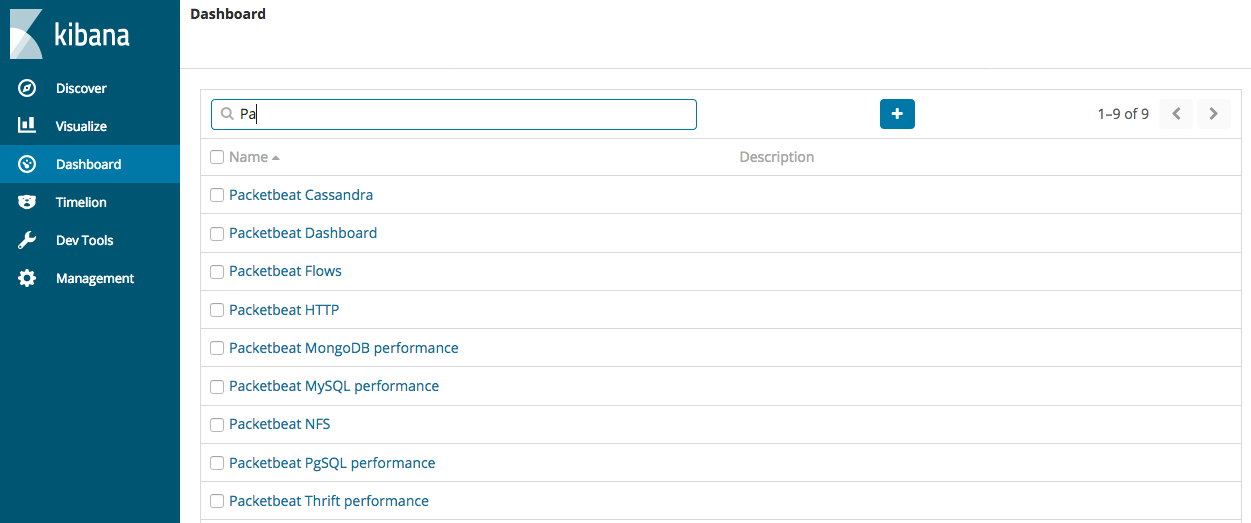
The dashboards are provided as examples. We recommend that you customize them to meet your needs.
To populate the client locations map in the overview dashboard, follow the steps described in Enrich events with geoIP information.