Kibana queries and filters
This topic provides a short introduction to some useful queries for searching Packetbeat data. For a full description of the query syntax, see Searching Your Data in the Kibana User Guide.
In Kibana, you can filter transactions either by entering a search query or by clicking on elements within a visualization.
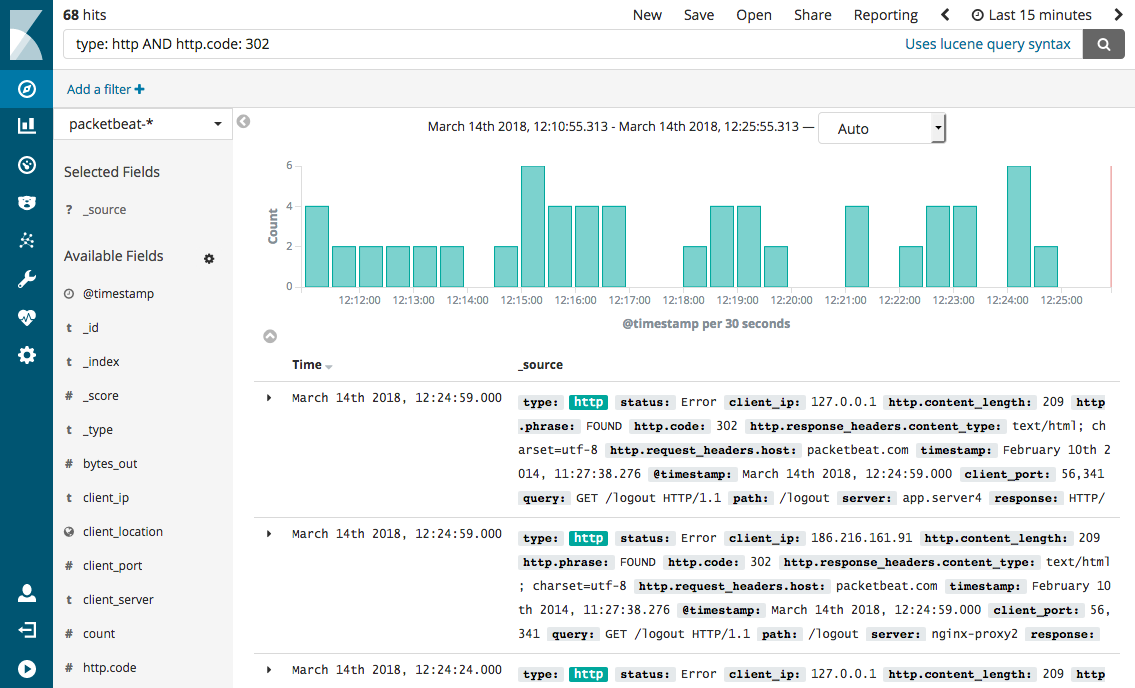
The search field on the Discover page provides a way to query a specific subset of transactions from the selected time frame. It allows boolean operators, wildcards, and field filtering. For example, if you want to find the HTTP redirects, you can search for http.response.status_code: 302.

A query may consist of one or more words or a phrase. A phrase is a group of words surrounded by double quotation marks, such as "test search".
To search for all HTTP requests initiated by Mozilla Web browser version 5.0:
"Mozilla/5.0"
To search for all the transactions that contain the following message:
"Cannot change the info of a user"
To search for an exact string, you need to wrap the string in double quotation marks. Without quotation marks, the search in the example would match any documents containing one of the following words: "Cannot" OR "change" OR "the" OR "info" OR "a" OR "user".
To search for all transactions with the "chunked" encoding:
"Transfer-Encoding: chunked"
Kibana allows you to search specific fields.
To view HTTP transactions only:
type: http
To view failed transactions only:
status: Error
To view INSERT queries only:
method: INSERT
Kibana supports regular expression for filters and expressions. For example, to search for all HTTP responses with JSON as the returned value type:
http.response_headers.content_type: *json
See Elasticsearch regexp query for more details about the syntax.
Range queries allow a field to have values between the lower and upper bounds. The interval can include or exclude the bounds depending on the type of brackets that you use.
To search for slow transactions with a response time greater than or equal to 10ms:
event.duration: [10000000 TO *]
To search for slow transactions with a response time greater than 10ms:
responsetime: {10000000 TO *}
Boolean operators (AND, OR, NOT) allow combining multiple sub-queries through logic operators.
Operators such as AND, OR, and NOT must be capitalized.
To search for all transactions except MySQL transactions:
NOT type: mysql
To search for all MySQL INSERT queries with errors:
type: mysql AND method: INSERT AND status: Error
Kibana Query Language (KQL) also supports parentheses to group sub-queries.
To search for either INSERT or UPDATE queries with a response time greater than or equal to 30ms:
(method: INSERT OR method: UPDATE) AND event.duration >= 30000000
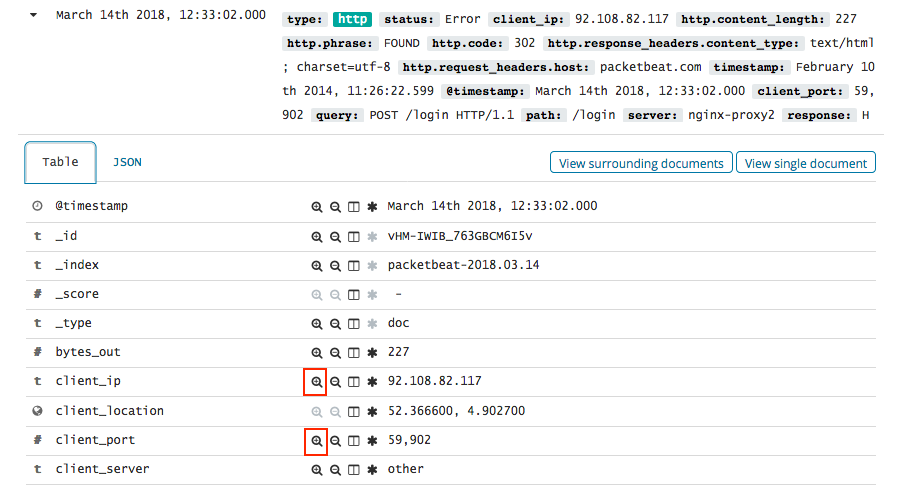
In Kibana, you can also filter transactions by clicking on elements within a visualization. For example, to filter for all the HTTP redirects that are coming from a specific IP and port, click the Filter for value ![]() icon next to the
icon next to the client.ip and client.port fields in the transaction detail table. To exclude the HTTP redirects coming from the IP and port, click the Filter out value ![]() icon instead.
icon instead.

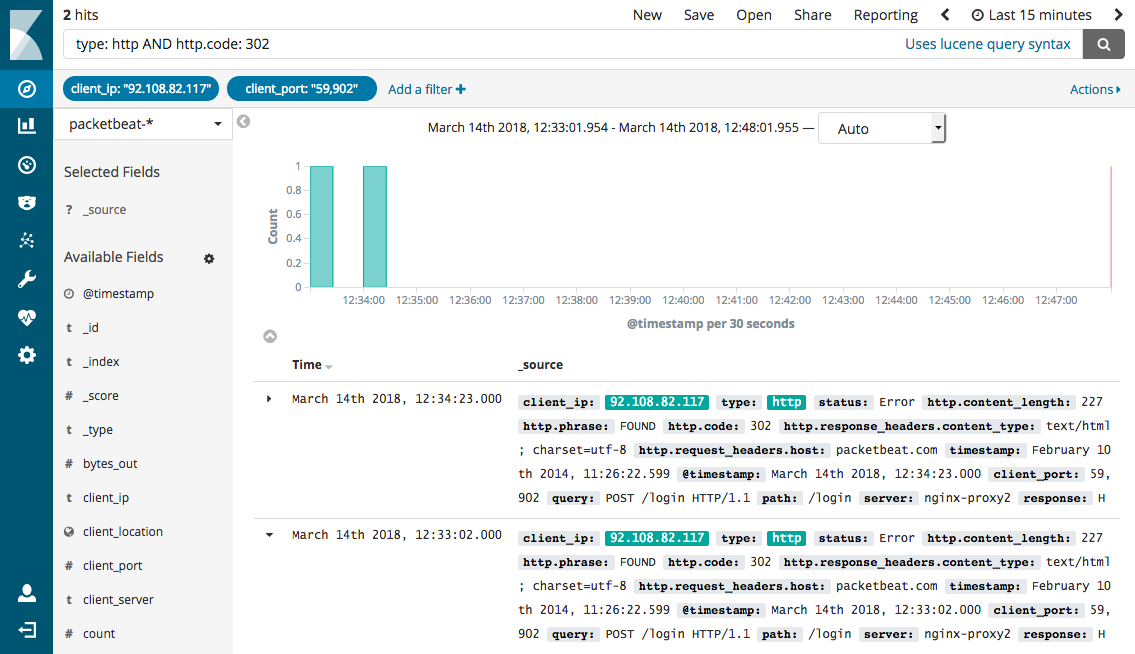
The selected filters appear under the search box.
