- Winlogbeat Reference: other versions:
- Winlogbeat Overview
- Quick start: installation and configuration
- Set up and run
- Upgrade
- Configure
- Winlogbeat
- General settings
- Project paths
- Output
- Kerberos
- SSL
- Index lifecycle management (ILM)
- Elasticsearch index template
- Kibana endpoint
- Kibana dashboards
- Processors
- Define processors
- add_cloud_metadata
- add_cloudfoundry_metadata
- add_docker_metadata
- add_fields
- add_host_metadata
- add_id
- add_kubernetes_metadata
- add_labels
- add_locale
- add_network_direction
- add_nomad_metadata
- add_observer_metadata
- add_process_metadata
- add_tags
- community_id
- convert
- copy_fields
- decode_base64_field
- decode_json_fields
- decode_xml
- decode_xml_wineventlog
- decompress_gzip_field
- detect_mime_type
- dissect
- dns
- drop_event
- drop_fields
- extract_array
- fingerprint
- include_fields
- rate_limit
- registered_domain
- rename
- script
- timestamp
- translate_sid
- truncate_fields
- urldecode
- Internal queue
- Logging
- HTTP endpoint
- Instrumentation
- winlogbeat.reference.yml
- How to guides
- Modules
- Exported fields
- Monitor
- Secure
- Troubleshoot
- Get Help
- Debug
- Common problems
- Dashboard in Kibana is breaking up data fields incorrectly
- Bogus computer_name fields are reported in some events
- Error loading config file
- Found unexpected or unknown characters
- Logstash connection doesn’t work
- Publishing to Logstash fails with "connection reset by peer" message
- @metadata is missing in Logstash
- Not sure whether to use Logstash or Beats
- SSL client fails to connect to Logstash
- Monitoring UI shows fewer Beats than expected
- Dashboard could not locate the index-pattern
- Not sure how to read from .evtx files
- Contribute to Beats
IMPORTANT: No additional bug fixes or documentation updates
will be released for this version. For the latest information, see the
current release documentation.
PowerShell Module
editPowerShell Module
editThe PowerShell module processes event log records from the Microsoft-Windows-PowerShell/Operational and Windows PowerShell logs.
The module has transformations for the following event IDs:
- 400 - Engine state is changed from None to Available.
- 403 - Engine state is changed from Available to Stopped.
- 600 - A Provider is Started.
- 800 - Pipeline executed.
- 4103 - Module logging.
- 4104 - Script block logging.
- 4105 - Command started.
- 4106 - Command completed.
Configuration
editBy default, module and script block logging (event ID’s 410x) are disabled, to enable them you can do so through "Windows Powershell" GPO settings and set "Turn on Module Logging" and "Turn on PowerShell Script Block Logging" to enabled.
Alternatively they can be enabled setting the following registry values:
HKCU/HKLM\SOFTWARE\Policies\Microsoft\Windows\PowerShell\ModuleLogging: EnableModuleLogging = 1
HKCU/HKLM\SOFTWARE\Policies\Microsoft\Windows\PowerShell\ModuleLogging \ModuleNames: * = *
HKCU/HKLM\SOFTWARE\Policies\Microsoft\Windows\PowerShell\ScriptBlockLogging: EnableScriptBlockLogging = 1
HKCU/HKLM\SOFTWARE\Policies\Microsoft\Windows\PowerShell\ScriptBlockLogging: EnableScriptBlockInvocationLogging = 1
winlogbeat.event_logs:
  - name: Windows PowerShell
    event_id: 400, 403, 600, 800
    processors:
      - script:
          lang: javascript
          id: powershell
          file: ${path.home}/module/powershell/config/winlogbeat-powershell.js

  - name: Microsoft-Windows-PowerShell/Operational
    event_id: 4103, 4104, 4105, 4106
    processors:
      - script:
          lang: javascript
          id: powershell-operational
          file: ${path.home}/module/powershell/config/winlogbeat-powershell.js
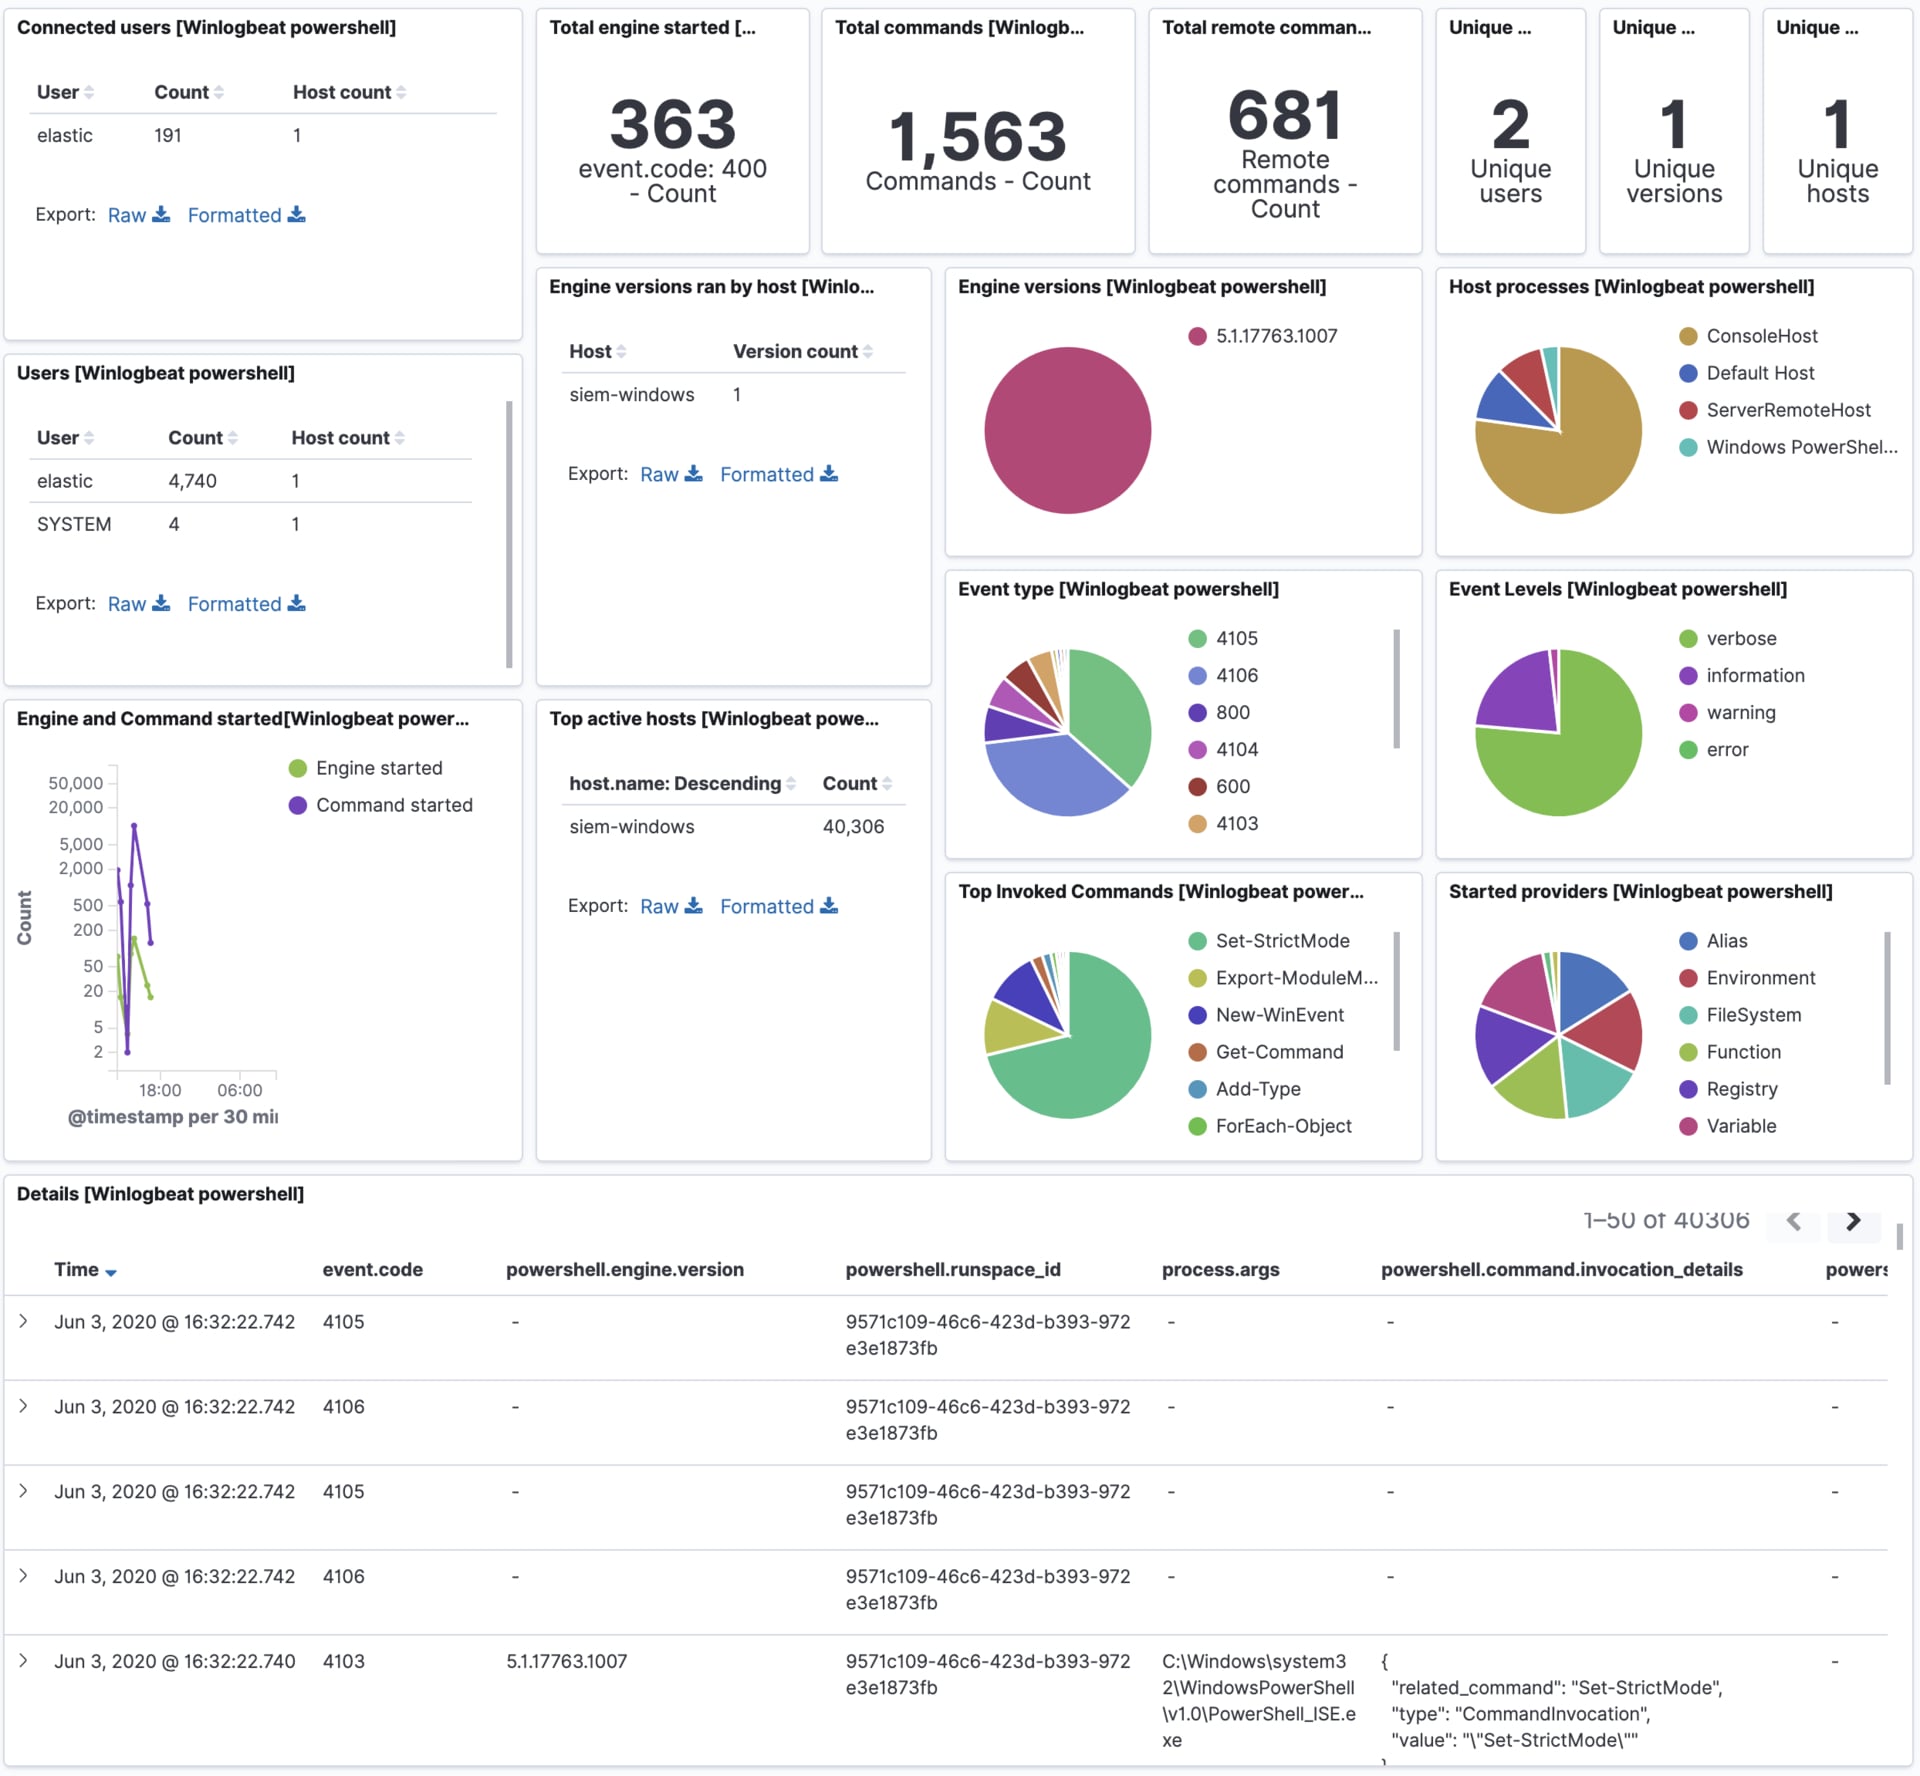
Example dashboard
editThis module comes with a sample dashboard.

On this page
ElasticON events are back!
Learn about the Elastic Search AI Platform from the experts at our live events.
Register nowWas this helpful?
Thank you for your feedback.