- Winlogbeat Reference: other versions:
- Overview
- Getting Started With Winlogbeat
- Setting up and running Winlogbeat
- Upgrading Winlogbeat
- Configuring Winlogbeat
- Set up Winlogbeat
- Specify general settings
- Configure the internal queue
- Configure the output
- Configure index lifecycle management
- Specify SSL settings
- Filter and Enhance the exported data
- Define processors
- Add cloud metadata
- Add fields
- Add labels
- Add the local time zone
- Add tags
- Decode JSON fields
- Decode Base64 fields
- Decompress gzip fields
- Community ID Network Flow Hash
- Convert
- Drop events
- Drop fields from events
- Extract array
- Keep fields from events
- Registered Domain
- Rename fields from events
- Add Kubernetes metadata
- Add Docker metadata
- Add Host metadata
- Add Observer metadata
- Dissect strings
- DNS Reverse Lookup
- Add process metadata
- Script Processor
- Timestamp
- Parse data by using ingest node
- Enrich events with geoIP information
- Configure project paths
- Configure the Kibana endpoint
- Load the Kibana dashboards
- Load the Elasticsearch index template
- Configure logging
- Use environment variables in the configuration
- YAML tips and gotchas
- HTTP Endpoint
- winlogbeat.reference.yml
- Modules
- Exported fields
- Monitoring Winlogbeat
- Securing Winlogbeat
- Troubleshooting
- Get Help
- Debug
- Common problems
- Dashboard in Kibana is breaking up data fields incorrectly
- Bogus computer_name fields are reported in some events
- Error loading config file
- Found unexpected or unknown characters
- Logstash connection doesn’t work
- @metadata is missing in Logstash
- Not sure whether to use Logstash or Beats
- SSL client fails to connect to Logstash
- Monitoring UI shows fewer Beats than expected
- Not sure how to read from .evtx files
- Contributing to Beats
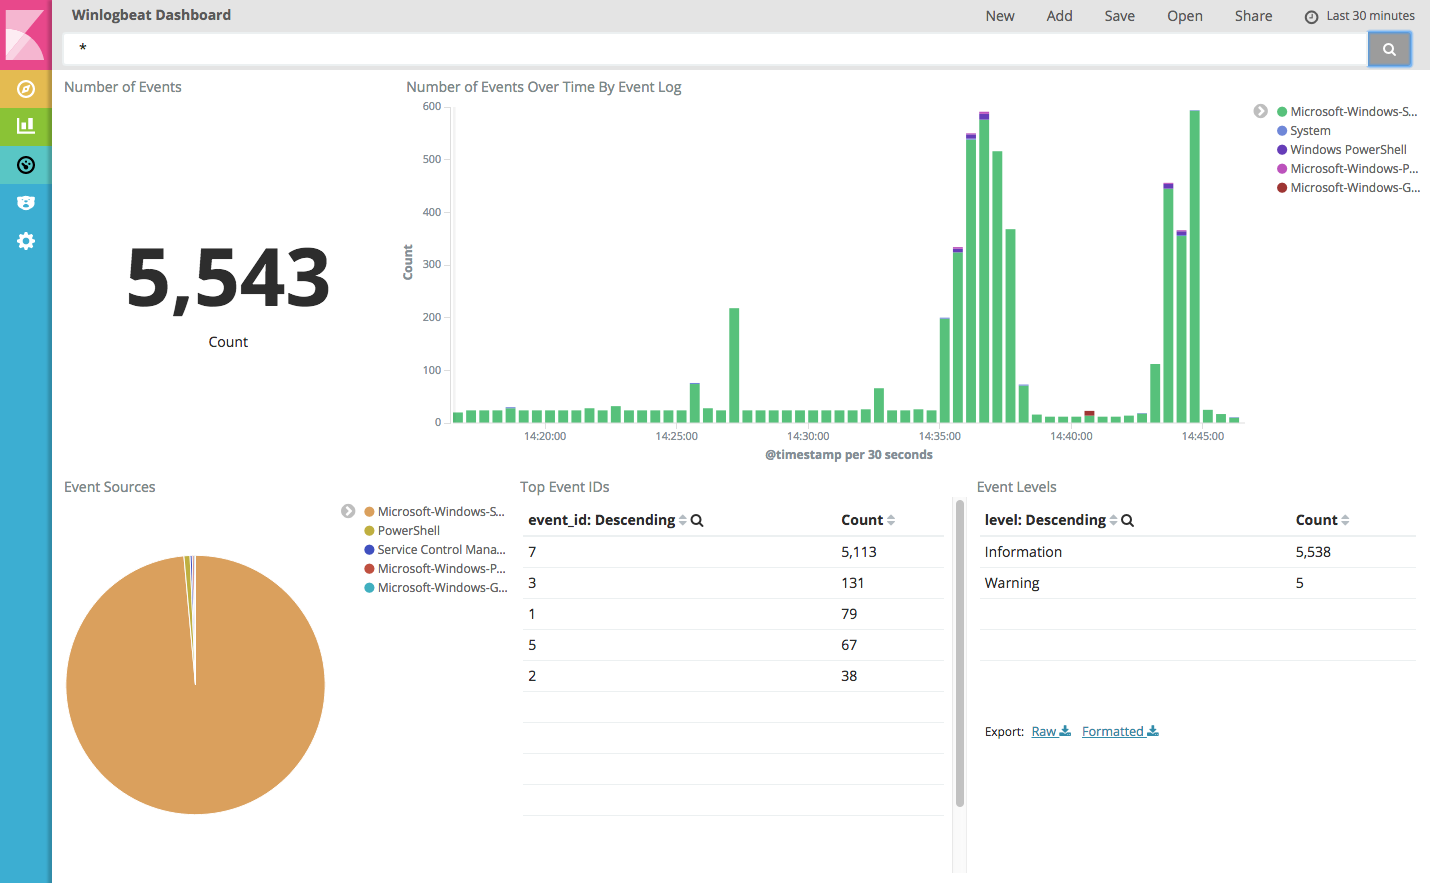
Step 7: View the sample Kibana dashboards
editStep 7: View the sample Kibana dashboards
editTo make it easier for you to start monitoring your servers in Kibana, we have
created example Winlogbeat dashboards. You loaded the dashboards earlier
when you ran the setup command.
To open the dashboards, launch the Kibana web interface by pointing your browser
to port 5601. For example, http://localhost:5601.
Replace localhost with the name of the Kibana host. If you’re using an
Elastic Cloud instance, log in to your cloud account,
then navigate to the Kibana endpoint in your deployment.
On the Discover page, make sure that the predefined winlogbeat-* index
pattern is selected to see Winlogbeat data.
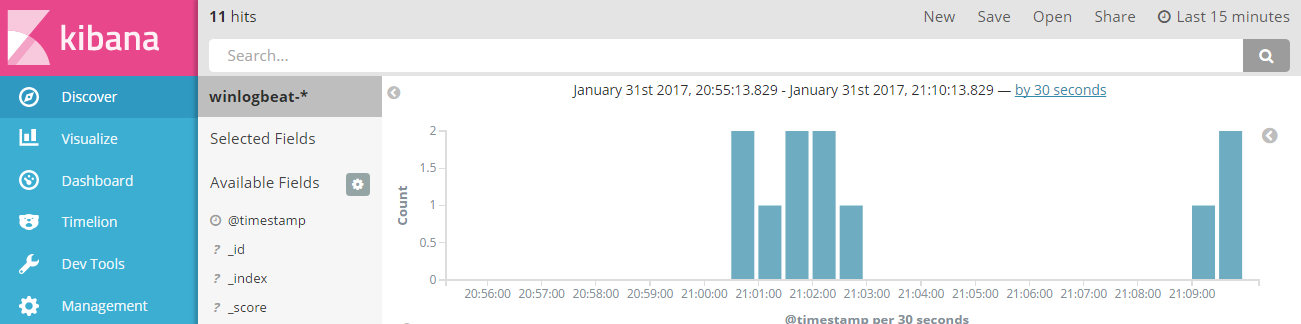
If you don’t see data in Kibana, try changing the date range to a larger range. By default, Kibana shows the last 15 minutes.
Go to the Dashboard page and select the dashboard that you want to open.
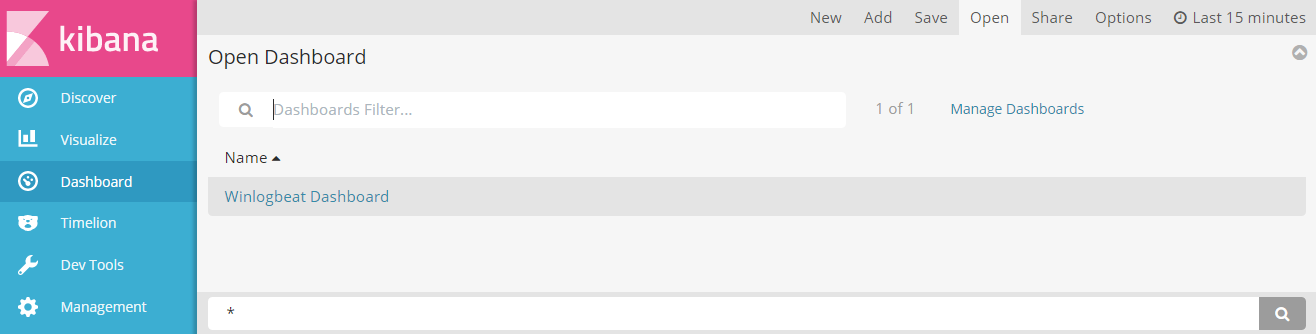
The dashboards are provided as examples. We recommend that you customize them to meet your needs.