Manage compute resources
editManage compute resources
editTo help the Kubernetes scheduler correctly place Pods in available Kubernetes nodes and ensure quality of service (QoS), it is recommended to specify the CPU and memory requirements for objects managed by the operator (Elasticsearch, Kibana, APM Server, Enterprise Search, Beats, Elastic Agent, Elastic Maps Server, and Logstash). In Kubernetes, requests defines the minimum amount of resources that must be available for a Pod to be scheduled; limits defines the maximum amount of resources that a Pod is allowed to consume. For more information about how Kubernetes uses these concepts, check Managing Compute Resources for Containers.
The operator applies default requests and limits for memory and CPU. They may be suitable for experimenting with the Elastic Stack, however it is recommended to reevaluate these values for production use cases.
Consider that Kubernetes throttles containers exceeding the CPU limit defined in the limits section. Do not set this value too low, or it would affect the performance of your workloads, even if you have enough resources available in the Kubernetes cluster.
Also, to minimize disruption caused by Pod evictions due to resource contention, you can run Pods at the "Guaranteed" QoS level by setting both requests and limits to the same value.
Set compute resources
editYou can set compute resource constraints in the podTemplate of objects managed by the operator.
Set compute resources for Elasticsearch
editapiVersion: elasticsearch.k8s.elastic.co/v1
kind: Elasticsearch
metadata:
name: quickstart
spec:
version: 8.19.11
nodeSets:
- name: default
count: 1
podTemplate:
spec:
containers:
- name: elasticsearch
resources:
requests:
memory: 4Gi
cpu: 8
limits:
memory: 4Gi
Memory limit and JVM Heap settings
editStarting with Elasticsearch 7.11, the heap size of the JVM is automatically calculated based on the node roles and the available memory. The available memory is defined by the value of resources.limits.memory set on the elasticsearch container in the Pod template, or the available memory on the Kubernetes node is no limit is set.
For Elasticsearch before 7.11, or if you want to override the default calculated heap size on newer versions, set the ES_JAVA_OPTS environment variable in the podTemplate to an appropriate value:
apiVersion: elasticsearch.k8s.elastic.co/v1
kind: Elasticsearch
metadata:
  name: quickstart
spec:
  version: 8.19.11
  nodeSets:
  - name: default
    count: 1
    podTemplate:
      spec:
        containers:
        - name: elasticsearch
          env:
          - name: ES_JAVA_OPTS
            value: -Xms2g -Xmx2g
          resources:
            requests:
              memory: 4Gi
              cpu: 8
            limits:
              memory: 4Gi
CPU resources
editThe value set for CPU limits or requests directly impacts the Elasticsearch node.processors setting. By default Elasticsearch automatically detects the number of processors and sets the thread pool settings based on it. The following table gives the default value for node.processors given the CPU limits and requests set on the elasticsearch container:
| No CPU limit | With CPU limit | |
|---|---|---|
No CPU request |
|
|
CPU request set to 1 |
|
|
Other CPU requests |
|
|
You can also set your own value for node.processors in the Elasticsearch config.
A known Kubernetes issue may lead to over-aggressive CPU limits throttling. If the host Linux Kernel does not include this CFS quota fix, you may want to:
- not set any CPU limit in the Elasticsearch resource (Burstable QoS)
- reduce the CFS quota period in kubelet configuration
- disable CFS quotas in kubelet configuration
Set compute resources for Kibana, Enterprise Search, Elastic Maps Server, APM Server and Logstash
editKibana.
apiVersion: kibana.k8s.elastic.co/v1
kind: Kibana
metadata:
  name: quickstart
spec:
  version: 8.19.11
  podTemplate:
    spec:
      containers:
      - name: kibana
        env:
          - name: NODE_OPTIONS
            value: "--max-old-space-size=2048"
        resources:
          requests:
            memory: 1Gi
            cpu: 0.5
          limits:
            memory: 2.5Gi
            cpu: 2
Elastic Maps Server.
apiVersion: maps.k8s.elastic.co/v1alpha1
kind: ElasticMapsServer
metadata:
  name: quickstart
spec:
  version: 8.19.11
  podTemplate:
    spec:
      containers:
      - name: maps
        env:
          - name: NODE_OPTIONS
            value: "--max-old-space-size=980"
        resources:
          requests:
            memory: 1Gi
            cpu: 1
          limits:
            memory: 1Gi
            cpu: 1
APM Server.
apiVersion: apm.k8s.elastic.co/v1
kind: ApmServer
metadata:
  name: quickstart
spec:
  version: 8.19.11
  podTemplate:
    spec:
      containers:
      - name: apm-server
        resources:
          requests:
            memory: 1Gi
            cpu: 0.5
          limits:
            memory: 2Gi
            cpu: 2
Enterprise Search.
apiVersion: enterprisesearch.k8s.elastic.co/v1
kind: EnterpriseSearch
metadata:
  name: enterprise-search-quickstart
spec:
  version: 8.19.11
  podTemplate:
    spec:
      containers:
      - name: enterprise-search
        resources:
          requests:
            memory: 4Gi
            cpu: 1
          limits:
            memory: 4Gi
            cpu: 2
        env:
        - name: JAVA_OPTS
          value: -Xms3500m -Xmx3500m
Logstash.
apiVersion: logstash.k8s.elastic.co/v1
kind: logstash
metadata:
  name: logstash-quickstart
spec:
  version: 8.19.11
  podTemplate:
    spec:
      containers:
      - name: logstash
        resources:
          requests:
            memory: 4Gi
            cpu: 1
          limits:
            memory: 4Gi
            cpu: 2
        env:
        - name: LS_JAVA_OPTS
          value: -Xms2000m -Xmx2000m
For the container name, use apm-server, maps, kibana or enterprise-search, respectively.
Set compute resources for Beats and Elastic Agent
editFor Beats or Elastic Agent objects, the podTemplate can be configured as follows, depending on the chosen deployment model.
When deploying as a Kubernetes Deployment:
apiVersion: beat.k8s.elastic.co/v1beta1
kind: Beat
metadata:
  name: quickstart
spec:
  type: filebeat
  version: 8.19.11
  deployment:
    podTemplate:
      spec:
        containers:
        - name: filebeat
          resources:
            requests:
              memory: 300Mi
              cpu: 0.5
            limits:
              memory: 500Mi
              cpu: 0.5
When deploying as a Kubernetes DaemonSet:
apiVersion: agent.k8s.elastic.co/v1alpha1
kind: Agent
metadata:
  name: elastic-agent
spec:
  version: 8.19.11
  daemonSet:
    podTemplate:
      spec:
        containers:
        - name: agent
          resources:
            requests:
              memory: 300Mi
              cpu: 0.5
            limits:
              memory: 300Mi
              cpu: 0.5
For the container name, use the name of the Beat in lower case. For example filebeat, metricbeat, or heartbeat. In case of Elastic Agent, use agent.
Default behavior
editIf resources is not defined in the specification of an object, then the operator applies a default memory limit to ensure that Pods have enough resources to start correctly. This memory limit will also be applied to any user-defined init containers that do not have explict resource requirements set. As the operator cannot make assumptions about the available CPU resources in the cluster, no CPU limits will be set — resulting in the Pods having the "Burstable" QoS class. Check if this is acceptable for your use case and follow the instructions in Set compute resources to configure appropriate limits.
Table 1. Default limits applied by the operator
| Type | Requests | Limits |
|---|---|---|
APM Server |
|
|
Elasticsearch |
|
|
Kibana |
|
|
Beat |
|
|
Elastic Agent |
|
|
Elastic Maps Server |
|
|
Enterprise Search |
|
|
Logstash |
|
|
If the Kubernetes cluster is configured with LimitRanges that enforce a minimum memory constraint, they could interfere with the operator defaults and cause object creation to fail.
For example, you might have a LimitRange that enforces a default and minimum memory limit on containers as follows:
apiVersion: v1
kind: LimitRange
metadata:
  name: default-mem-per-container
spec:
  limits:
  - min:
      memory: "3Gi"
    defaultRequest:
      memory: "3Gi"
    type: Container
With this limit range in place, if you create an Elasticsearch object without defining the resources section, you will get the following error:
Cannot create pod elasticsearch-sample-es-ldbgj48c7r: pods "elasticsearch-sample-es-ldbgj48c7r" is forbidden: minimum memory usage per Container is 3Gi, but request is 2Gi
To avoid this, explicitly define the requests and limits mandated by your environment in the resource specification. It will prevent the operator from applying the built-in defaults.
Monitor compute resources
editUsing Beats
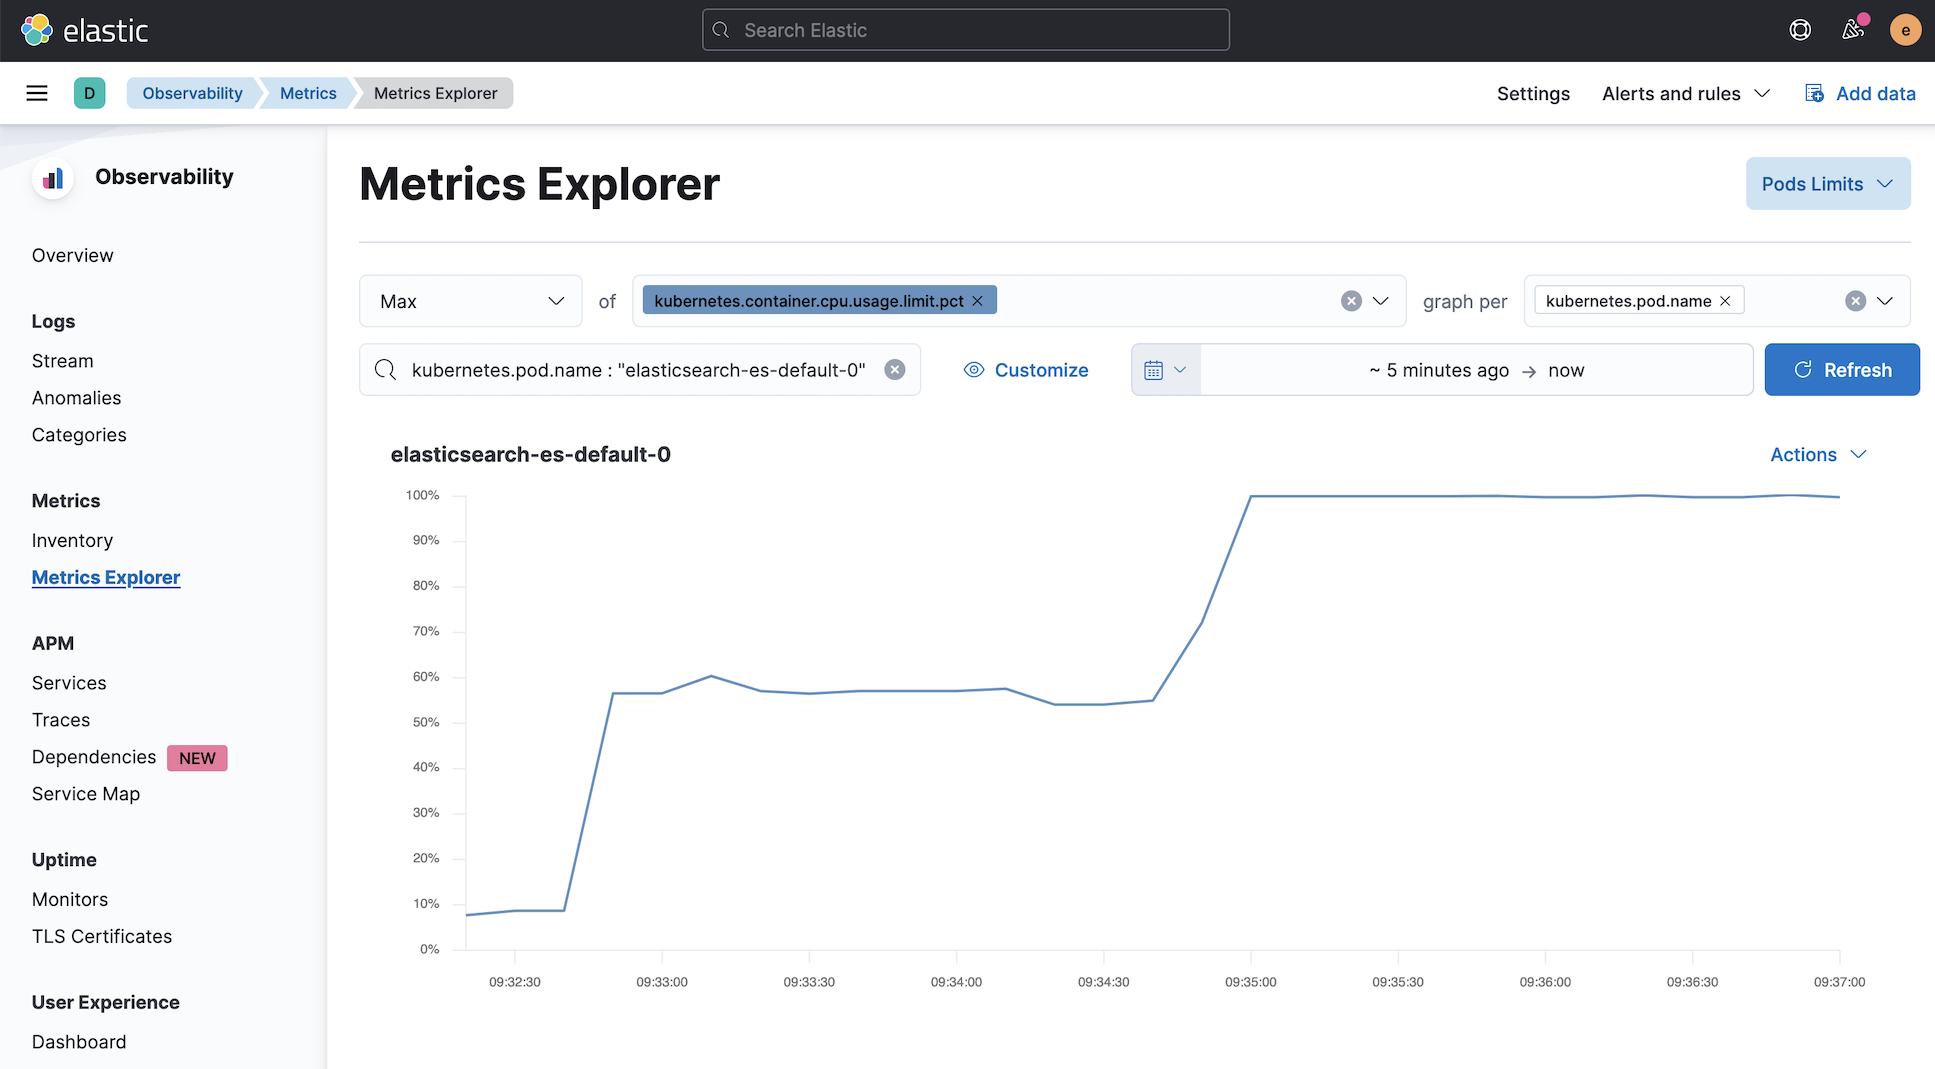
editMetricbeat can collect the percentage of both the CPU and the memory limits used by each Pod (or total node allocatable if resource is not limited). The two relevant metrics are kubernetes.pod.cpu.usage.limit.pct for CPU, and kubernetes.pod.memory.usage.node.pct for memory.

Monitoring Elasticsearch CPU using Stack Monitoring
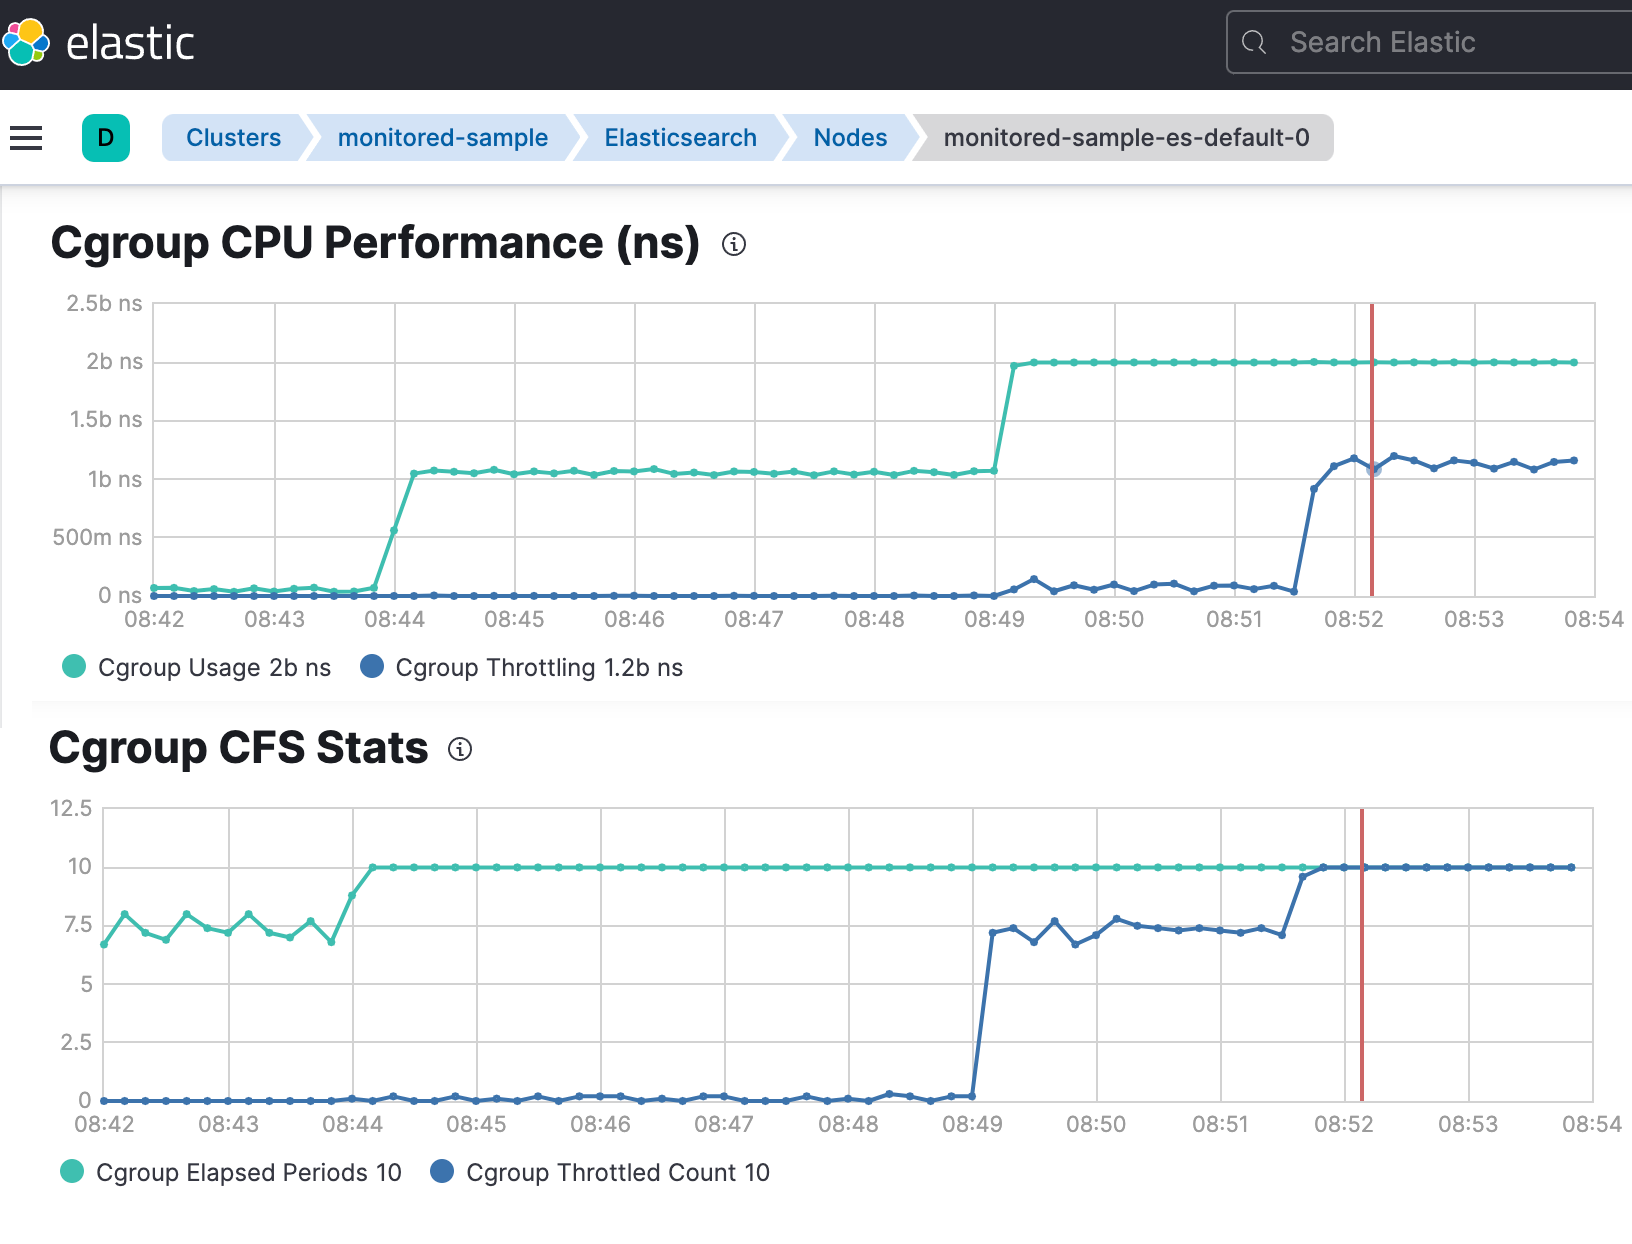
editIf Stack Monitoring is enabled, the pressure applied by the CPU cgroup controller to an Elasticsearch node can be evaluated from the Stack Monitoring page in Kibana.
- On the Stack Monitoring page select the Elasticsearch node you want to monitor.
- Select the Advanced tab.
In the following example, an Elasticsearch container is limited to 2 cores.
nodeSets:
- name: default
  count: 3
  podTemplate:
    spec:
      containers:
        - name: elasticsearch
          resources:
            limits:
              cpu: 2
The Cgroup usage curve shows that the CPU usage of this container has been steadily increasing up to 2 cores. Then, while the container was still requesting more CPU, the Cgroup Throttling curve shows how much the Elasticsearch container has been throttled:
