Using OpenTelemetry
You can use OpenTelemetry to monitor the performance and behavior of your Elasticsearch requests through the Java API Client. The Java API Client comes with built-in OpenTelemetry instrumentation that emits distributed tracing spans by default. With that, applications instrumented with OpenTelemetry or running the OpenTelemetry Java Agent are inherently enriched with additional spans that contain insightful information about the execution of the Elasticsearch requests.
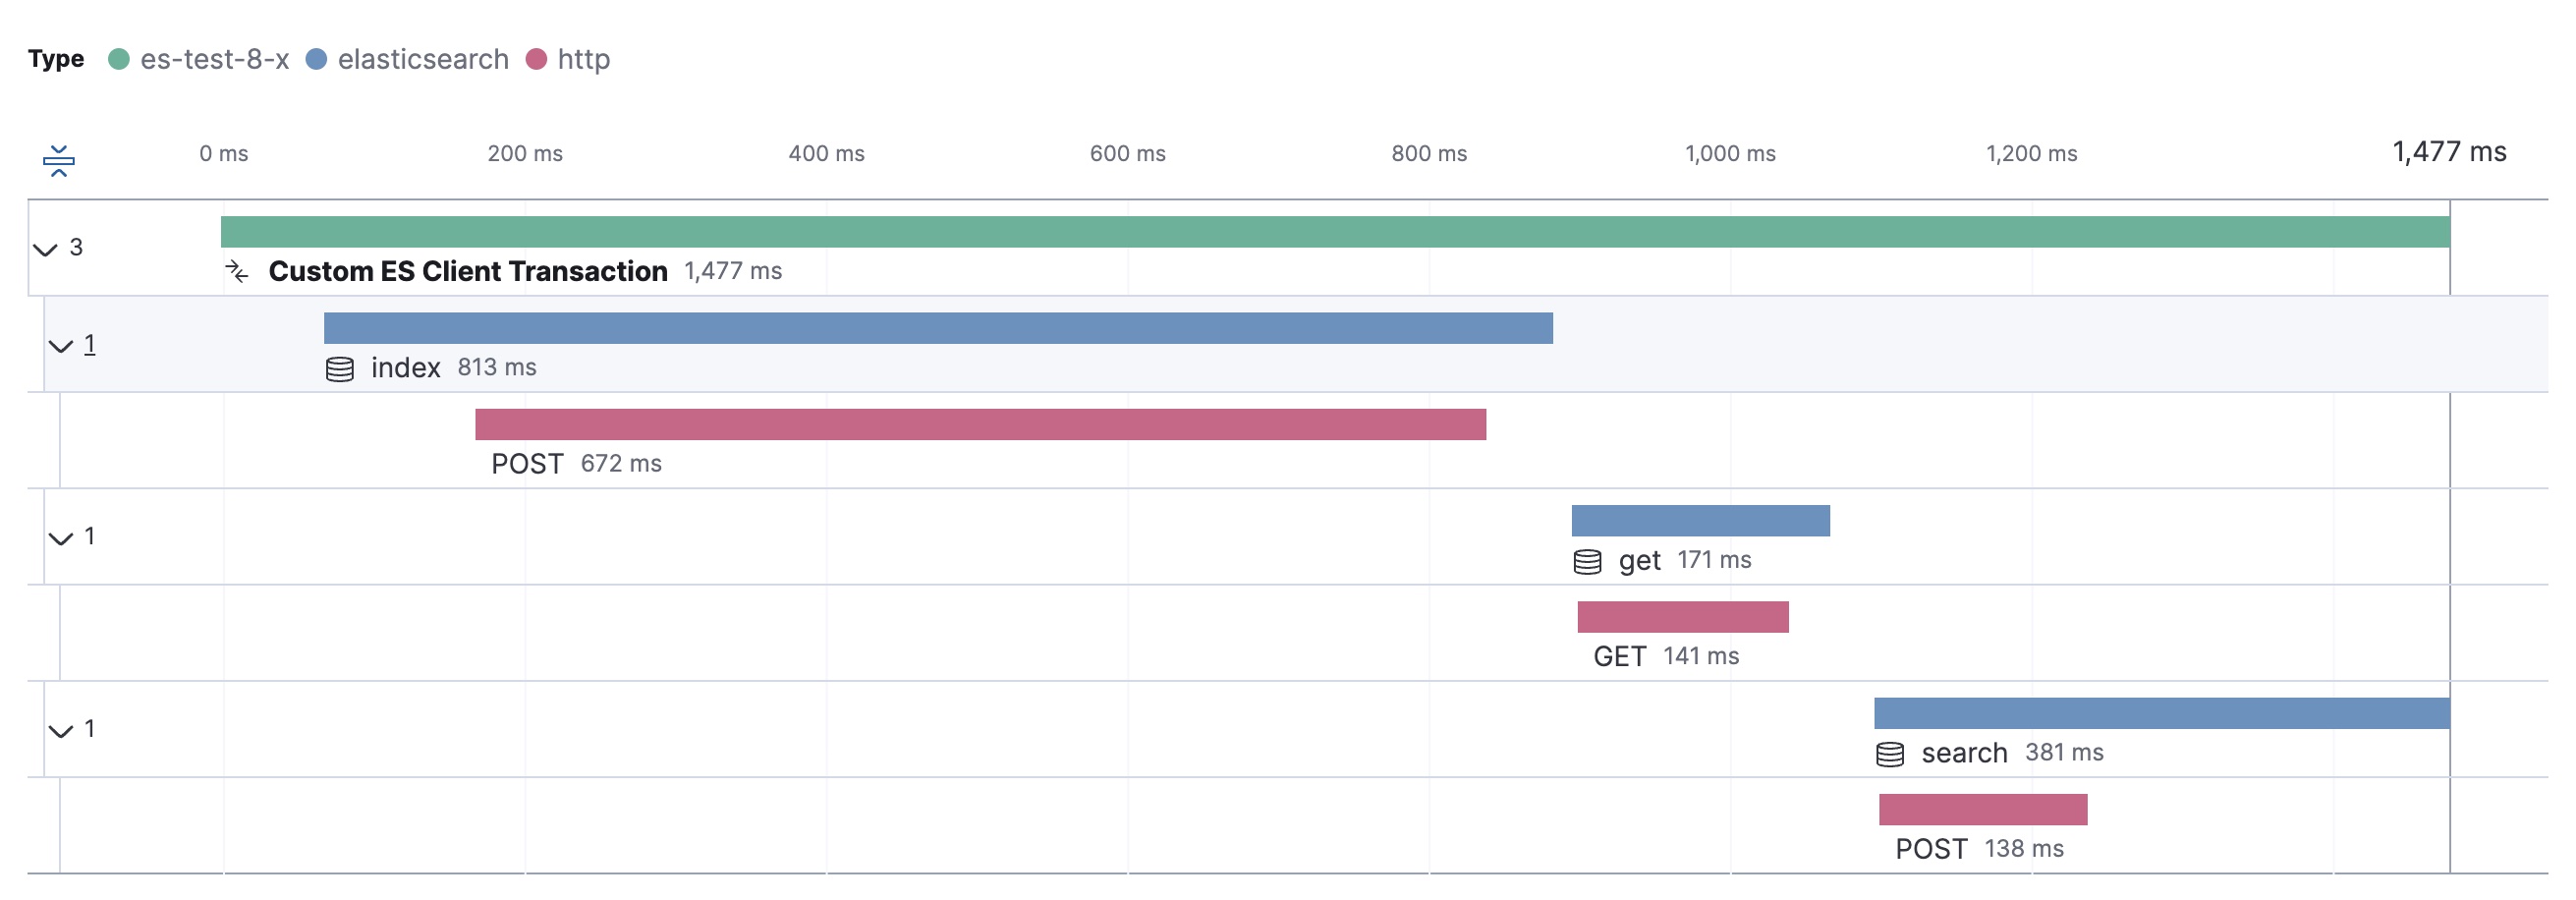
The native instrumentation in the Java API Client follows the OpenTelemetry Semantic Conventions for Elasticsearch. In particular, the instrumentation in the client covers the logical layer of Elasticsearch requests. A single span per request is created that is processed by the service through the Java API Client. The following image shows a trace that records the handling of three different Elasticsearch requests: an index, get and a search request:

Usually, OpenTelemetry agents and auto-instrumentation modules come with instrumentation support for HTTP-level communication. In this case, in addition to the logical Elasticsearch client requests, spans will be captured for the physical HTTP requests emitted by the client. The following image shows a trace with both, Elasticsearch spans (in blue) and the corresponding HTTP-level spans (in red):

Advanced Java API Client behavior such as nodes round-robin and request retries are revealed through the combination of logical Elasticsearch spans and the physical HTTP spans. The following example shows an index request in a scenario with two Elasticsearch nodes:

The first node is unavailable and results in an HTTP error, while the retry to the second node succeeds. Both HTTP requests are subsumed by the logical Elasticsearch request span (in blue).
When using the OpenTelemetry Java SDK manually or using the OpenTelemetry Java Agent, the Java API Client’s OpenTelemetry instrumentation is enabled by default and uses the globally registered OpenTelemetry SDK instance (i.e. GlobalOpenTelemetry). So, if you don’t use a custom, local OpenTelemetry SDK instance, there is no explicit setup required to use the Java API Client’s OpenTelemetry instrumentation.
In case you are using manual OpenTelemetry instrumentation with a custom OpenTelemetry SDK instance that is not registered globally, you can create the Java API Client using a custom OpenTelemetry instance. The following code snippet shows an example of using a custom OpenTelemetry instance.
// URL and API key
String serverUrl = "https://localhost:9200";
String apiKey = "VnVhQ2ZHY0JDZGJrU...";

// Create and configure custom OpenTelemetry instance
OpenTelemetry customOtel = OpenTelemetrySdk.builder().build();

// Create Instrumentation instance using the custom OpenTelemetry instance
// Second constructor argument allows to enable/disable search body capturing
OpenTelemetryForElasticsearch esOtelInstrumentation =
    new OpenTelemetryForElasticsearch(customOtel, false);

ElasticsearchClient esClient = ElasticsearchClient.of(b -> b
    .host(serverUrl)
    .apiKey(apiKey)
    .instrumentation(esOtelInstrumentation)
);

// Use the client...

// Close the client, also closing the underlying transport object and network connections.
esClient.close();
You can configure the OpenTelemetry instrumentation either through Java System properties or Environment Variables. The following configuration options are available.
With this configuration option you can enable (default) or disable the built-in OpenTelemetry instrumentation.
Default: true
| Java System Property | otel.instrumentation.elasticsearch.enabled |
| Environment Variable | OTEL_INSTRUMENTATION_ELASTICSEARCH_ENABLED |
Per default, the built-in OpenTelemetry instrumentation does not capture request bodies due to data privacy considerations. You can use this option to enable capturing of search queries from the the request bodies of Elasticsearch search requests in case you wish to gather this information regardless.
Default: false
| Java System Property | otel.instrumentation.elasticsearch.capture-search-query |
| Environment Variable | OTEL_INSTRUMENTATION_ELASTICSEARCH_CAPTURE_SEARCH_QUERY |
The OpenTelemetry instrumentation (as any other monitoring approach) may come with a little overhead on CPU, memory and/or latency. The overhead may only occur when the instrumentation is enabled (default) and an OpenTelemetry SDK (or an OpenTelemetry Agent) is active in the target application. In case that either the instrumentation is disabled or no OpenTelemetry SDK (or OpenTelemetry Agent) is active with the target application, there is no monitoring overhead expected when using the client.
Even when the instrumentation is enabled and is being actively used (by an OpenTelemetry SDK), in the vast majority of cases the overhead is very small and negligible. In edge cases in which there is a noticable overhead the instrumentation can be explicitly disabled to eliminate any potential overhead effect of the instrumentation.