Transform examples
editTransform examples
editThese examples demonstrate how to use transforms to derive useful insights from your data. All the examples use one of the Kibana sample datasets. For a more detailed, step-by-step example, see Tutorial: Transforming the eCommerce sample data.
Finding your best customers
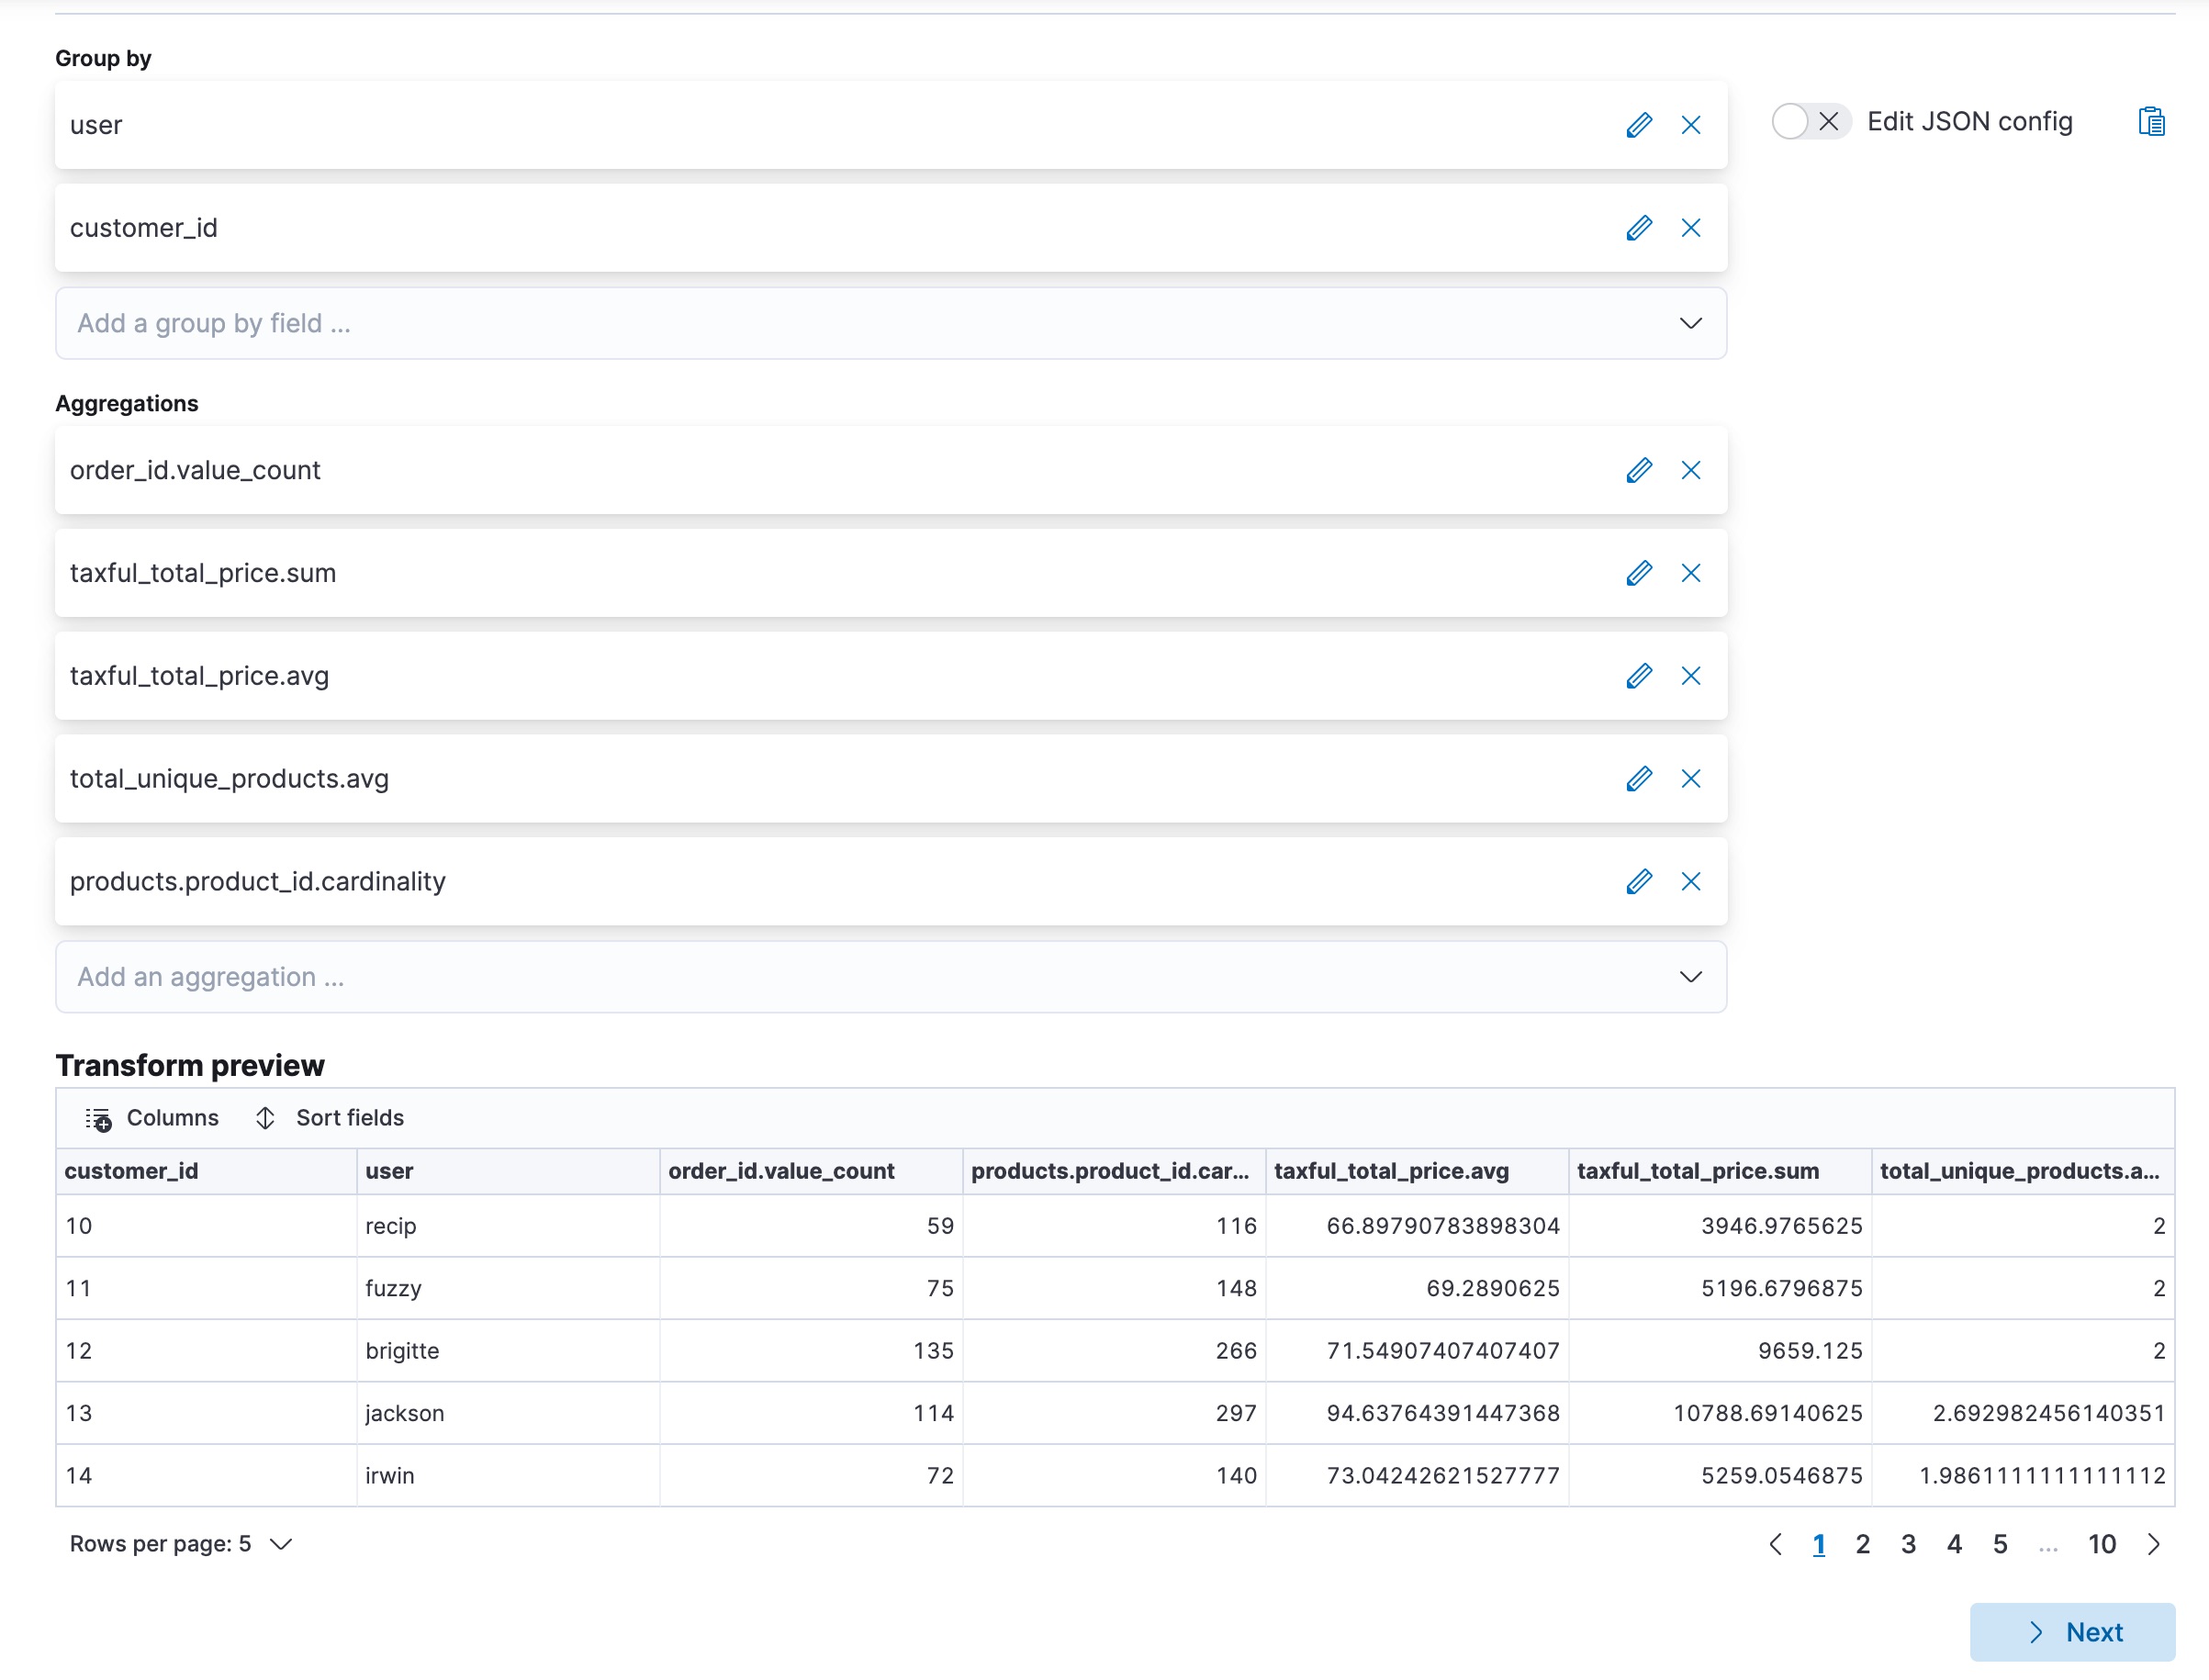
editThis example uses the eCommerce orders sample data set to find the customers who
spent the most in a hypothetical webshop. Let’s use the pivot type of
transform such that the destination index contains the number of orders, the
total price of the orders, the amount of unique products and the average price
per order, and the total amount of ordered products for each customer.

Alternatively, you can use the preview transform and the create transform API.
API example
POST _transform/_preview
{
  "source": {
    "index": "kibana_sample_data_ecommerce"
  },
  "dest" : {
    "index" : "sample_ecommerce_orders_by_customer"
  },
  "pivot": {
    "group_by": {
      "user": { "terms": { "field": "user" }},
      "customer_id": { "terms": { "field": "customer_id" }}
    },
    "aggregations": {
      "order_count": { "value_count": { "field": "order_id" }},
      "total_order_amt": { "sum": { "field": "taxful_total_price" }},
      "avg_amt_per_order": { "avg": { "field": "taxful_total_price" }},
      "avg_unique_products_per_order": { "avg": { "field": "total_unique_products" }},
      "total_unique_products": { "cardinality": { "field": "products.product_id" }}
    }
  }
}
|
The destination index for the transform. It is ignored by |
|
|
Two |
In the example above, condensed JSON formatting is used for easier readability of the pivot object.
The preview transforms API enables you to see the layout of the transform in advance, populated with some sample values. For example:
{
  "preview" : [
    {
      "total_order_amt" : 3946.9765625,
      "order_count" : 59.0,
      "total_unique_products" : 116.0,
      "avg_unique_products_per_order" : 2.0,
      "customer_id" : "10",
      "user" : "recip",
      "avg_amt_per_order" : 66.89790783898304
    },
    ...
    ]
  }
This transform makes it easier to answer questions such as:
- Which customers spend the most?
- Which customers spend the most per order?
- Which customers order most often?
- Which customers ordered the least number of different products?
It’s possible to answer these questions using aggregations alone, however transforms allow us to persist this data as a customer centric index. This enables us to analyze data at scale and gives more flexibility to explore and navigate data from a customer centric perspective. In some cases, it can even make creating visualizations much simpler.
Finding air carriers with the most delays
editThis example uses the Flights sample data set to find out which air carrier
had the most delays. First, filter the source data such that it excludes all
the cancelled flights by using a query filter. Then transform the data to
contain the distinct number of flights, the sum of delayed minutes, and the sum
of the flight minutes by air carrier. Finally, use a
bucket_script
to determine what percentage of the flight time was actually delay.
POST _transform/_preview
{
  "source": {
    "index": "kibana_sample_data_flights",
    "query": {
      "bool": {
        "filter": [
          { "term":  { "Cancelled": false } }
        ]
      }
    }
  },
  "dest" : {
    "index" : "sample_flight_delays_by_carrier"
  },
  "pivot": {
    "group_by": {
      "carrier": { "terms": { "field": "Carrier" }}
    },
    "aggregations": {
      "flights_count": { "value_count": { "field": "FlightNum" }},
      "delay_mins_total": { "sum": { "field": "FlightDelayMin" }},
      "flight_mins_total": { "sum": { "field": "FlightTimeMin" }},
      "delay_time_percentage": {
        "bucket_script": {
          "buckets_path": {
            "delay_time": "delay_mins_total.value",
            "flight_time": "flight_mins_total.value"
          },
          "script": "(params.delay_time / params.flight_time) * 100"
        }
      }
    }
  }
}
|
Filter the source data to select only flights that are not cancelled. |
|
|
The destination index for the transform. It is ignored by |
|
|
The data is grouped by the |
|
|
This |
The preview shows you that the new index would contain data like this for each carrier:
{
  "preview" : [
    {
      "carrier" : "ES-Air",
      "flights_count" : 2802.0,
      "flight_mins_total" : 1436927.5130677223,
      "delay_time_percentage" : 9.335543983955839,
      "delay_mins_total" : 134145.0
    },
    ...
  ]
}
This transform makes it easier to answer questions such as:
- Which air carrier has the most delays as a percentage of flight time?
This data is fictional and does not reflect actual delays or flight stats for any of the featured destination or origin airports.
Finding suspicious client IPs
editThis example uses the web log sample data set to identify suspicious client IPs.
It transform the data such that the new index contains the sum of bytes and the
number of distinct URLs, agents, incoming requests by location, and geographic
destinations for each client IP. It also uses filter aggregations to count the
specific types of HTTP responses that each client IP receives. Ultimately, the
example below transforms web log data into an entity centric index where the
entity is clientip.
PUT _transform/suspicious_client_ips
{
  "source": {
    "index": "kibana_sample_data_logs"
  },
  "dest" : {
    "index" : "sample_weblogs_by_clientip"
  },
  "sync" : {
    "time": {
      "field": "timestamp",
      "delay": "60s"
    }
  },
  "pivot": {
    "group_by": {
      "clientip": { "terms": { "field": "clientip" } }
      },
    "aggregations": {
      "url_dc": { "cardinality": { "field": "url.keyword" }},
      "bytes_sum": { "sum": { "field": "bytes" }},
      "geo.src_dc": { "cardinality": { "field": "geo.src" }},
      "agent_dc": { "cardinality": { "field": "agent.keyword" }},
      "geo.dest_dc": { "cardinality": { "field": "geo.dest" }},
      "responses.total": { "value_count": { "field": "timestamp" }},
      "success" : {
         "filter": {
            "term": { "response" : "200"}}
        },
      "error404" : {
         "filter": {
            "term": { "response" : "404"}}
        },
      "error5xx" : {
         "filter": {
            "range": { "response" : { "gte": 500, "lt": 600}}}
        },
      "timestamp.min": { "min": { "field": "timestamp" }},
      "timestamp.max": { "max": { "field": "timestamp" }},
      "timestamp.duration_ms": {
        "bucket_script": {
          "buckets_path": {
            "min_time": "timestamp.min.value",
            "max_time": "timestamp.max.value"
          },
          "script": "(params.max_time - params.min_time)"
        }
      }
    }
  }
}
|
The destination index for the transform. |
|
|
Configures the transform to run continuously. It uses the |
|
|
The data is grouped by the |
|
|
Filter aggregation that counts the occurrences of successful ( |
|
|
This |
After you create the transform, you must start it:
POST _transform/suspicious_client_ips/_start
Shortly thereafter, the first results should be available in the destination index:
GET sample_weblogs_by_clientip/_search
The search result shows you data like this for each client IP:
    "hits" : [
      {
        "_index" : "sample_weblogs_by_clientip",
        "_id" : "MOeHH_cUL5urmartKj-b5UQAAAAAAAAA",
        "_score" : 1.0,
        "_source" : {
          "geo" : {
            "src_dc" : 2.0,
            "dest_dc" : 2.0
          },
          "success" : 2,
          "error404" : 0,
          "error503" : 0,
          "clientip" : "0.72.176.46",
          "agent_dc" : 2.0,
          "bytes_sum" : 4422.0,
          "responses" : {
            "total" : 2.0
          },
          "url_dc" : 2.0,
          "timestamp" : {
            "duration_ms" : 5.2191698E8,
            "min" : "2020-03-16T07:51:57.333Z",
            "max" : "2020-03-22T08:50:34.313Z"
          }
        }
      }
    ]
Like other Kibana sample data sets, the web log sample dataset contains timestamps relative to when you installed it, including timestamps in the future. The continuous transform will pick up the data points once they are in the past. If you installed the web log sample dataset some time ago, you can uninstall and reinstall it and the timestamps will change.
This transform makes it easier to answer questions such as:
- Which client IPs are transferring the most amounts of data?
- Which client IPs are interacting with a high number of different URLs?
- Which client IPs have high error rates?
- Which client IPs are interacting with a high number of destination countries?
Finding the last log event for each IP address
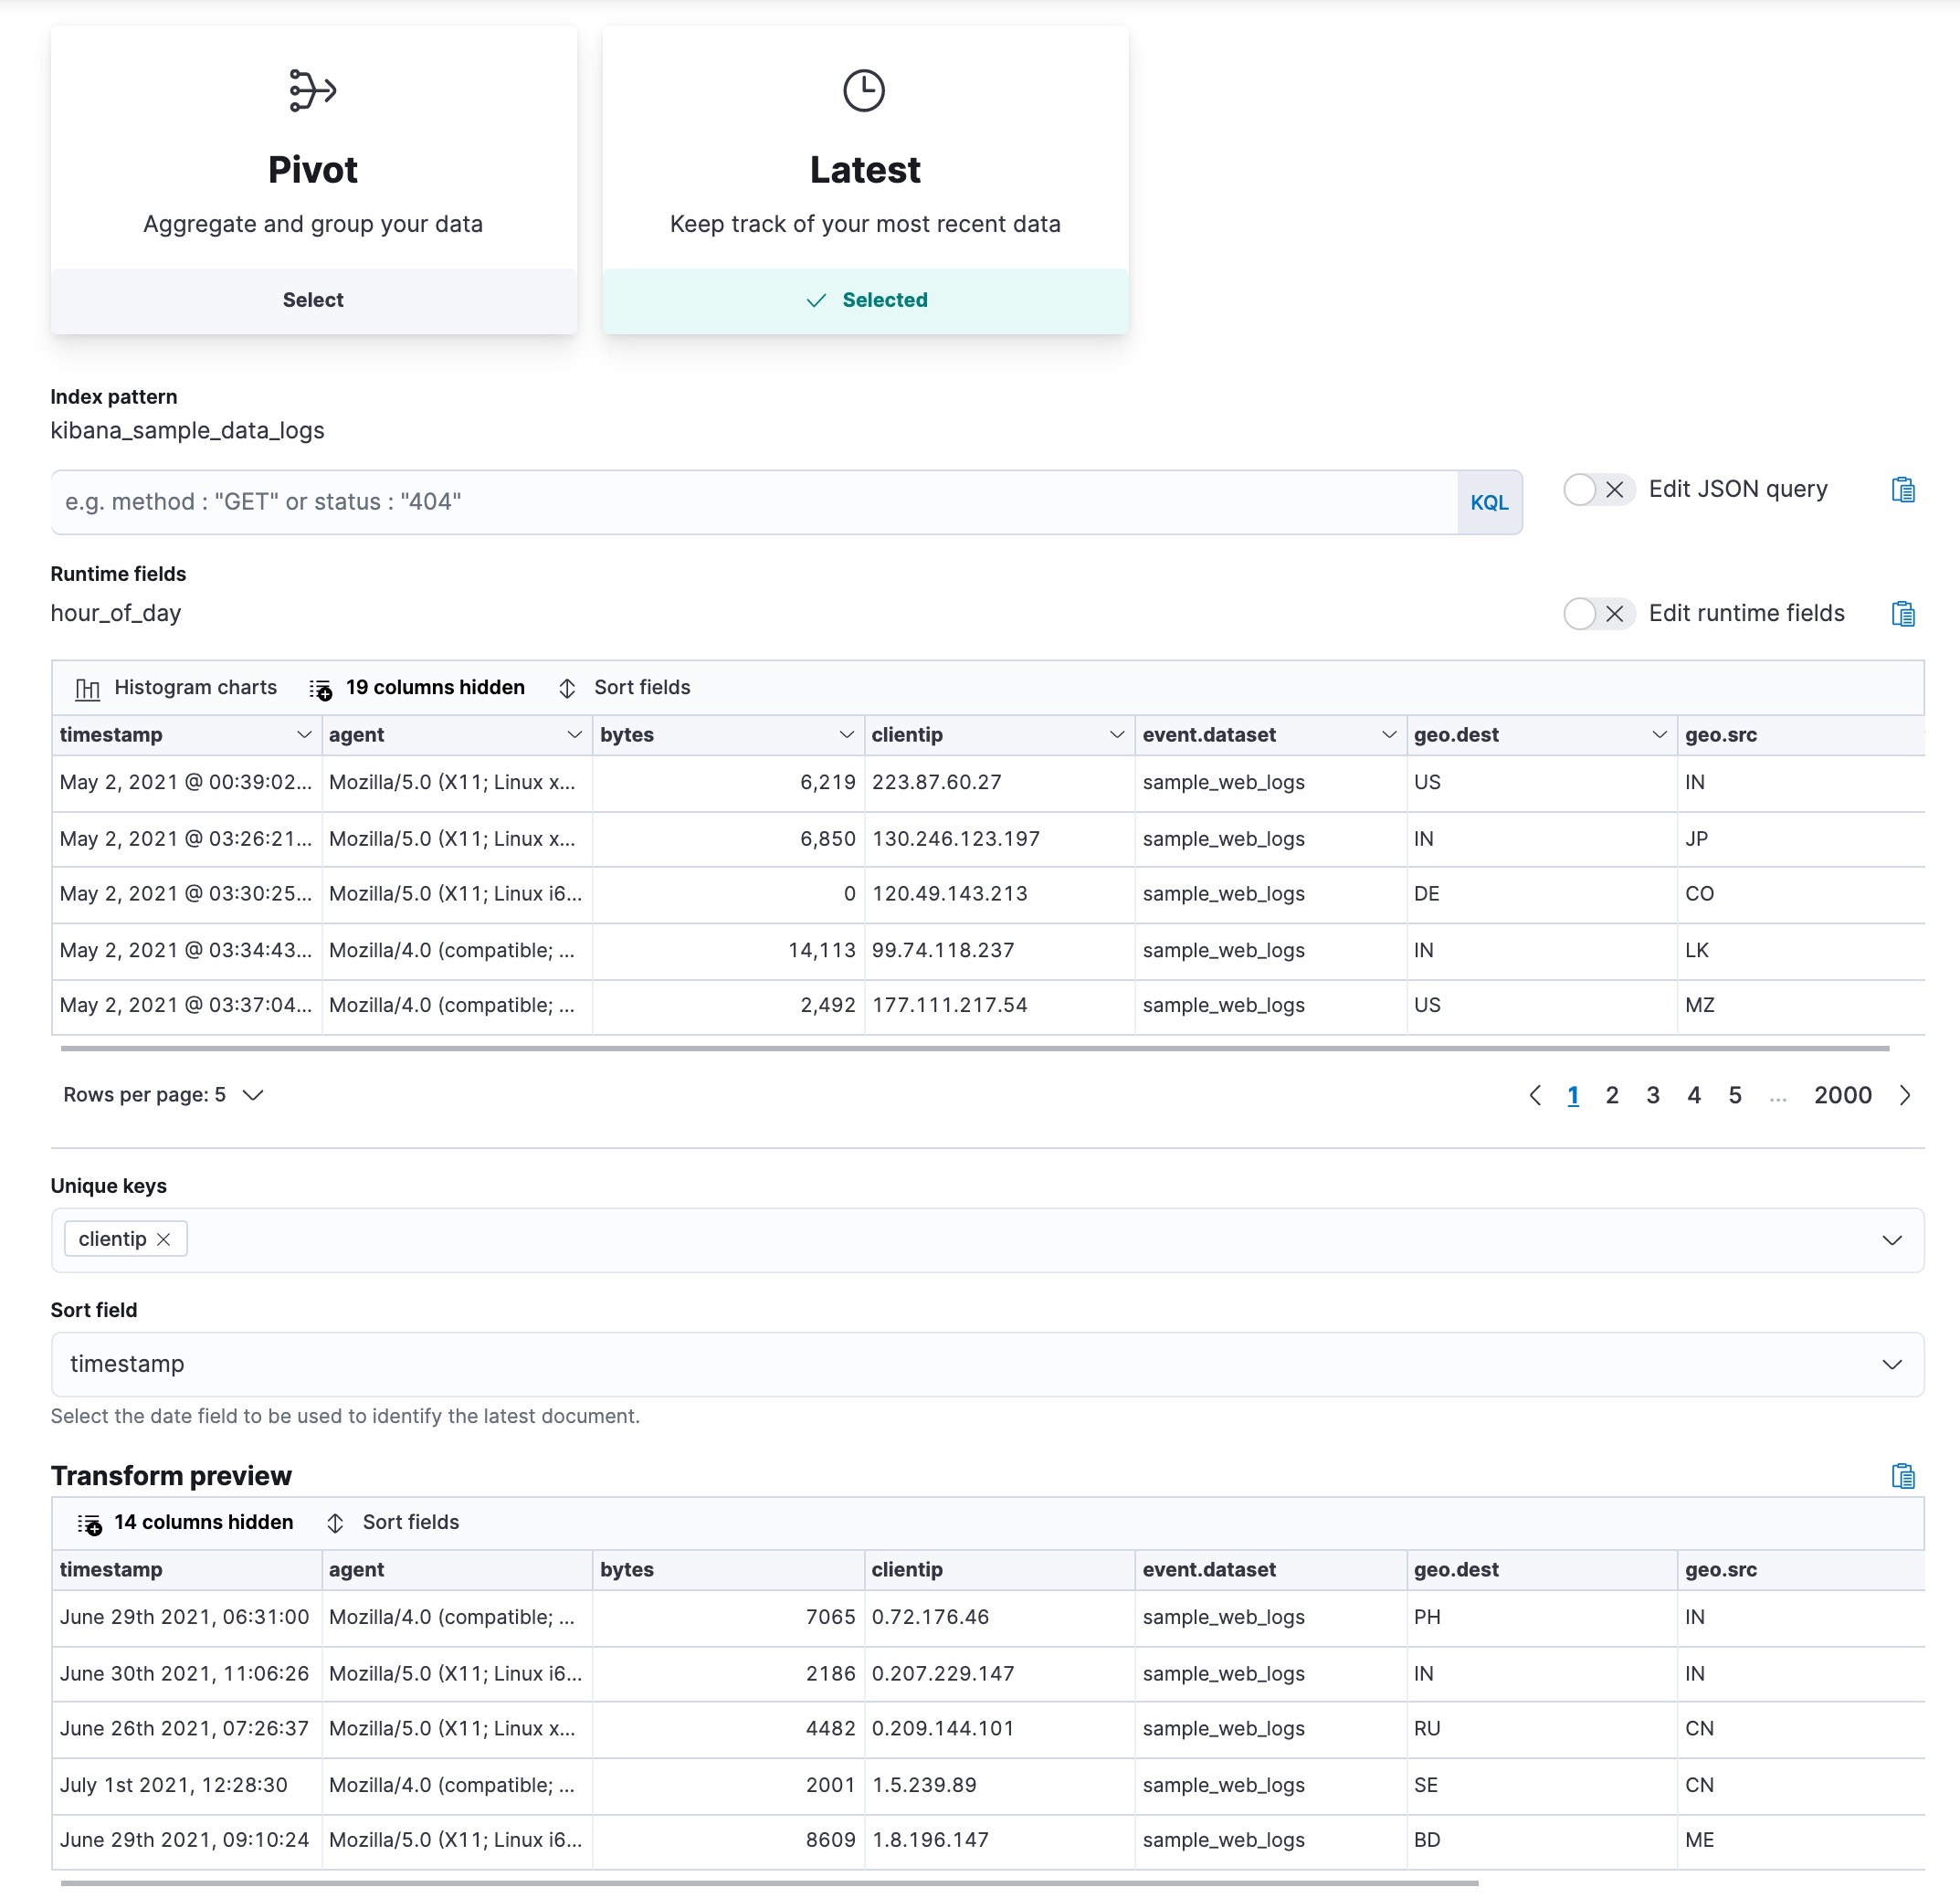
editThis example uses the web log sample data set to find the last log from an IP
address. Let’s use the latest type of transform in continuous mode. It
copies the most recent document for each unique key from the source index to the
destination index and updates the destination index as new data comes into the
source index.
Pick the clientip field as the unique key; the data is grouped by this field.
Select timestamp as the date field that sorts the data chronologically. For
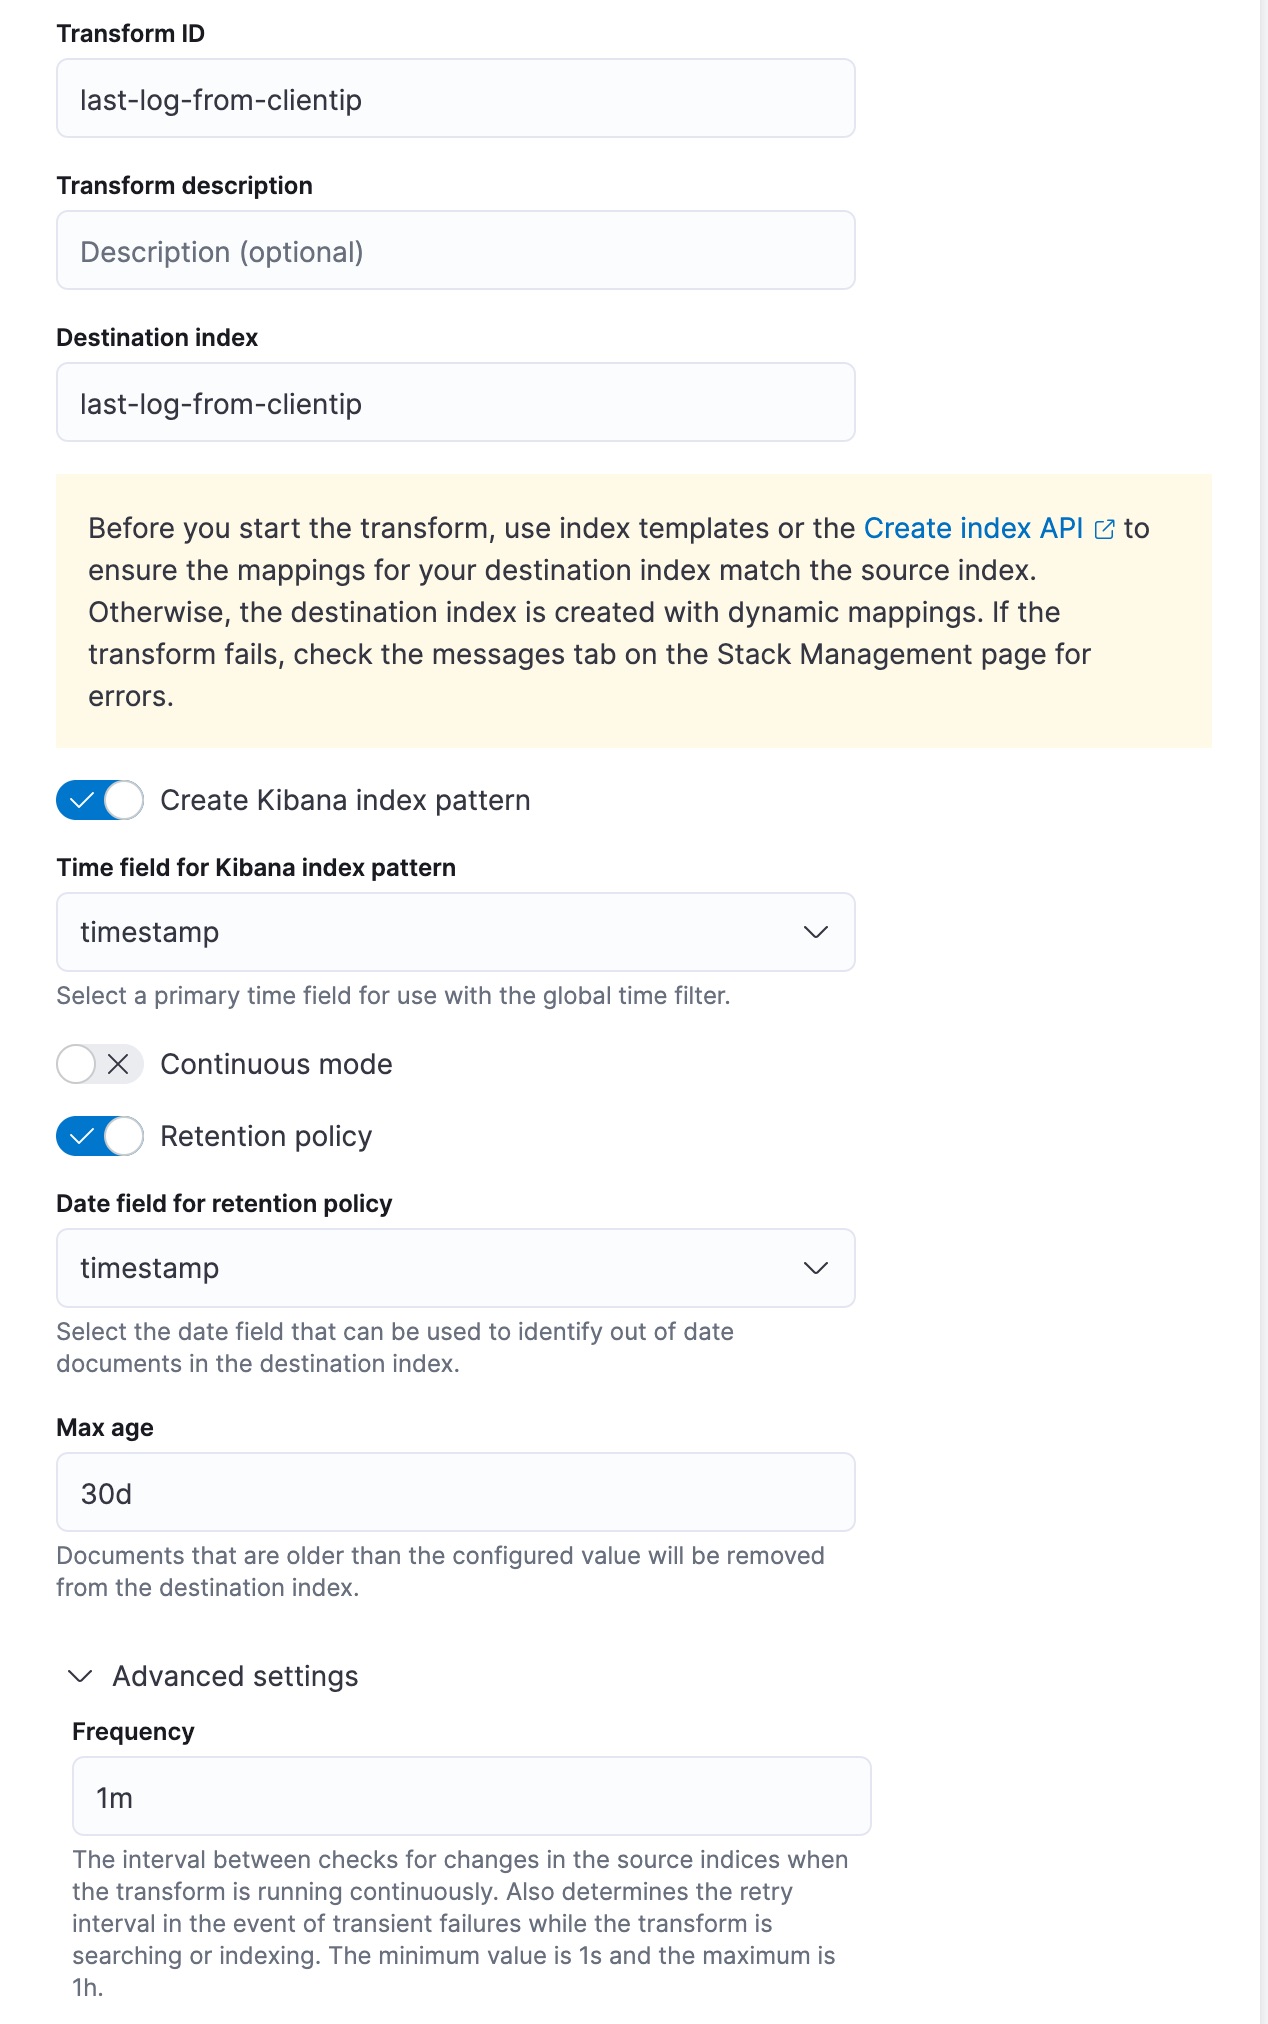
continuous mode, specify a date field that is used to identify new documents,
and an interval between checks for changes in the source index.

Let’s assume that we’re interested in retaining documents only for IP addresses that appeared recently in the log. You can define a retention policy and specify a date field that is used to calculate the age of a document. This example uses the same date field that is used to sort the data. Then set the maximum age of a document; documents that are older than the value you set will be removed from the destination index.

This transform creates the destination index that contains the latest login date for each client IP. As the transform runs in continuous mode, the destination index will be updated as new data that comes into the source index. Finally, every document that is older than 30 days will be removed from the destination index due to the applied retention policy.
API example
PUT _transform/last-log-from-clientip
{
  "source": {
    "index": [
      "kibana_sample_data_logs"
    ]
  },
  "latest": {
    "unique_key": [
      "clientip"
    ],
    "sort": "timestamp"
  },
  "frequency": "1m",
  "dest": {
    "index": "last-log-from-clientip"
  },
  "sync": {
    "time": {
      "field": "timestamp",
      "delay": "60s"
    }
  },
  "retention_policy": {
    "time": {
      "field": "timestamp",
      "max_age": "30d"
    }
  },
  "settings": {
    "max_page_search_size": 500
  }
}
|
Specifies the field for grouping the data. |
|
|
Specifies the date field that is used for sorting the data. |
|
|
Sets the interval for the transform to check for changes in the source index. |
|
|
Contains the time field and delay settings used to synchronize the source and destination indices. |
|
|
Specifies the retention policy for the transform. Documents that are older than the configured value will be removed from the destination index. |
After you create the transform, start it:
POST _transform/last-log-from-clientip/_start
After the transform processes the data, search the destination index:
GET last-log-from-clientip/_search
The search result shows you data like this for each client IP:
{
  "_index" : "last-log-from-clientip",
  "_id" : "MOeHH_cUL5urmartKj-b5UQAAAAAAAAA",
  "_score" : 1.0,
  "_source" : {
    "referer" : "http://twitter.com/error/don-lind",
    "request" : "/elasticsearch",
    "agent" : "Mozilla/4.0 (compatible; MSIE 6.0; Windows NT 5.1; SV1; .NET CLR 1.1.4322)",
    "extension" : "",
    "memory" : null,
    "ip" : "0.72.176.46",
    "index" : "kibana_sample_data_logs",
    "message" : "0.72.176.46 - - [2018-09-18T06:31:00.572Z] \"GET /elasticsearch HTTP/1.1\" 200 7065 \"-\" \"Mozilla/4.0 (compatible; MSIE 6.0; Windows NT 5.1; SV1; .NET CLR 1.1.4322)\"",
    "url" : "https://www.elastic.co/downloads/elasticsearch",
    "tags" : [
      "success",
      "info"
    ],
    "geo" : {
      "srcdest" : "IN:PH",
      "src" : "IN",
      "coordinates" : {
        "lon" : -124.1127917,
        "lat" : 40.80338889
      },
      "dest" : "PH"
    },
    "utc_time" : "2021-05-04T06:31:00.572Z",
    "bytes" : 7065,
    "machine" : {
      "os" : "ios",
      "ram" : 12884901888
    },
    "response" : 200,
    "clientip" : "0.72.176.46",
    "host" : "www.elastic.co",
    "event" : {
      "dataset" : "sample_web_logs"
    },
    "phpmemory" : null,
    "timestamp" : "2021-05-04T06:31:00.572Z"
  }
}
This transform makes it easier to answer questions such as:
- What was the most recent log event associated with a specific IP address?