Use ES|QL in the Kibana UI
You can use Elasticsearch query language (ES|QL) in Kibana to query and aggregate your data, create visualizations, and set up alerts. This page guides you through the basics of working with ES|QL in the Kibana UI.
ES|QL is tightly integrated with Elastic solutions:
- Observability
- Query metrics, logs, and traces simultaneously
- Define fields dynamically, enrich data with lookups, and process queries in parallel
- Integrate with machine learning and AiOps for improved detection accuracy using aggregated thresholds
- Security
- Enrich investigation data with lookups and dynamic field creation
- Perform IP geolocation, threat intelligence, and cloud provider identification from a single query
- Use aggregated values in detection rules for more accurate alerts
- Find more details and examples in ES|QL for Elastic Security use cases
Find the complete list of supported commands, functions, and operators in the ES|QL reference.
To run the queries in this guide in the Kibana UI, you must load the "Sample web logs" sample data set. Follow these steps:
- Select Sample Data from the Integrations page in Kibana
- Select Other sample data sets
- Click Add data on the Sample web logs card
ES|QL is enabled by default in Kibana. It can be disabled using the enableESQL setting from the Advanced Settings.
This will hide the ES|QL user interface from various applications. However, users will be able to access existing ES|QL artifacts like saved searches and visualizations.
To get started with ES|QL, go to Discover. Next, select ES|QL or Try ES|QL from the application menu.
After switching to ES|QL mode, the query bar shows your previous KQL or Lucene query converted into ES|QL. If the query was empty, it shows a sample query. For example:
FROM kibana_sample_data_logs
  | LIMIT 10
Every query starts with a source command. In this query, the source command is FROM. FROM retrieves data from data streams, indices, or aliases. In this example, the data is retrieved from kibana_sample_data_logs.
A source command can be followed by one or more processing commands. In this query, the processing command is LIMIT. LIMIT limits the number of rows that are retrieved.
Click the ES|QL help button to open the in-product reference documentation for all commands and functions or to get recommended queries that will help you get started.
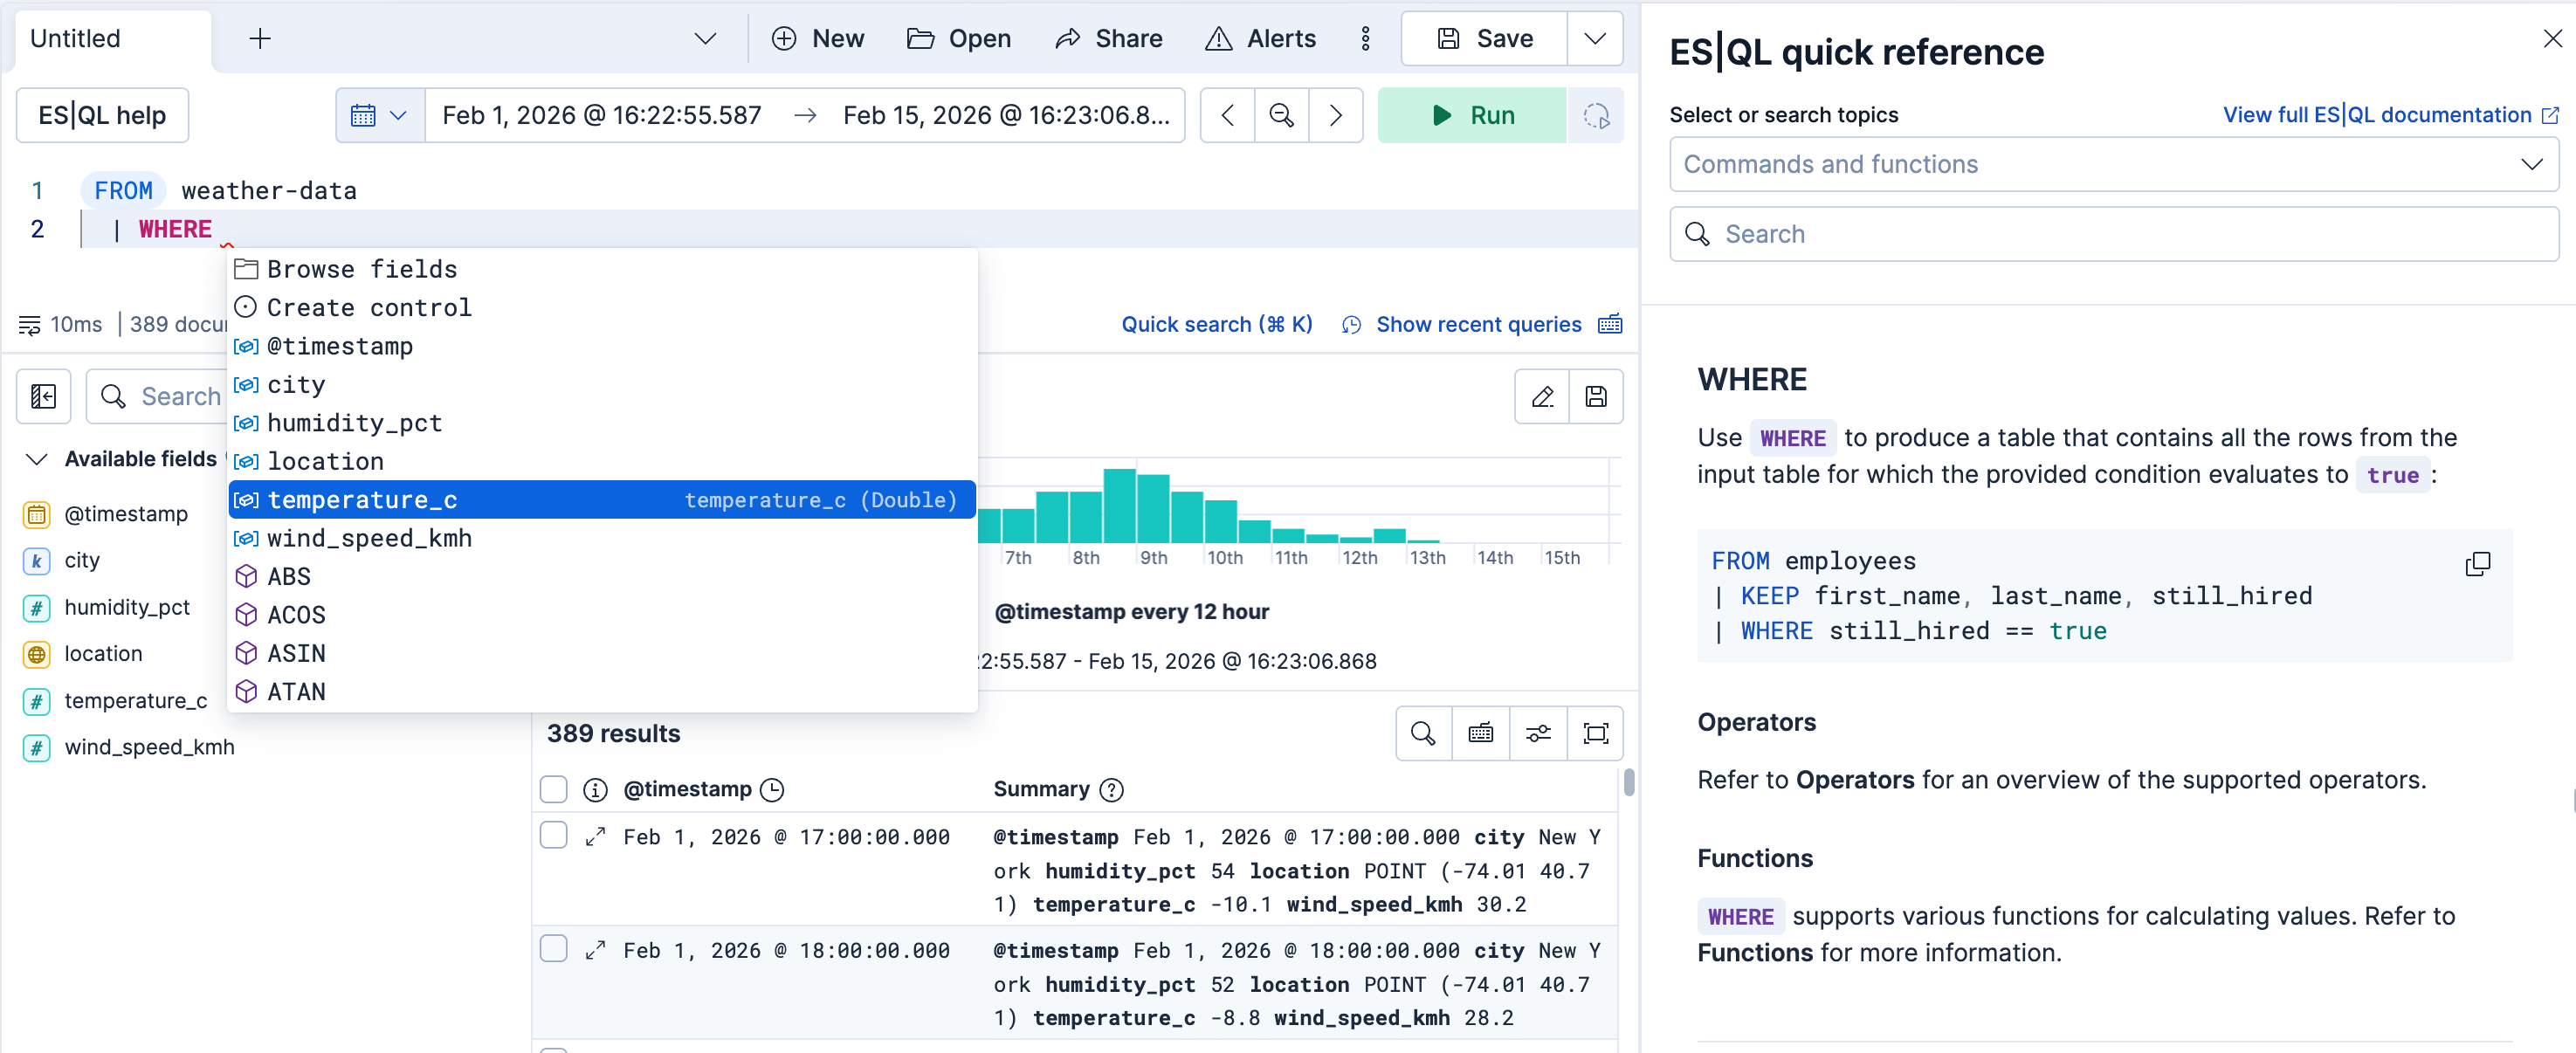
Discover suggests possible commands and functions to autocomplete your query:

ES|QL keywords are case-insensitive. The following query is identical to the previous one:
FROM kibana_sample_data_logs | LIMIT 10
You can use the Quick search functionality of the ES|QL editor to translate a free-text search into a functioning ES|QL query with a WHERE KQL() clause. This can be useful if you're getting started with ES|QL and are familiar with KQL.
- Select Quick search in the editor's footer, or press Cmd + k (Mac) or Ctrl + k (Windows/Linux) to open the Quick search bar.
- Select the data sources to search.
- Type the text you want to search for.
- Submit your search by pressing Enter. A new ES|QL query is generated and overwrites the current query. It includes a
FROMcommand based on the data sources you selected (orTSif the data source is a time series data stream), and aWHERE KQL()command that contains the text you typed in the search bar. Any queries that you have previously run are saved in the query history if you need to restore them. - Refine your query with any other ES|QL command or function that you need. The Quick search bar closes automatically when you start typing in the editor or click outside of it.

For readability, you can put each processing command on a new line and add indentation. The following query is identical to the previous one:
FROM kibana_sample_data_logs
| LIMIT 10
You can do that automatically using the Prettify query button from the query editor’s footer.

You can adjust the editor’s height by dragging its bottom border to your liking.
A query may result in warnings, for example when querying an unsupported field type. When that happens, a warning symbol is shown in the query bar. To see the detailed warning, expand the query bar, and click warnings.
You can reuse your recent ES|QL queries in the query bar. In the query bar, select Show recent queries.
You can then:
- scroll through your most recent queries
-
search for specific queries of your history

The maximum number of queries in the history depends on the version you're using:
-
The query history can keep up to 50 KB of queries, which represents about 200 large queries, or about 300 short queries. -
The query history keeps your 20 most recent queries.
ES|QL features in-app help, inline suggestions, and an autocomplete menu so you can get started faster and don’t have to leave the application to check syntax.

From the query history, you can mark some queries as favorite to find and access them faster later.
In the query bar, click Show recent queries.
From the Recent tab, you can star any queries you want.
In the Starred tab, find all the queries you have previously starred.

For the example query, the results table shows 10 rows. Omitting the LIMIT command, the results table defaults to up to 1000 rows. Using LIMIT, you can increase the limit to up to 10,000 rows.
The 10,000 row limit only applies to the number of rows that are retrieved by the query and displayed in Discover. Any query or aggregation runs on the full data set.
Each row shows two columns for the example query: a column with the @timestamp field and a column with the full document. To display specific fields from the documents, use the KEEP command:
FROM kibana_sample_data_logs
| KEEP @timestamp, bytes, geo.dest
To display all fields as separate columns, use KEEP *:
FROM kibana_sample_data_logs
| KEEP *
The maximum number of columns in Discover is 50. If a query returns more than 50 columns, Discover only shows the first 50.
To sort on one of the columns, click the column name you want to sort on and select the sort order. Note that this performs client-side sorting. It only sorts the rows that were retrieved by the query, which may not be the full dataset because of the (implicit) limit. To sort the full data set, use the SORT command:
FROM kibana_sample_data_logs
| KEEP @timestamp, bytes, geo.dest
| SORT bytes DESC
To display data within a specified time range, you can use the standard time filter, custom time parameters, or a WHERE command.
The standard time filter is enabled when the indices you’re querying have a field named @timestamp.
If your indices do not have a field named @timestamp, you can use the ?_tstart and ?_tend parameters to specify a time range. These parameters work with any timestamp field and automatically sync with the time filter.
FROM my_index
| WHERE custom_timestamp >= ?_tstart AND custom_timestamp < ?_tend
You can also use the ?_tstart and ?_tend parameters with the BUCKET function to create auto-incrementing time buckets in ES|QL visualizations. For example:
FROM kibana_sample_data_logs
| STATS average_bytes = AVG(bytes) BY BUCKET(@timestamp, 50, ?_tstart, ?_tend)
This example uses 50 buckets, which is the maximum number of buckets.
You can also limit the time range using the WHERE command and the NOW function. For example, if the timestamp field is called timestamp, to query the last 15 minutes of data:
FROM kibana_sample_data_logs
| WHERE timestamp > NOW() - 15minutes
ES|QL variables help you add interactive controls to your queries and make them more dynamic.
They're available for:
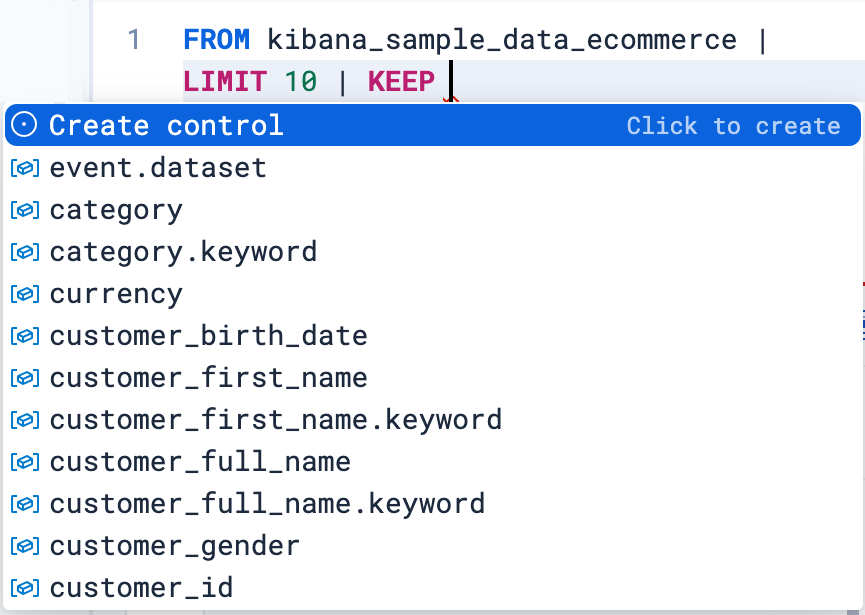
While you edit your ES|QL query, the autocomplete menu suggests adding a control when relevant or when you type
?in the query. Select Create control.
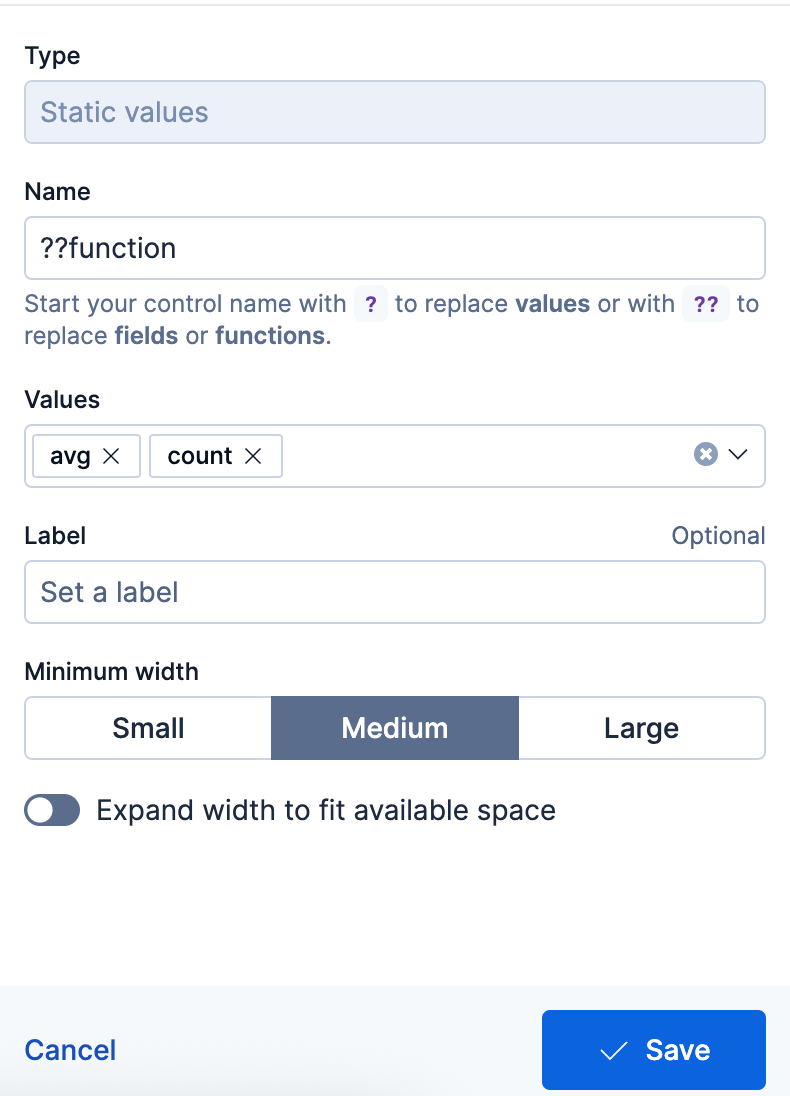
A menu opens to let you configure the control. This is where you can specify:
- The type of the control.
- For controls with Static values, enter available controls manually or select them from the dropdown list.
- For controls with Values from a query, write an ES|QL query to populate the list of options. This option is useful for dynamically retrieving control values or perform advanced actions such as defining chaining controls.
Tip - Only display values available for the selected time range
By linking the control to the global time range, the control only shows values that exist within the time range selected in the dashboard or Discover session. You can do that by specifying
WHERE @timestamp <= ?_tend AND @timestamp > ?_tstartin the control's query, or custom time parameters if your indices don't have a@timestampfield.
- The name of the control. You use this name to reference the control in ES|QL queries.
- Start the name with
?if you want the options to be simple static values. -
Start the name with ??if you want the options to be fields or functions.
- Start the name with
- The values users can select for this control. You can add multiple values from suggested fields, or type in custom values. If you selected Values from a query, you must instead write an ES|QL query at this step.
- The label of the control. This is the label displayed in Discover or in the dashboard.
- The width of the control.
- Whether the control should allow selecting a single value or multiple values. This requires using the
MV_CONTAINSfunction in your query.

- The type of the control.
Save the control.
The variable is inserted into your query, and the control appears.
Examples
Integrate filtering into your ES|QL experience
| WHERE field == ?valueFields in controls for dynamic group by
| STATS count=COUNT(*) BY ??fieldVariable time ranges? Bind function configuration settings to a control
| BUCKET(@timestamp, ?interval),Make the function itself dynamic
| STATS metric = ??function
You can create controls that let users select multiple values. To do that:
Add the
MV_CONTAINSfunction to your query, and create a variable as one of its parameters. For example:FROM logs-* | WHERE MV_CONTAINS(?values, field)NoteMulti-selection is only available for
?valuesvariables. It is not available for??fieldsand??functionsvariables.When defining the control, select the Allow multiple selections option.
Save the control.
The newly configured control becomes available and allows users to select multiple values.
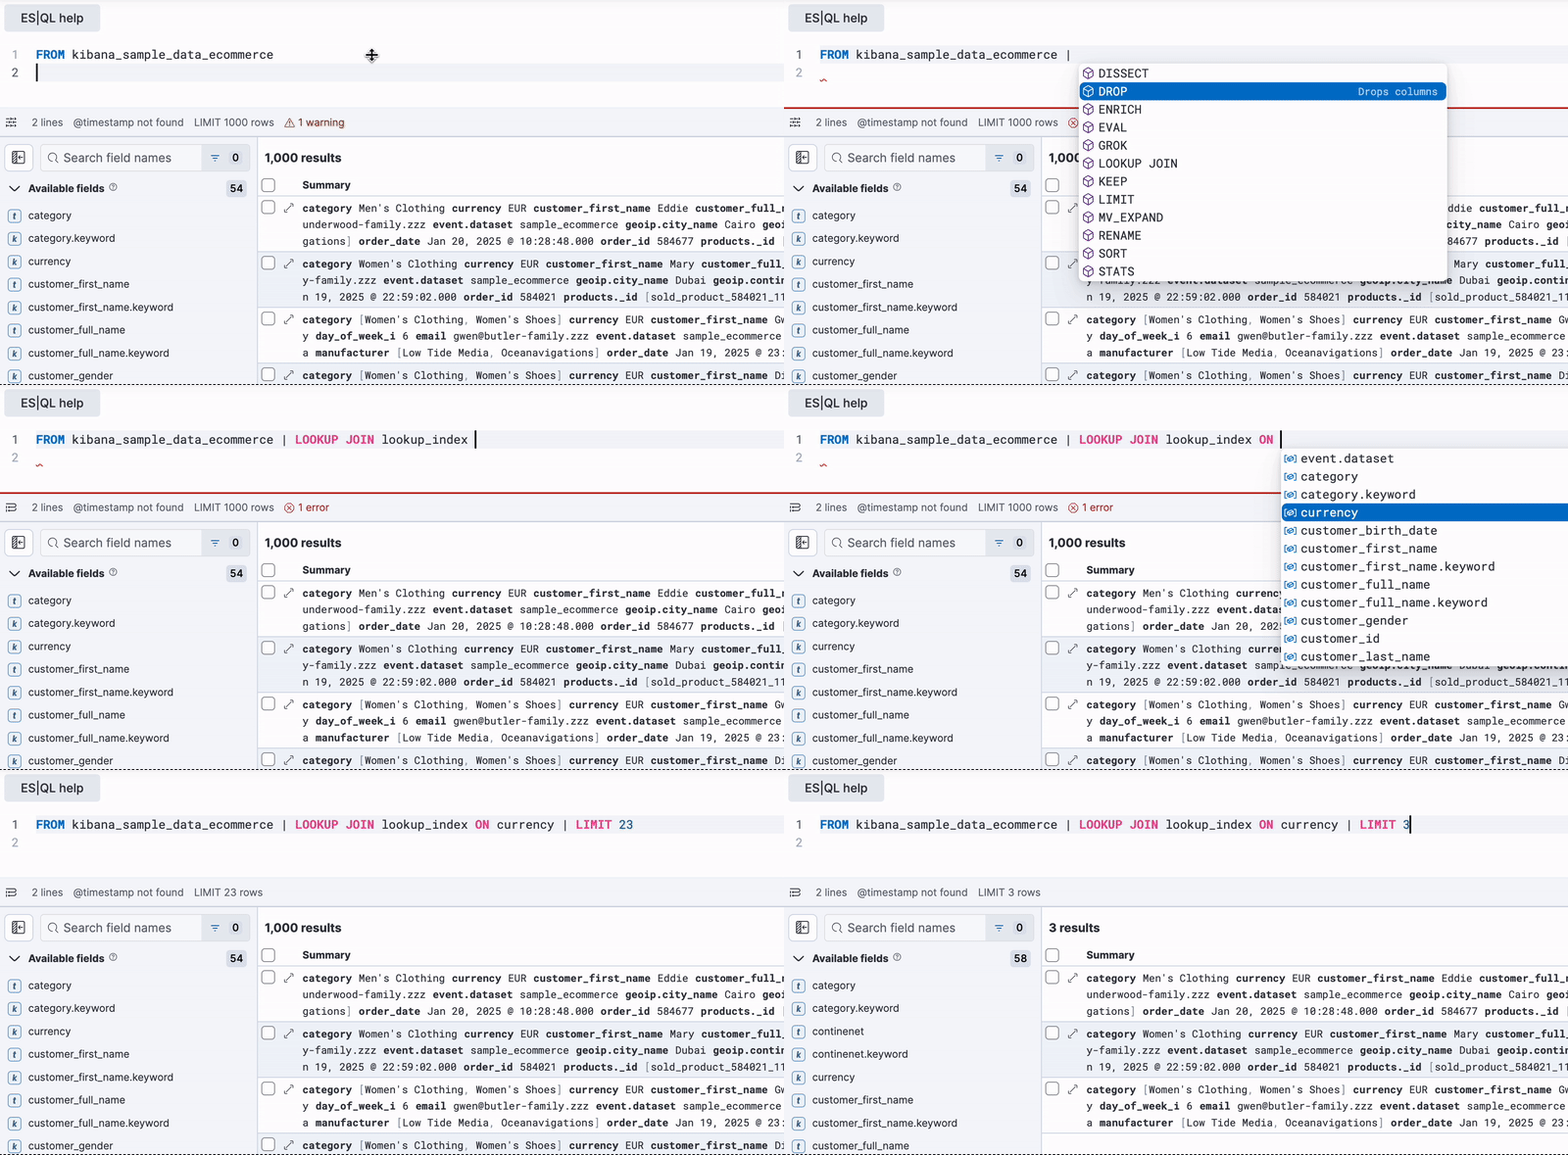
The ES|QL editor supports LOOKUP JOIN commands and suggests lookup mode indices and join condition fields.

In Discover, LOOKUP JOIN commands let you create or edit lookup indices directly from the editor. Find more information in Using ES|QL > Create and edit lookup indices from queries.
The ES|QL editor supports several shortcuts to help you write and run your queries faster:
| Mac | Windows/Linux | Description |
|---|---|---|
Cmd + Enter |
Ctrl + Enter |
Run a query |
Cmd + / |
Ctrl + / |
Comment or uncomment a line |
You can find the list of shortcuts directly from the editor. Look for the 
Between the query bar and the results table, Discover shows a date histogram visualization. By default, if the indices you’re querying do not contain a @timestamp field, the histogram is not shown. But you can use a custom time field with the ?_tstart and ?_tend parameters to enable it.
The visualization adapts to the query. A query’s nature determines the type of visualization. For example, this query aggregates the total number of bytes per destination country:
FROM kibana_sample_data_logs
| STATS total_bytes = SUM(bytes) BY geo.dest
| SORT total_bytes DESC
| LIMIT 3
The resulting visualization is a bar chart showing the top 3 countries:

To make changes to the visualization, like changing the visualization type, axes and colors, click the pencil button (). This opens an in-line editor:

You can save the visualization to a new or existing dashboard by clicking the save button (). Once saved to a dashboard, you’ll be taken to the Dashboards page. You can continue to make changes to the visualization. Click the options button in the top-right (
) and select Edit ES|QL visualization to open the in-line editor:

You can use ES|QL queries to create panels on your dashboards. To add a panel to a dashboard, under Dashboards, click the Add panel button and select ES|QL.
Check the ES|QL query by clicking the Panel filters button ( ):
):

You can also edit the ES|QL visualization from here. Click the options button in the top-right () and select Edit ESQL visualization to open the in-line editor.

You can also Add dashboard controls from your ES|QL visualization's query
The ES|QL ENRICH command enables you to enrich your query dataset with fields from another dataset. Before you can use ENRICH, you need to create and execute an enrich policy. If a policy exists, it will be suggested by autocomplete. If not, click Click to create to create one.

Next, you can enter a policy name, the policy type, source indices, and optionally a query:

Click Next to select the match field and enrich fields:

Finally, click Create and execute.
Now, you can use the enrich policy in an ES|QL query:
FROM kibana_sample_data_logs
| STATS total_bytes = SUM(bytes) BY geo.dest
| SORT total_bytes DESC
| LIMIT 3
| ENRICH countries
You can use ES|QL queries to create alerts. From Discover, click Alerts and select Create search threshold rule. This opens a panel that enables you to create a rule using an ES|QL query. Next, you can test the query, add a connector, and save the rule.

- The user interface to filter data is not enabled when Discover is in ES|QL mode. To filter data, write a query that uses the
WHEREcommand instead. - Discover shows no more than 10,000 rows. This limit only applies to the number of rows that are retrieved by the query and displayed in Discover. Queries and aggregations run on the full data set.
- Discover shows no more than 50 columns. If a query returns more than 50 columns, Discover only shows the first 50.
- CSV export from Discover shows no more than 10,000 rows. This limit only applies to the number of rows that are retrieved by the query and displayed in Discover. Queries and aggregations run on the full data set.
- Querying many indices at once without any filters can cause an error in kibana which looks like
[esql] > Unexpected error from Elasticsearch: The content length (536885793) is bigger than the maximum allowed string (536870888). The response from ES|QL is too long. UseDROPorKEEPto limit the number of fields returned.