What’s new in 8.15
editWhat’s new in 8.15
editHere are the highlights of what’s new and improved in 8.15. For detailed information about this release, check the release notes.
Previous versions: 8.14 | 8.13 | 8.12 | 8.11 | 8.10 | 8.9 | 8.8 | 8.7 | 8.6 | 8.5 | 8.4 | 8.3 | 8.2 | 8.1 | 8.0
ES|QL
editFilter UX improvements in ES|QL
editWe’re thrilled to unveil a complete overhaul of filtering in the ES|QL UX. Now, you can seamlessly filter data by browsing a time series chart, allowing for quick and intuitive time-based filtering. Interactive chart filtering lets you refine your data directly by clicking on any chart, while creating WHERE clause filters from the Discover table or sidebar has never been easier. These enhancements streamline data exploration and analysis, making your ES|QL experience more efficient and user-friendly than ever.
Filter by clicking a chart:
Filter by browsing a time series chart:
Create WHERE clause filters from Discover table or sidebar:
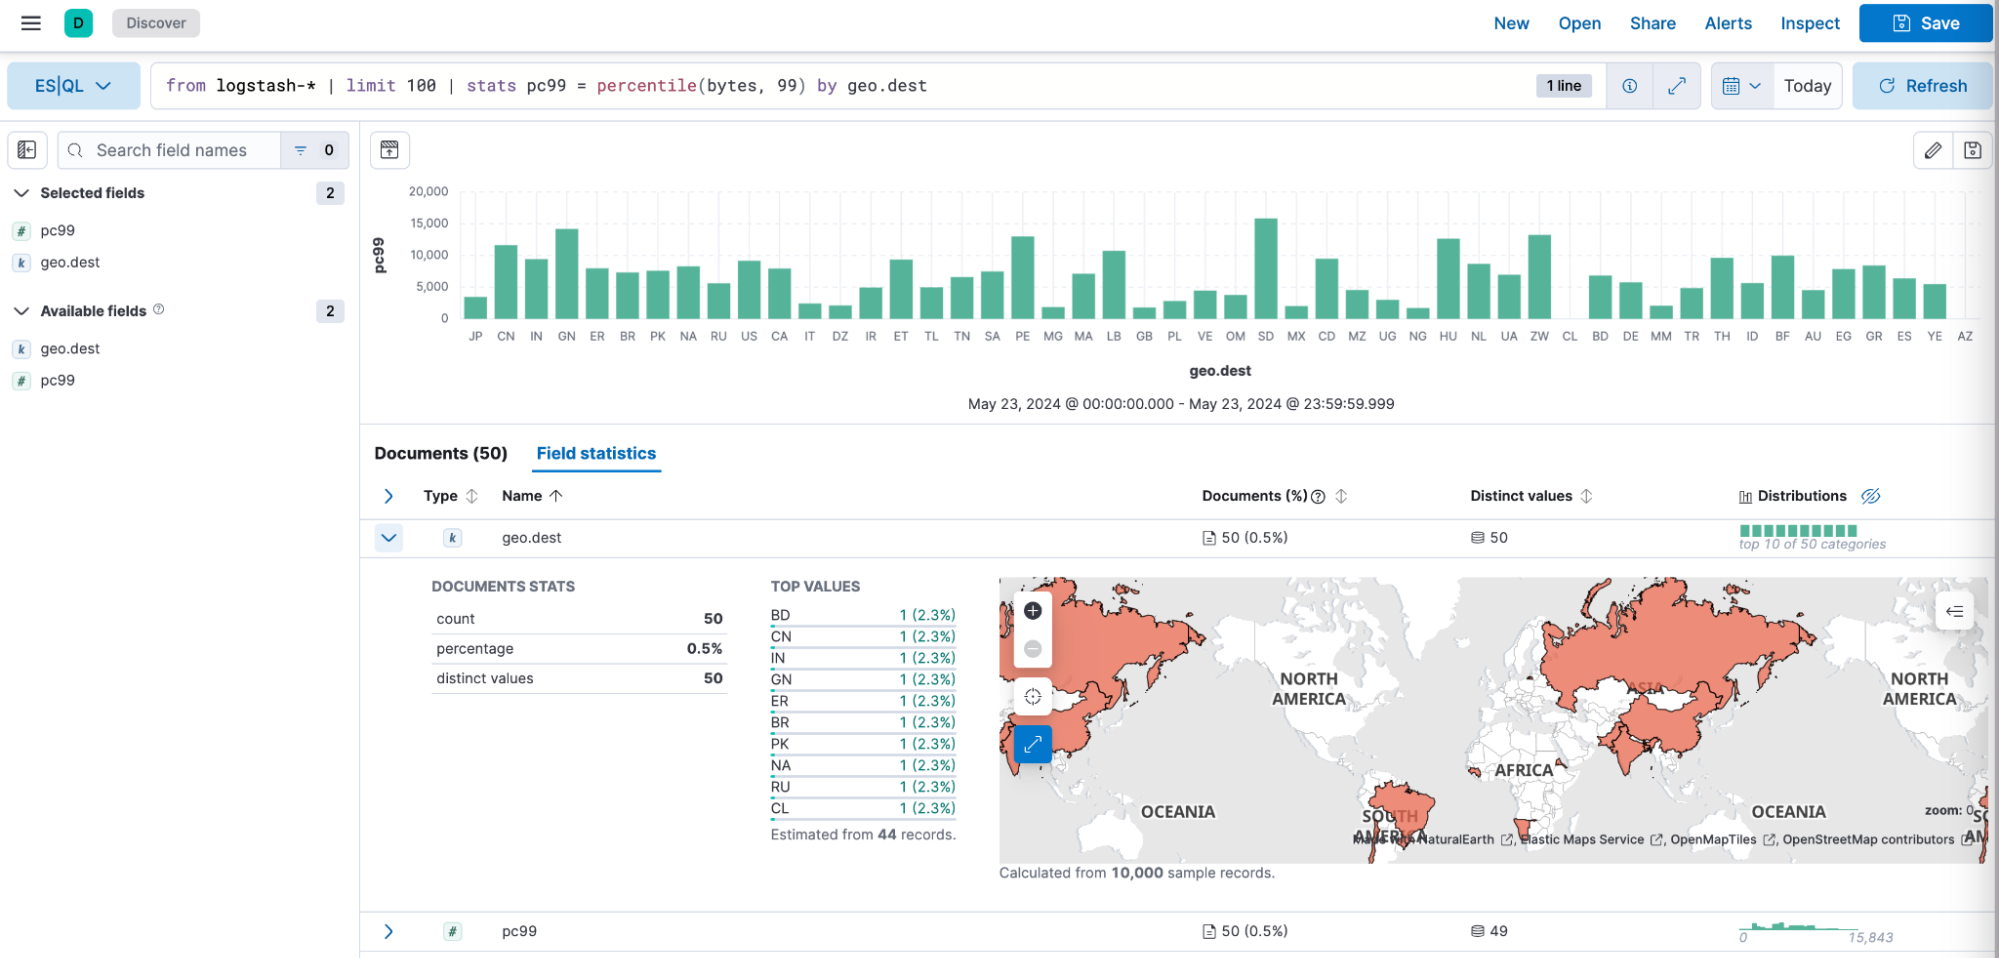
Field statistics in ES|QL
editField statistics are now available in ES|QL. This feature is designed to provide comprehensive insights for each data field. With this enhancement, you can access detailed statistics such as distributions, averages, and other key metrics, helping you quickly understand your data. This makes data exploration and quality assessment more efficient, providing deeper insights and streamlining the analysis of field-level data in ES|QL.
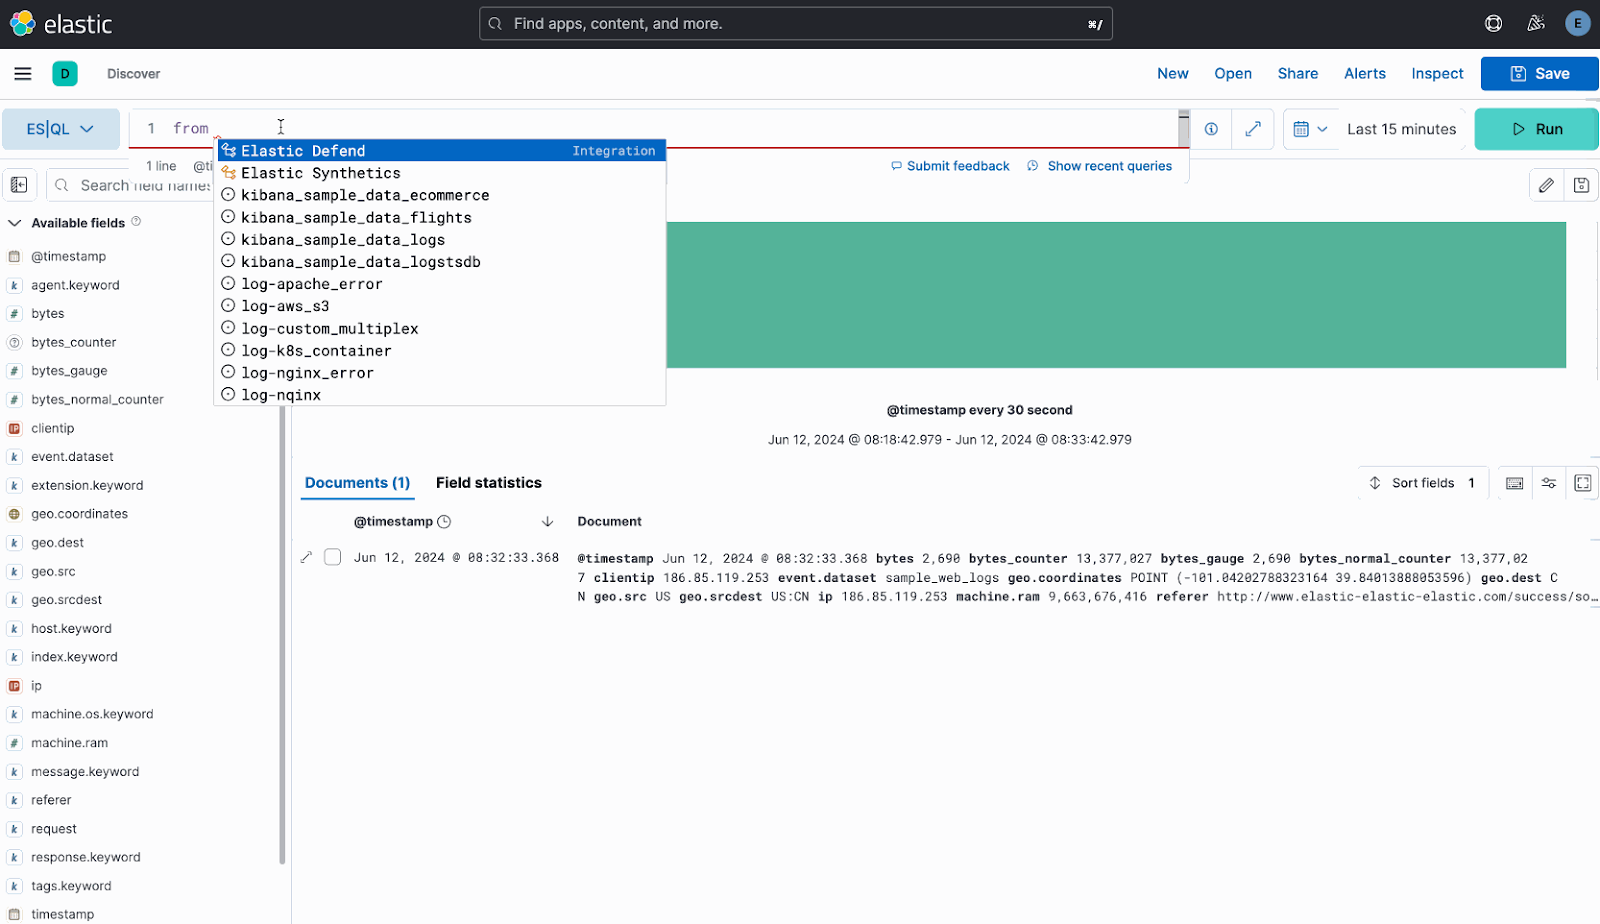
Integrations support in the ES|QL editor when using FROM command.
editWe’re excited to announce enhanced support for integrations in the ES|QL editor with the FROM command. Previously, you could only access indices, but now you can also view a list of installed integrations directly within the editor. This improvement streamlines your workflow, making it easier to manage and utilize various integrations while working with your data.
Dashboards
editField statistics in Dashboards
editIt’s now easier than ever to include your field statistics view from Discover into Dashboards. While running investigations, it is very common that you need to see some field information, such as unique values and their distribution, to make sense of the data. Select the fields that you want with your ES|QL query and get the document count, values, and distribution in your dashboard so you don’t have to navigate back and forth to Discover to see this information.
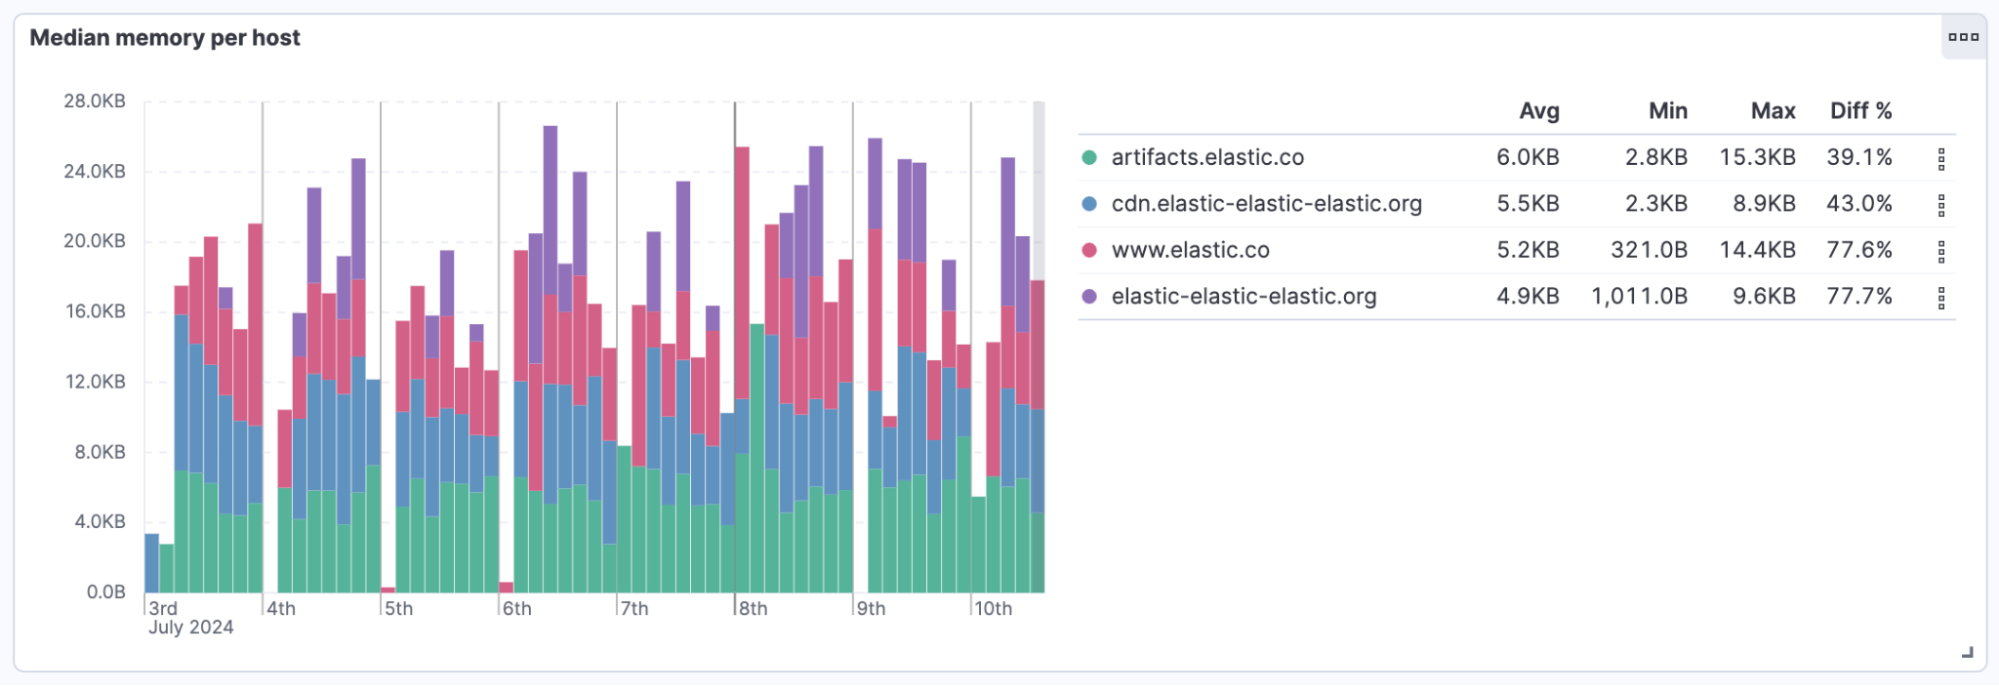
Statistics in legends
editAccelerate time to insights by summarizing the values of your charts using average, minimum, maximum, median, and variance, among many others. You can add these statistics for Lens and ES|QL visualizations. It is important to note that these statistics are computed using the data points from the chart considering the aggregation used and not the raw data. In the following example, the chart shows the median memory per host, so the Max = 15.3KB for the first series (artifacts.elastic.co) is the maximum value of the median memory per host.
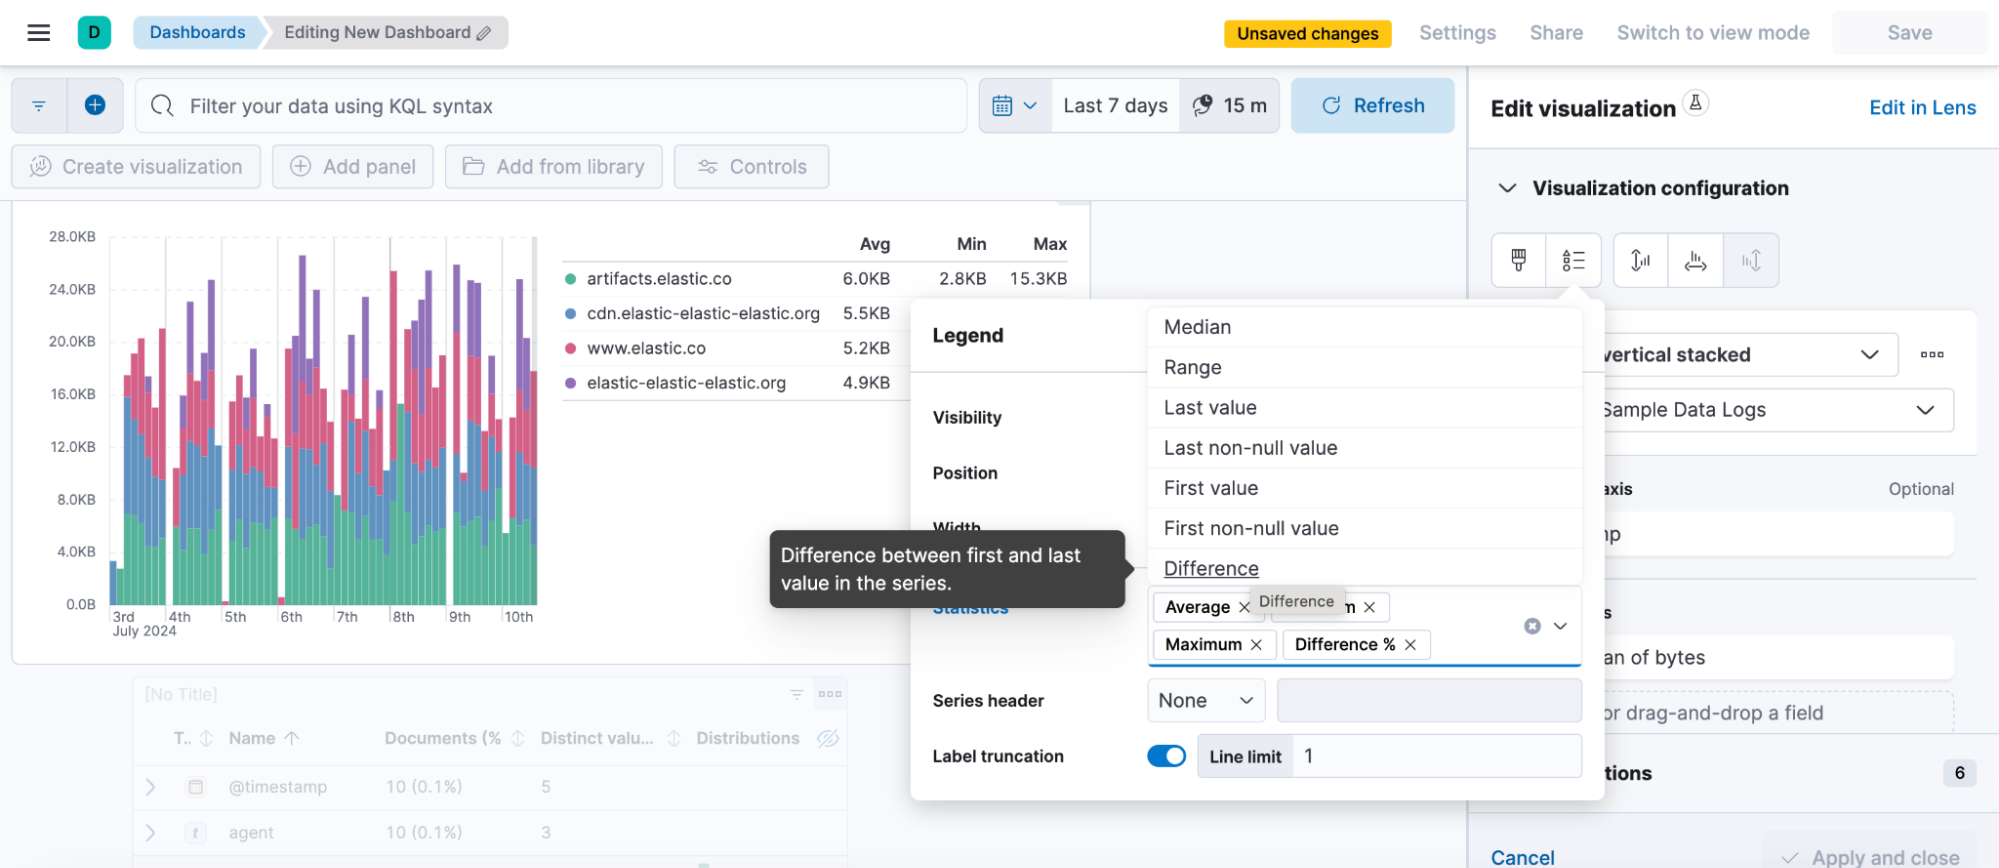
You can find the option to select statistics for your legends along with an explanation for each calculation when editing your visualization, as shown in the following image.
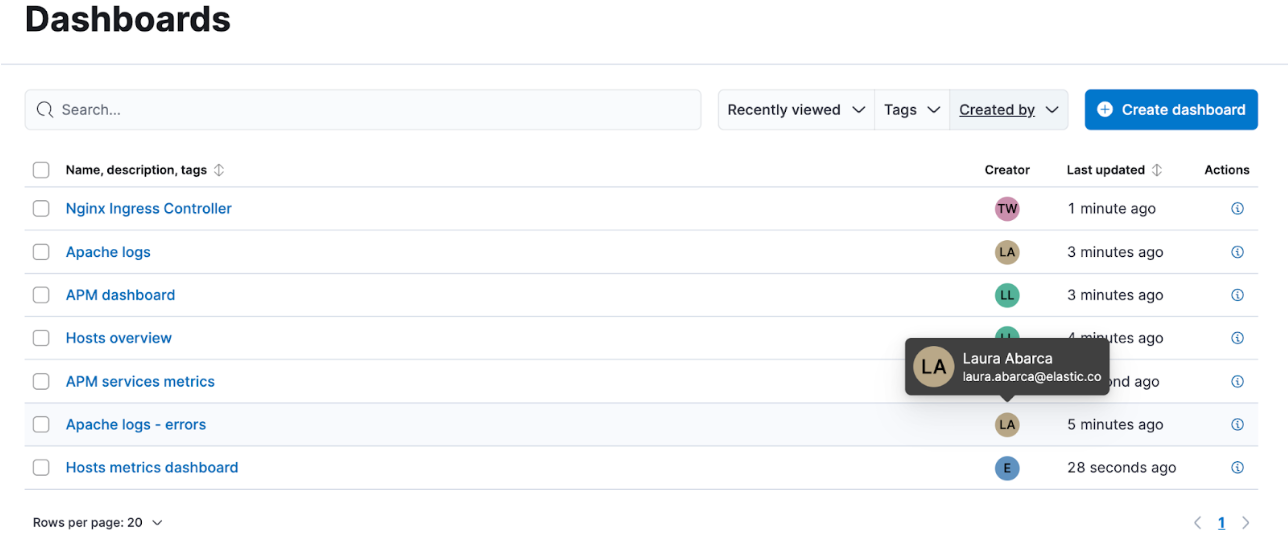
View dashboard creator and last editor
editYou can now see who created and who last updated a dashboard.
You can find the creator information right from the dashboard list.
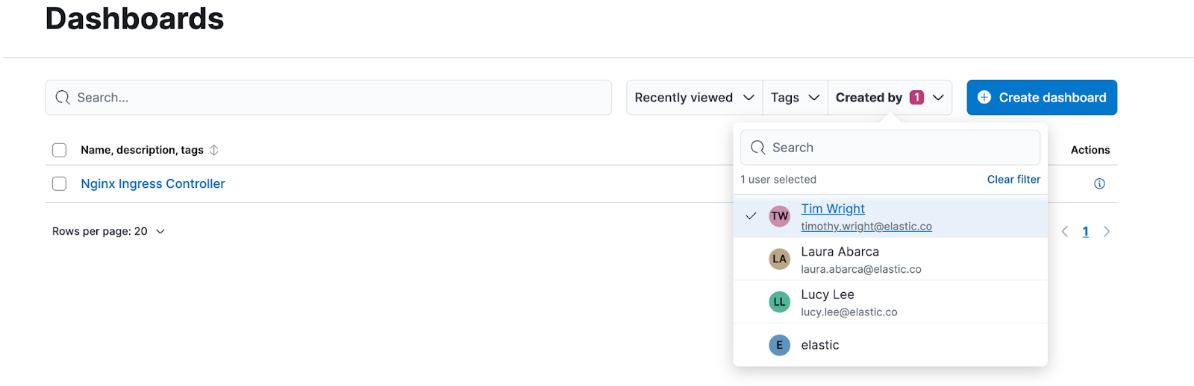
Quickly find all dashboards created by the same user with a simple filter.
Note that the creator information will be visible only for dashboards created on or after version 8.14.
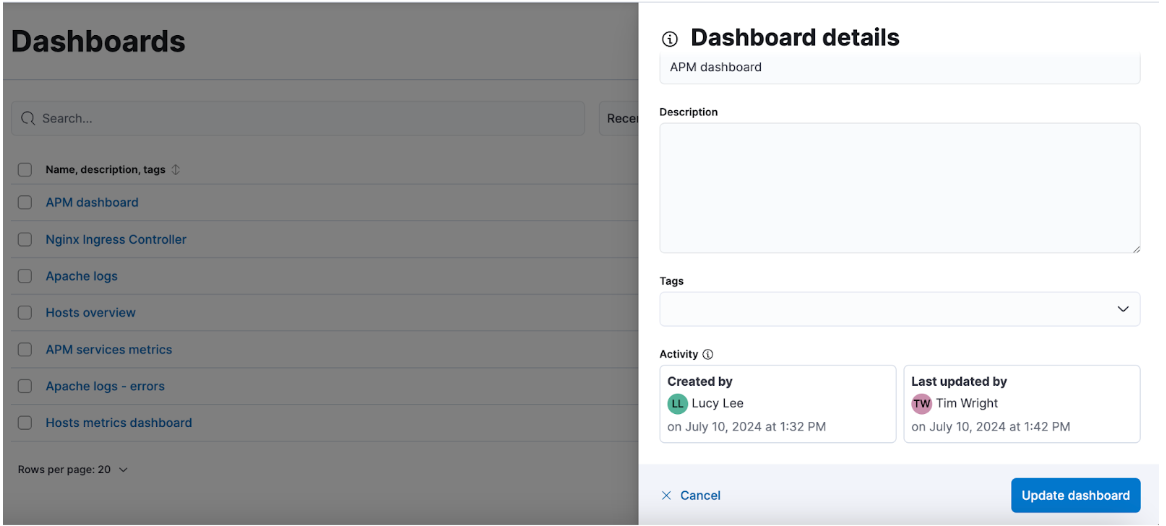
You can also see who last updated a dashboard by clicking the dashboard information icon from the dashboard list. The creator is also visible next to it. This information is immutable and cannot be changed.
Discover
editPush flyout for Discover document viewer
editYou can now seamlessly view document details and the main table simultaneously in Discover with the new push flyout. You can adjust the width of the flyout to suit your needs and explore your data much more easily.
Alerting, cases, and connectors
editCase templates
editKibana cases offer a new powerful capability to enhance the efficiency of your analyst teams with templates. You can manage multiple templates, each of which can be used to auto-populate values in a case with pre-defined knowledge. This streamlines the investigative process and significantly reduces time to resolution.
Case custom fields are GA
editIn 8.11, custom fields were added to cases and they are now moving from technical preview to general availability. You can set custom field values in your templates to enhance consistency across cases.
ServiceNow additional fields
editYou can now create enriched ServiceNow tickets based on detected alerts with a more comprehensive structure that matches the ServiceNow ticket scheme. A new JSON field is now available as part of the ServiceNow action, which enables you to send any field from Kibana alerts to ServiceNow tickets.
Webhook - Case Management SSL auth support
editIt’s common for organizations to integrate with third parties using secured authentication. Currently, most of the available case connectors use basic authentication (user and passwords or tokens), which might not be sufficient to meet organization security policies. With this release, the Webhook - Case Management connector now supports client certification, which enables you to leverage the connector for secured integration with third parties.
The Webhook - Case Management connector also moves from technical preview to general availability in this release.
Machine Learning
editImproved UX for Log Pattern Analysis in Discover
editAnalyze large volumes of logs efficiently, in very short times with Log Pattern Analysis in Discover. In 8.15, we redesigned the Log Pattern Analysis user flow in Discover to make it easier to use. Discover log patterns with one click for the message field (and other applicable text fields) and easily filter in and out logs to drastically reduce MTTR.
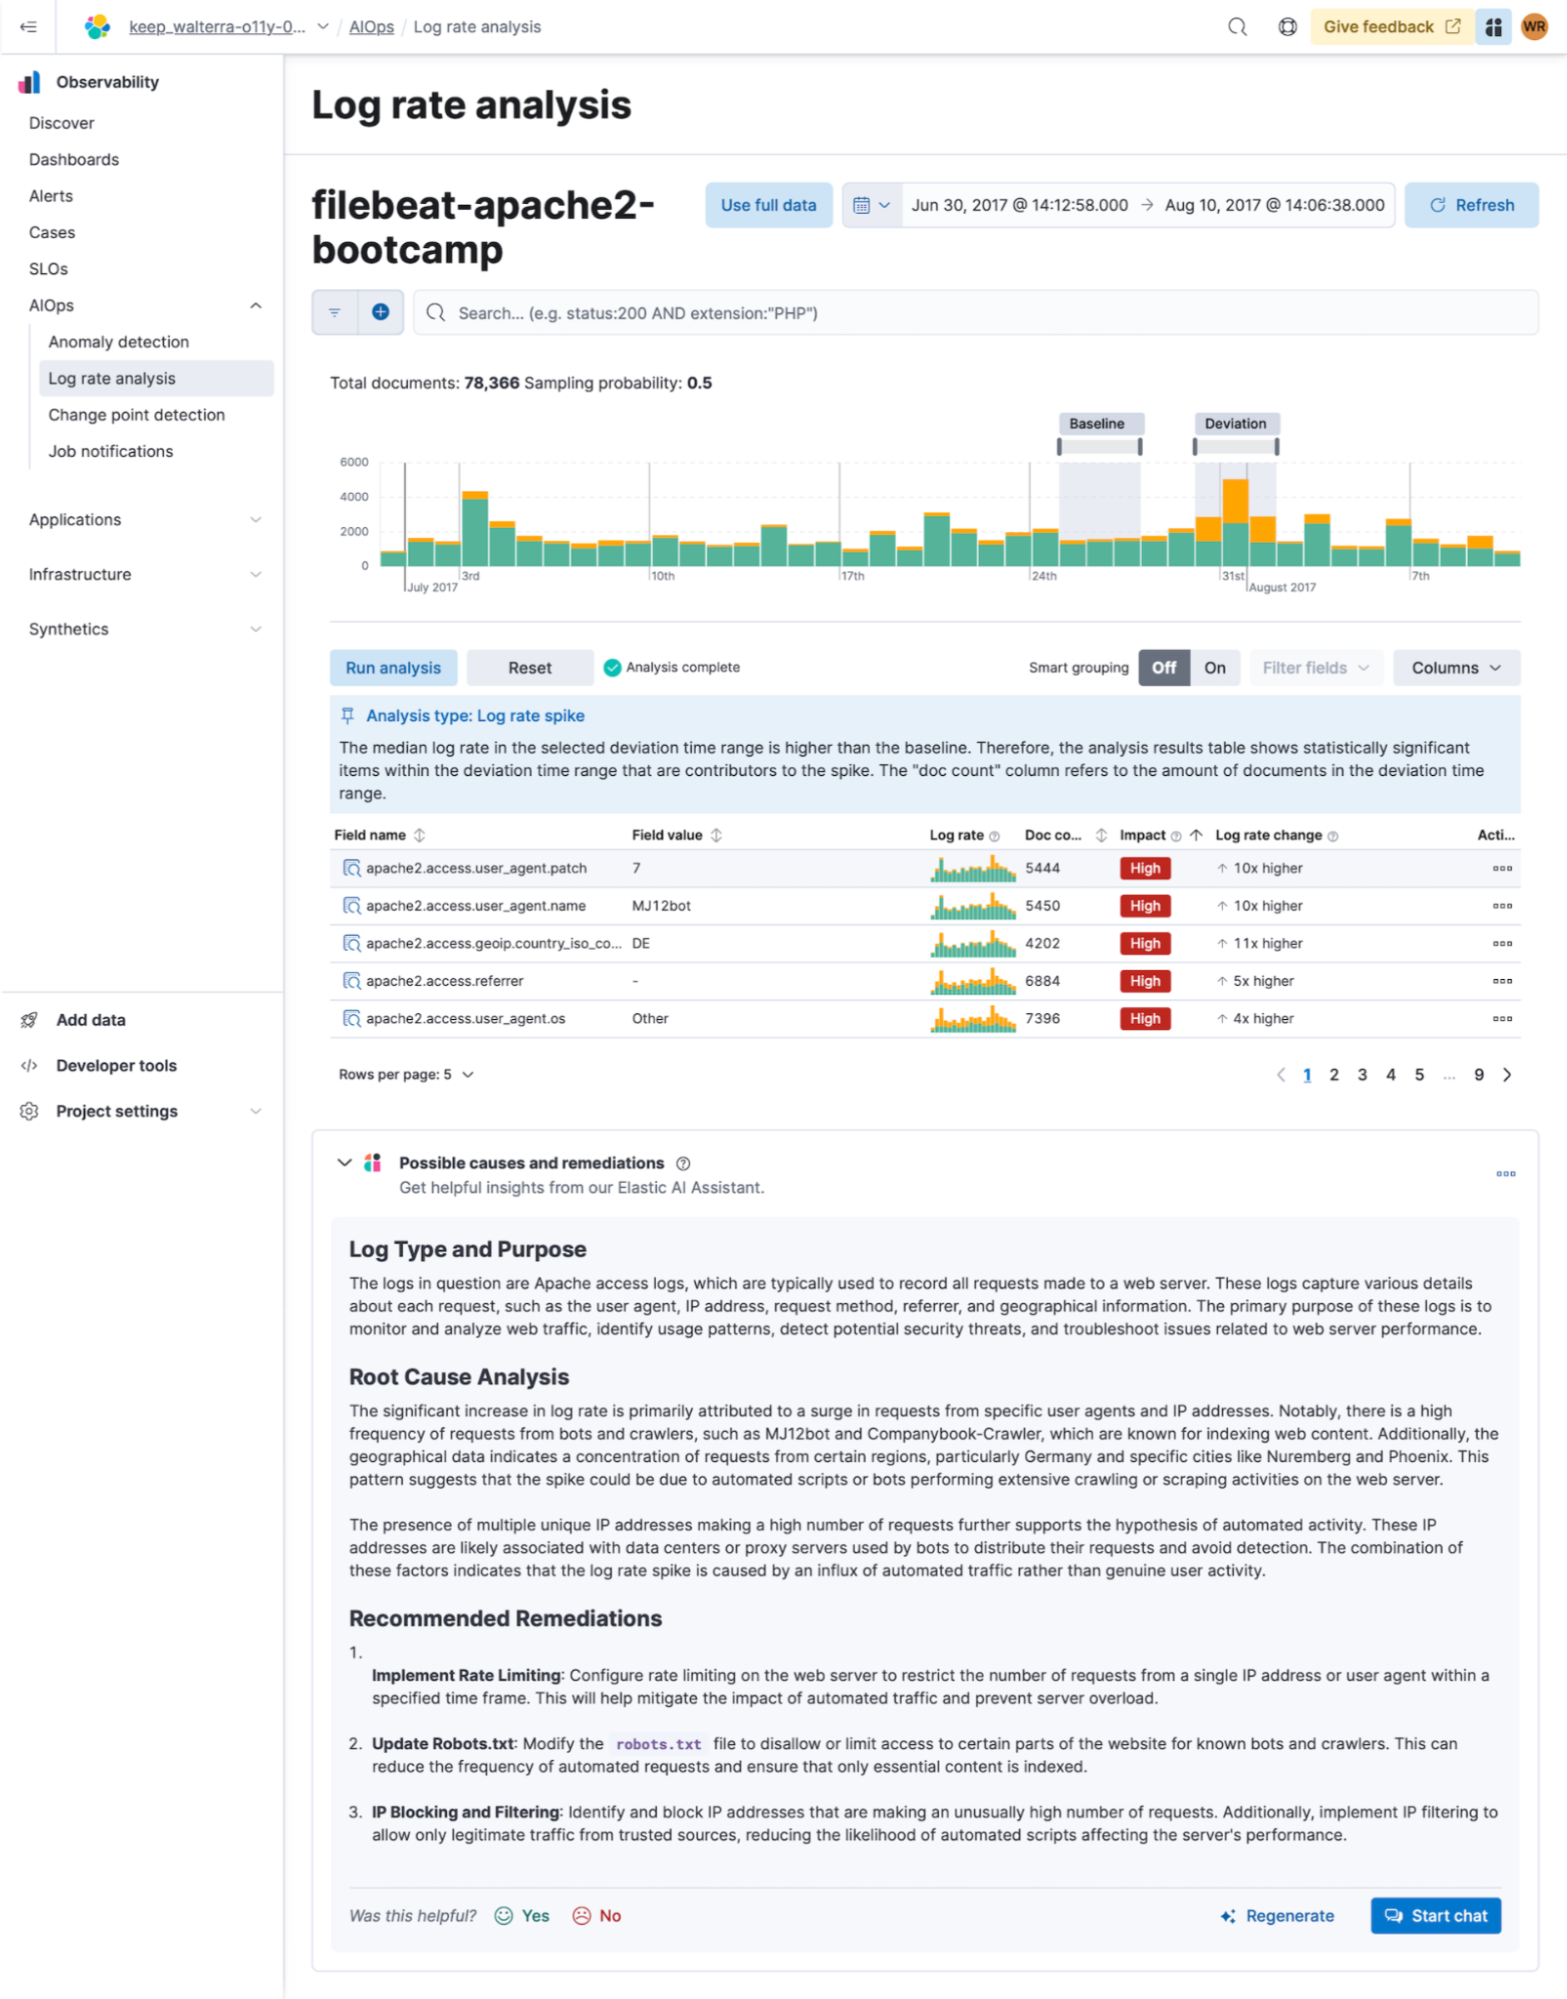
Log Rate Analysis contextual insights in serverless Observability
editYou can now see insights in natural language, for example for the root cause of a log rate change or threshold alert, in Log Rate Analysis. This feature is currently only available for Observability serverless projects.
Inference API improvements
editThe inference API provides a seamless, intuitive interface to perform inference and other tasks against proprietary, hosted, and integrated external services. In 8.15, we’re extending it with the following capabilities:
- Support for Anthropic’s chat completion API.
- Ability to host cross encoder models and perform the reranking task.
Managing Kibana users and objects
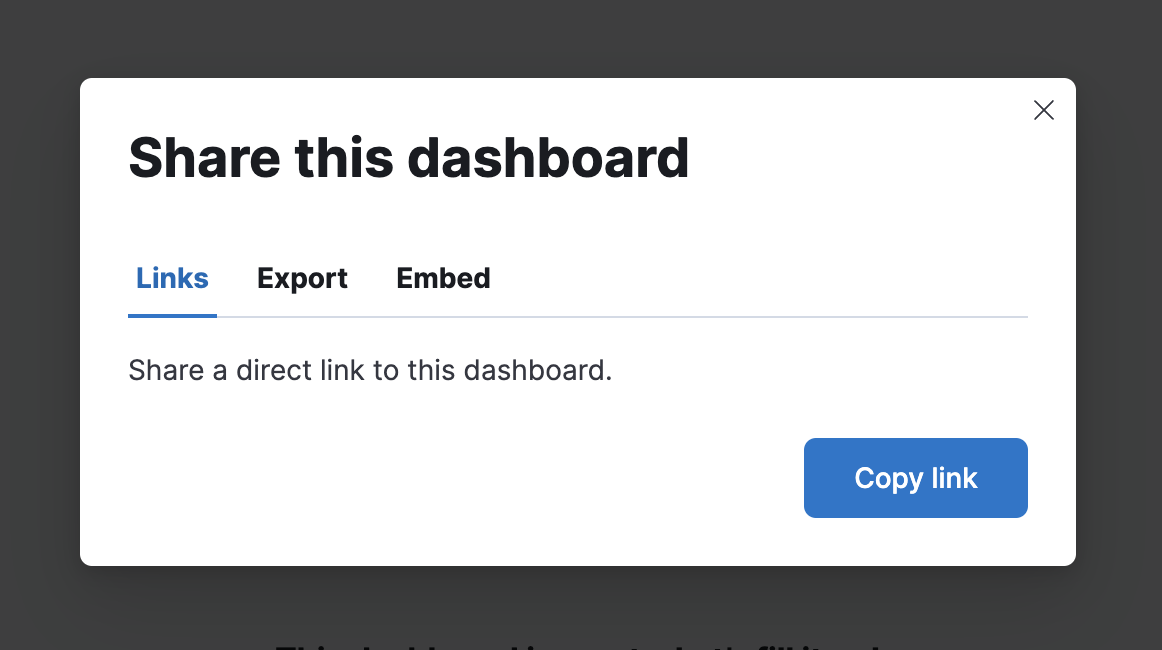
editSharing improvements
editYou can now share a dashboard, search, or Lens object in one click. When sharing an object, the most common actions are directly presented to you, and a short link is automatically generated, making it simpler than ever to share your work.
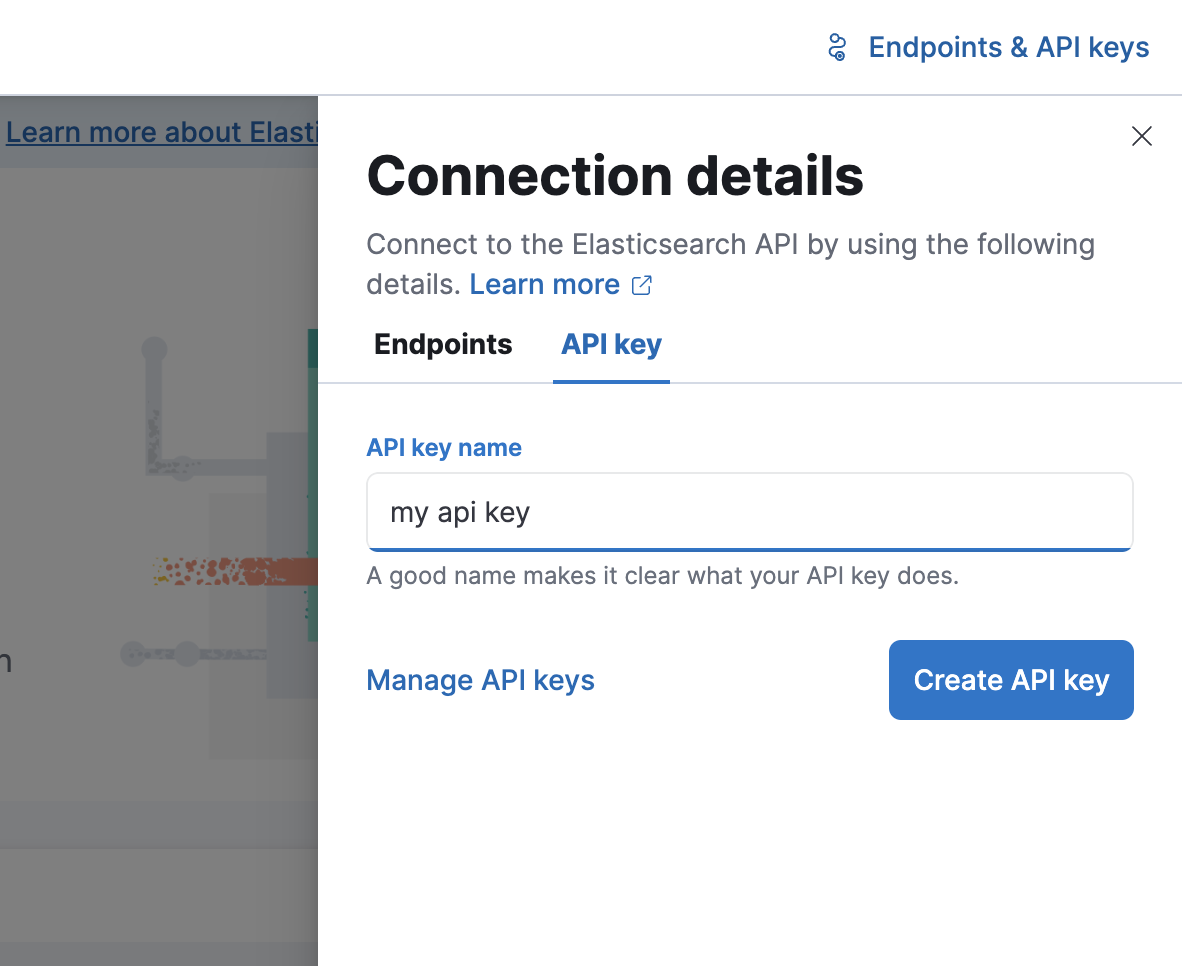
Quick API key creation
editMany API keys don’t require custom settings, so we made it simple to generate a standard key. From the Endpoints & API keys top menu in Search, you can create a key in seconds.
Filtering by User in Kibana Audit Logs
editWe are pleased to share that ignoring events by user in Kibana audit logs is now possible. This enhancement will give you more flexibility to reduce the overall number of events logged by the Kibana audit logs service and to control the volume of data being generated in audit logs. While we currently offer a number of ways to do this using the xpack.security.audit.ignore_filters.[] configuration setting, there wasn’t an easy option to filter by user. With this addition, you can configure Kibana audit logs to ignore events based on values from the following fields: users, spaces, outcomes, categories, types and actions.