Use OpenTelemetry with APM
editUse OpenTelemetry with APM
editFor a complete overview of using OpenTelemetry with Elastic, explore Elastic Distributions of OpenTelemetry.
OpenTelemetry is a set of APIs, SDKs, tooling, and integrations that enable the capture and management of telemetry data from your services and applications.
Elastic integrates with OpenTelemetry, allowing you to reuse your existing instrumentation to easily send observability data to the Elastic Stack. There are several ways to integrate OpenTelemetry with the Elastic Stack:
Elastic Distributions of OpenTelemetry language SDKs
editSome Elastic Distributions of OpenTelemetry are not yet recommended for production use. Functionality may be changed or removed in future releases. Alpha releases are not subject to the support SLA of official GA features.
Elastic offers several distributions of OpenTelemetry language SDKs. A distribution is a customized version of an upstream OpenTelemetry repository. Each Elastic Distribution of OpenTelemetry is a customized version of an OpenTelemetry language SDK.
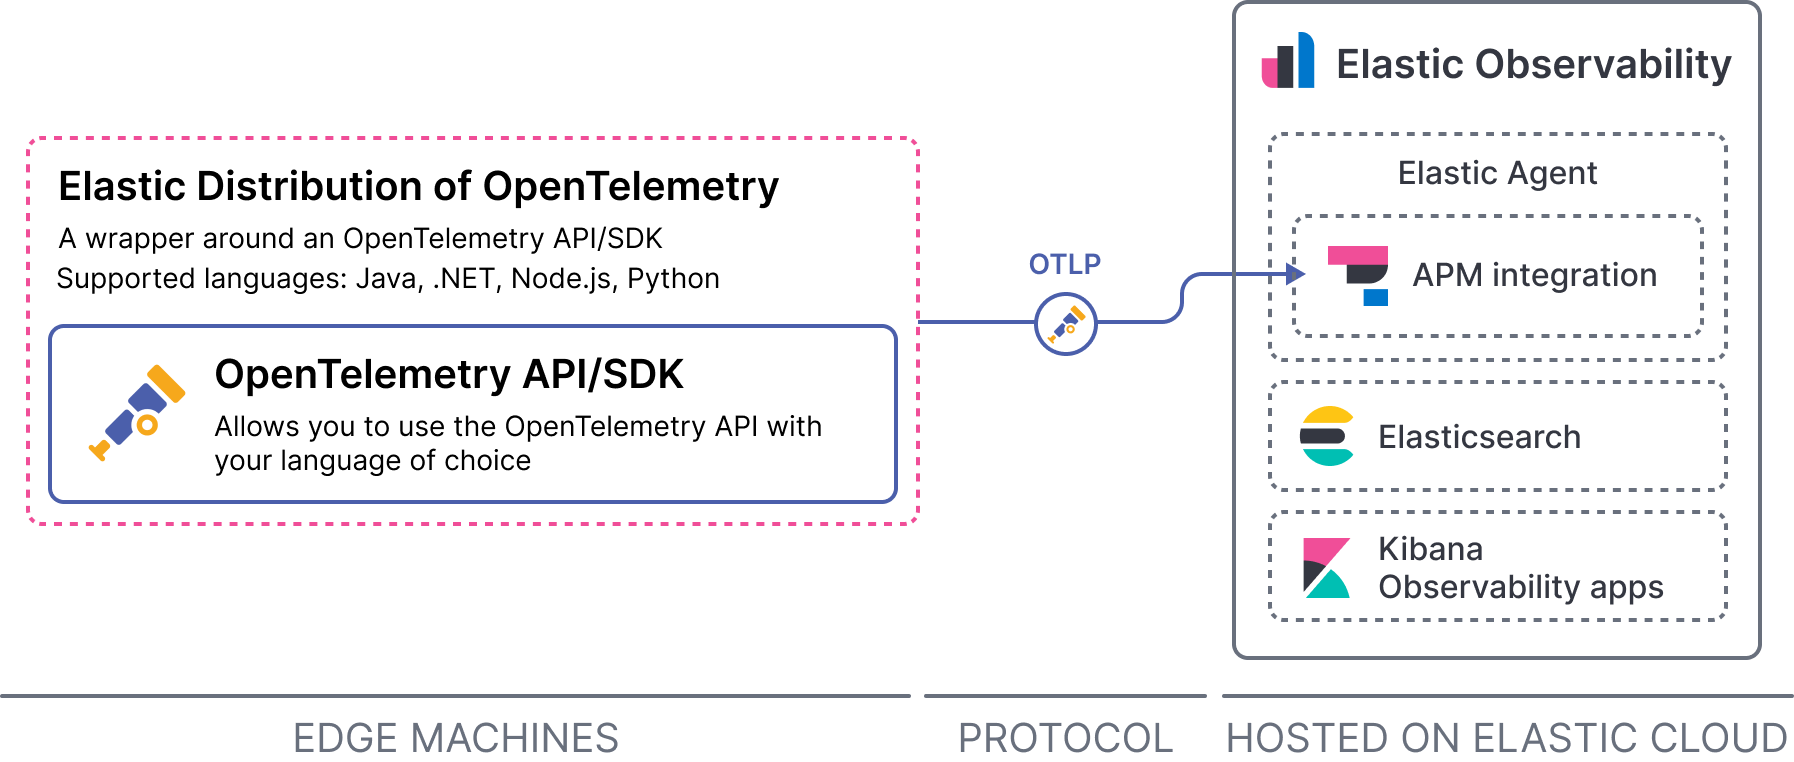
With an Elastic Distribution of OpenTelemetry language SDK you have access to all the features of the OpenTelemetry SDK that it customizes, plus:
- You may get access to SDK improvements and bug fixes contributed by the Elastic team before the changes are available upstream in the OpenTelemetry repositories.
- The distro preconfigures the collection of tracing and metrics signals, applying some opinionated defaults, such as which sources are collected by default.
Get started with an Elastic Distribution of OpenTelemetry language SDK:
- Elastic Distribution of OpenTelemetry Java →
- [preview] The Elastic Distribution of OpenTelemetry .NET is not yet recommended for production use. Functionality may be changed or removed in future releases. Alpha releases are not subject to the support SLA of official GA features. Elastic Distribution of OpenTelemetry .NET →
- [preview] The Elastic Distribution of OpenTelemetry Node.js is not yet recommended for production use. Functionality may be changed or removed in future releases. Alpha releases are not subject to the support SLA of official GA features. Elastic Distribution of OpenTelemetry Node.js →
- [preview] The Elastic Distribution of OpenTelemetry Python is not yet recommended for production use. Functionality may be changed or removed in future releases. Alpha releases are not subject to the support SLA of official GA features. Elastic Distribution of OpenTelemetry Python →
- [preview] The Elastic Distribution of OpenTelemetry PHP is not yet recommended for production use. Functionality may be changed or removed in future releases. Alpha releases are not subject to the support SLA of official GA features. Elastic Distribution of OpenTelemetry PHP →
For more details about OpenTelemetry distributions in general, visit the OpenTelemetry documentation.
Upstream OpenTelemetry API/SDK + Elastic APM agent
editUse the OpenTelemetry API/SDKs with Elastic APM agents to translate OpenTelemetry API calls to Elastic APM API calls.
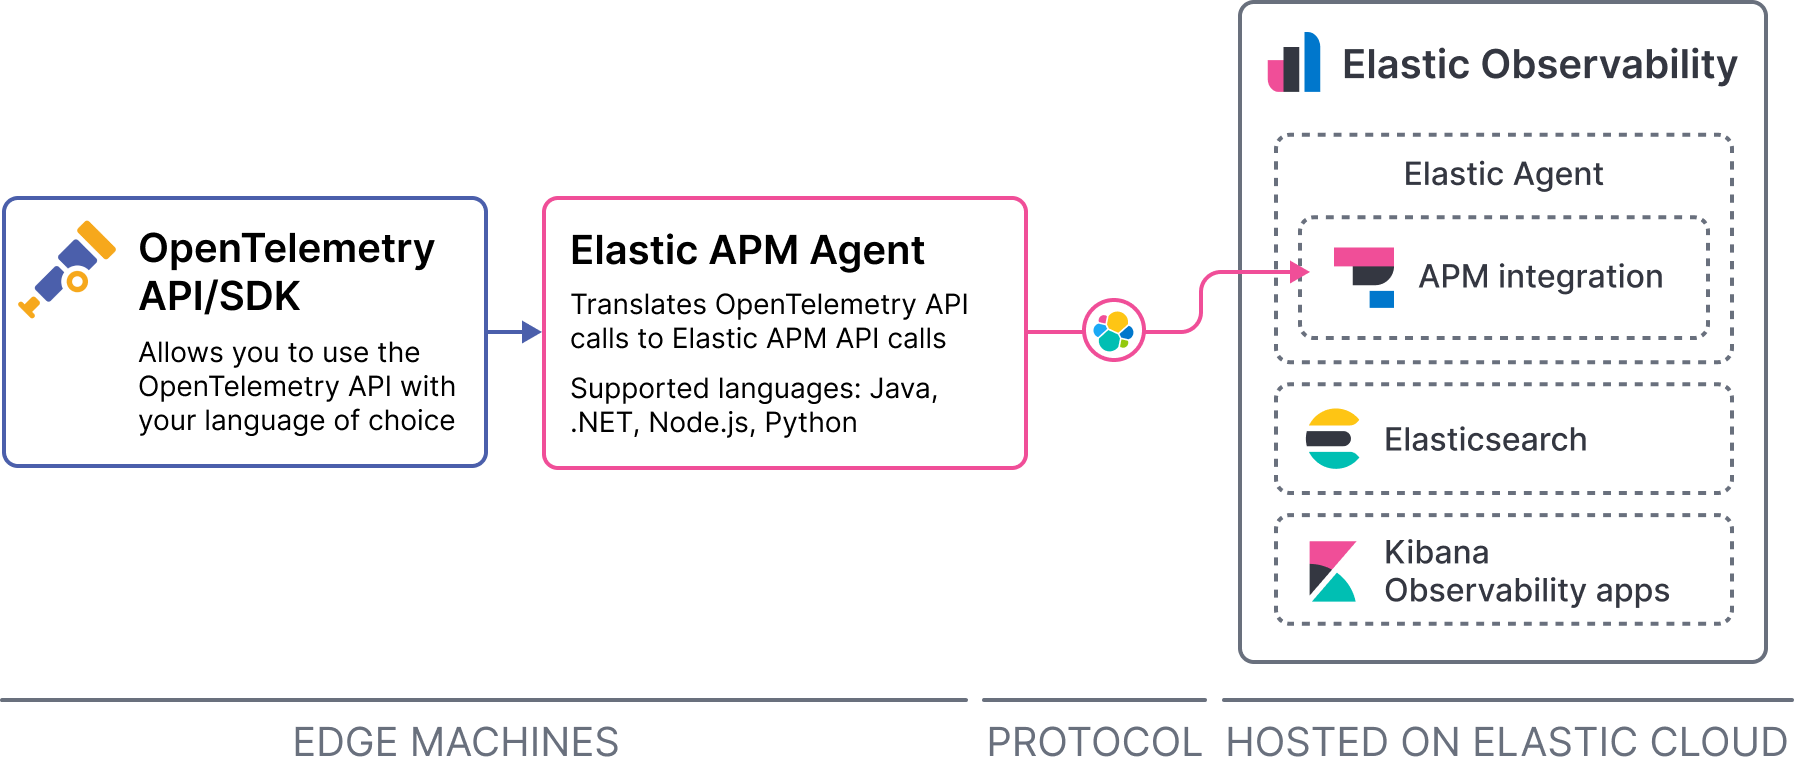
This allows you to reuse your existing OpenTelemetry instrumentation to create Elastic APM transactions and spans—avoiding vendor lock-in and having to redo manual instrumentation.
However, not all features of the OpenTelemetry API are supported when using this approach, and not all Elastic APM agents support this approach.
Find more details about how to use an OpenTelemetry API or SDK with an Elastic APM agent and which OpenTelemetry API features are supported in the APM agent documentation:
Upstream OpenTelemetry Collector and language SDKs
editThe Elastic Stack natively supports the OpenTelemetry protocol (OTLP). This means trace data and metrics collected from your applications and infrastructure by an OpenTelemetry Collector or OpenTelemetry language SDK can be sent to the Elastic Stack.
You can set up an OpenTelemetry Collector, instrument your application with an OpenTelemetry language SDK that sends data to the collector, and use the collector to process and export the data to APM Server.
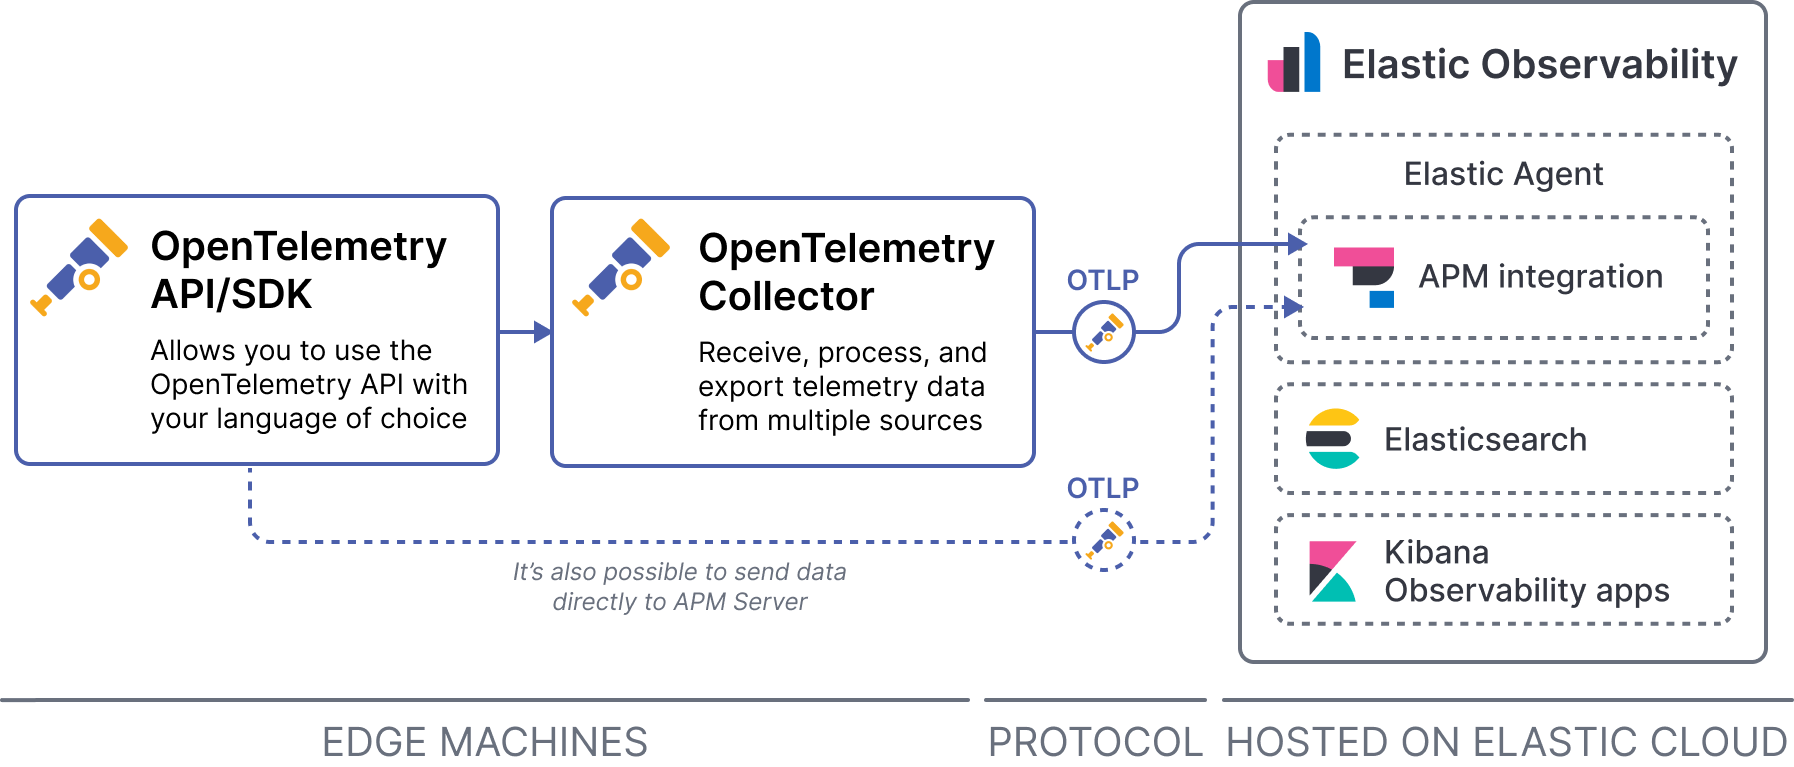
It’s also possible to send data directly to APM Server from an upstream OpenTelemetry SDK. You might do this during development or if you’re monitoring a small-scale application. Read more about when to use a collector in the OpenTelemetry documentation.
This approach works well when you need to instrument a technology that Elastic doesn’t provide a solution for. For example, if you want to instrument C or C++ you could use the OpenTelemetry C++ client.
However, there are some limitations when using collectors and language SDKs built and maintained by OpenTelemetry, including:
- Elastic can’t provide implementation support on how to use upstream OpenTelemetry tools.
- You won’t have access to Elastic enterprise APM features.
- You may experience problems with performance efficiency.
For more on the limitations associated with using upstream OpenTelemetry tools, refer to Limitations.
Get started with upstream OpenTelemetry Collectors and language SDKs →
AWS Lambda collector exporter
editAWS Lambda functions can be instrumented with OpenTelemetry and monitored with Elastic Observability.
To get started, follow the official AWS Distro for OpenTelemetry Lambda documentation, and configure the OpenTelemetry Collector to output traces and metrics to your Elastic cluster: