- Elastic Security: other versions:
- Elastic Security overview
- What’s new in 8.6
- Upgrade Elastic Security to 8.6.2
- Post-upgrade steps (optional)
- Get started with Elastic Security
- Elastic Security system requirements
- Spaces and Elastic Security
- Data views in Elastic Security
- Ingest data to Elastic Security
- Install and configure the Elastic Defend integration
- Install Elastic Endpoint manually
- Configure offline endpoints and air-gapped environments
- Configure an integration policy for Elastic Defend
- Enable threat intelligence integrations
- Configure advanced settings
- Uninstall an endpoint
- Elastic Security UI
- Dashboards
- Explore
- Anomaly detection with machine learning
- Detections and alerts
- Create a detection rule
- Manage detection rules
- Monitor and troubleshoot rule executions
- Rule exceptions
- About building block rules
- Manage detection alerts
- Visual event analyzer
- Query alert indices
- Tune detection rules
- Prebuilt rule changes per release
- Prebuilt rule reference
- A scheduled task was created
- A scheduled task was updated
- AWS CloudTrail Log Created
- AWS CloudTrail Log Deleted
- AWS CloudTrail Log Suspended
- AWS CloudTrail Log Updated
- AWS CloudWatch Alarm Deletion
- AWS CloudWatch Log Group Deletion
- AWS CloudWatch Log Stream Deletion
- AWS Config Resource Deletion
- AWS Configuration Recorder Stopped
- AWS Deletion of RDS Instance or Cluster
- AWS EC2 Encryption Disabled
- AWS EC2 Full Network Packet Capture Detected
- AWS EC2 Network Access Control List Creation
- AWS EC2 Network Access Control List Deletion
- AWS EC2 Snapshot Activity
- AWS EC2 VM Export Failure
- AWS EFS File System or Mount Deleted
- AWS ElastiCache Security Group Created
- AWS ElastiCache Security Group Modified or Deleted
- AWS EventBridge Rule Disabled or Deleted
- AWS Execution via System Manager
- AWS GuardDuty Detector Deletion
- AWS IAM Assume Role Policy Update
- AWS IAM Brute Force of Assume Role Policy
- AWS IAM Deactivation of MFA Device
- AWS IAM Group Creation
- AWS IAM Group Deletion
- AWS IAM Password Recovery Requested
- AWS IAM User Addition to Group
- AWS KMS Customer Managed Key Disabled or Scheduled for Deletion
- AWS Management Console Brute Force of Root User Identity
- AWS Management Console Root Login
- AWS RDS Cluster Creation
- AWS RDS Instance Creation
- AWS RDS Instance/Cluster Stoppage
- AWS RDS Security Group Creation
- AWS RDS Security Group Deletion
- AWS RDS Snapshot Export
- AWS RDS Snapshot Restored
- AWS Redshift Cluster Creation
- AWS Root Login Without MFA
- AWS Route 53 Domain Transfer Lock Disabled
- AWS Route 53 Domain Transferred to Another Account
- AWS Route Table Created
- AWS Route Table Modified or Deleted
- AWS Route53 private hosted zone associated with a VPC
- AWS S3 Bucket Configuration Deletion
- AWS SAML Activity
- AWS STS GetSessionToken Abuse
- AWS Security Group Configuration Change Detection
- AWS Security Token Service (STS) AssumeRole Usage
- AWS VPC Flow Logs Deletion
- AWS WAF Access Control List Deletion
- AWS WAF Rule or Rule Group Deletion
- Abnormal Process ID or Lock File Created
- Abnormally Large DNS Response
- Accepted Default Telnet Port Connection
- Access of Stored Browser Credentials
- Access to Keychain Credentials Directories
- Access to a Sensitive LDAP Attribute
- Account Configured with Never-Expiring Password
- Account Discovery Command via SYSTEM Account
- Account Password Reset Remotely
- Account or Group Discovery via Built-In Tools
- AdFind Command Activity
- Adding Hidden File Attribute via Attrib
- AdminSDHolder Backdoor
- AdminSDHolder SDProp Exclusion Added
- Administrator Privileges Assigned to an Okta Group
- Administrator Role Assigned to an Okta User
- Adobe Hijack Persistence
- Adversary Behavior - Detected - Elastic Endgame
- Agent Spoofing - Mismatched Agent ID
- Agent Spoofing - Multiple Hosts Using Same Agent
- Anomalous Linux Compiler Activity
- Anomalous Process For a Linux Population
- Anomalous Process For a Windows Population
- Anomalous Windows Process Creation
- Apple Script Execution followed by Network Connection
- Apple Scripting Execution with Administrator Privileges
- Application Added to Google Workspace Domain
- Application Removed from Blocklist in Google Workspace
- Attempt to Create Okta API Token
- Attempt to Deactivate MFA for an Okta User Account
- Attempt to Deactivate an Okta Application
- Attempt to Deactivate an Okta Network Zone
- Attempt to Deactivate an Okta Policy
- Attempt to Deactivate an Okta Policy Rule
- Attempt to Delete an Okta Application
- Attempt to Delete an Okta Network Zone
- Attempt to Delete an Okta Policy
- Attempt to Delete an Okta Policy Rule
- Attempt to Disable Gatekeeper
- Attempt to Disable IPTables or Firewall
- Attempt to Disable Syslog Service
- Attempt to Enable the Root Account
- Attempt to Install Kali Linux via WSL
- Attempt to Install Root Certificate
- Attempt to Modify an Okta Application
- Attempt to Modify an Okta Network Zone
- Attempt to Modify an Okta Policy
- Attempt to Modify an Okta Policy Rule
- Attempt to Mount SMB Share via Command Line
- Attempt to Remove File Quarantine Attribute
- Attempt to Reset MFA Factors for an Okta User Account
- Attempt to Revoke Okta API Token
- Attempt to Unload Elastic Endpoint Security Kernel Extension
- Attempted Bypass of Okta MFA
- Attempts to Brute Force a Microsoft 365 User Account
- Attempts to Brute Force an Okta User Account
- Authorization Plugin Modification
- Azure AD Global Administrator Role Assigned
- Azure Active Directory High Risk Sign-in
- Azure Active Directory High Risk User Sign-in Heuristic
- Azure Active Directory PowerShell Sign-in
- Azure Alert Suppression Rule Created or Modified
- Azure Application Credential Modification
- Azure Automation Account Created
- Azure Automation Runbook Created or Modified
- Azure Automation Runbook Deleted
- Azure Automation Webhook Created
- Azure Blob Container Access Level Modification
- Azure Blob Permissions Modification
- Azure Command Execution on Virtual Machine
- Azure Conditional Access Policy Modified
- Azure Diagnostic Settings Deletion
- Azure Event Hub Authorization Rule Created or Updated
- Azure Event Hub Deletion
- Azure External Guest User Invitation
- Azure Firewall Policy Deletion
- Azure Frontdoor Web Application Firewall (WAF) Policy Deleted
- Azure Full Network Packet Capture Detected
- Azure Global Administrator Role Addition to PIM User
- Azure Key Vault Modified
- Azure Kubernetes Events Deleted
- Azure Kubernetes Pods Deleted
- Azure Kubernetes Rolebindings Created
- Azure Network Watcher Deletion
- Azure Privilege Identity Management Role Modified
- Azure Resource Group Deletion
- Azure Service Principal Addition
- Azure Service Principal Credentials Added
- Azure Storage Account Key Regenerated
- Azure Virtual Network Device Modified or Deleted
- BPF filter applied using TC
- Base16 or Base32 Encoding/Decoding Activity
- Bash Shell Profile Modification
- Binary Executed from Shared Memory Directory
- Bypass UAC via Event Viewer
- Bypass UAC via Sdclt
- Chkconfig Service Add
- Clearing Windows Console History
- Clearing Windows Event Logs
- Cobalt Strike Command and Control Beacon
- Code Signing Policy Modification Through Built-in tools
- Code Signing Policy Modification Through Registry
- Command Execution via SolarWinds Process
- Command Prompt Network Connection
- Command Shell Activity Started via RunDLL32
- Component Object Model Hijacking
- Compression DLL Loaded by Unusual Process
- Conhost Spawned By Suspicious Parent Process
- Connection to Commonly Abused Free SSL Certificate Providers
- Connection to Commonly Abused Web Services
- Connection to External Network via Telnet
- Connection to Internal Network via Telnet
- Control Panel Process with Unusual Arguments
- Creation of Hidden Files and Directories via CommandLine
- Creation of Hidden Launch Agent or Daemon
- Creation of Hidden Login Item via Apple Script
- Creation of Hidden Shared Object File
- Creation of a Hidden Local User Account
- Creation or Modification of Domain Backup DPAPI private key
- Creation or Modification of Root Certificate
- Creation or Modification of a new GPO Scheduled Task or Service
- Credential Acquisition via Registry Hive Dumping
- Credential Dumping - Detected - Elastic Endgame
- Credential Dumping - Prevented - Elastic Endgame
- Credential Manipulation - Detected - Elastic Endgame
- Credential Manipulation - Prevented - Elastic Endgame
- Cron Job Created or Changed by Previously Unknown Process
- CyberArk Privileged Access Security Error
- CyberArk Privileged Access Security Recommended Monitor
- DNS Tunneling
- DNS-over-HTTPS Enabled via Registry
- Default Cobalt Strike Team Server Certificate
- Delete Volume USN Journal with Fsutil
- Deleting Backup Catalogs with Wbadmin
- Direct Outbound SMB Connection
- Disable Windows Event and Security Logs Using Built-in Tools
- Disable Windows Firewall Rules via Netsh
- Disabling User Account Control via Registry Modification
- Disabling Windows Defender Security Settings via PowerShell
- Domain Added to Google Workspace Trusted Domains
- Downloaded Shortcut Files
- Downloaded URL Files
- Dumping Account Hashes via Built-In Commands
- Dumping of Keychain Content via Security Command
- Dynamic Linker Copy
- ESXI Discovery via Find
- ESXI Discovery via Grep
- ESXI Timestomping using Touch Command
- EggShell Backdoor Execution
- Elastic Agent Service Terminated
- Emond Rules Creation or Modification
- Enable Host Network Discovery via Netsh
- Encoded Executable Stored in the Registry
- Encrypting Files with WinRar or 7z
- Endpoint Security
- Enumerating Domain Trusts via DSQUERY.EXE
- Enumerating Domain Trusts via NLTEST.EXE
- Enumeration Command Spawned via WMIPrvSE
- Enumeration of Administrator Accounts
- Enumeration of Kernel Modules
- Enumeration of Kernel Modules via Proc
- Enumeration of Privileged Local Groups Membership
- Enumeration of Users or Groups via Built-in Commands
- Exchange Mailbox Export via PowerShell
- Executable File Creation with Multiple Extensions
- Execution from Unusual Directory - Command Line
- Execution of COM object via Xwizard
- Execution of File Written or Modified by Microsoft Office
- Execution of File Written or Modified by PDF Reader
- Execution of Persistent Suspicious Program
- Execution of an Unsigned Service
- Execution via Electron Child Process Node.js Module
- Execution via MSSQL xp_cmdshell Stored Procedure
- Execution via TSClient Mountpoint
- Execution via Windows Subsystem for Linux
- Execution via local SxS Shared Module
- Execution with Explicit Credentials via Scripting
- Expired or Revoked Driver Loaded
- Exploit - Detected - Elastic Endgame
- Exploit - Prevented - Elastic Endgame
- Exporting Exchange Mailbox via PowerShell
- External Alerts
- External IP Lookup from Non-Browser Process
- External User Added to Google Workspace Group
- File Creation Time Changed
- File Deletion via Shred
- File Permission Modification in Writable Directory
- File Transfer or Listener Established via Netcat
- File made Immutable by Chattr
- File or Directory Deletion Command
- Finder Sync Plugin Registered and Enabled
- First Time Seen AWS Secret Value Accessed in Secrets Manager
- First Time Seen Commonly Abused Remote Access Tool Execution
- First Time Seen Driver Loaded
- First Time Seen Google Workspace OAuth Login from Third-Party Application
- First Time Seen Removable Device
- FirstTime Seen Account Performing DCSync
- Forwarded Google Workspace Security Alert
- Full User-Mode Dumps Enabled System-Wide
- GCP Firewall Rule Creation
- GCP Firewall Rule Deletion
- GCP Firewall Rule Modification
- GCP IAM Custom Role Creation
- GCP IAM Role Deletion
- GCP IAM Service Account Key Deletion
- GCP Logging Bucket Deletion
- GCP Logging Sink Deletion
- GCP Logging Sink Modification
- GCP Pub/Sub Subscription Creation
- GCP Pub/Sub Subscription Deletion
- GCP Pub/Sub Topic Creation
- GCP Pub/Sub Topic Deletion
- GCP Service Account Creation
- GCP Service Account Deletion
- GCP Service Account Disabled
- GCP Service Account Key Creation
- GCP Storage Bucket Configuration Modification
- GCP Storage Bucket Deletion
- GCP Storage Bucket Permissions Modification
- GCP Virtual Private Cloud Network Deletion
- GCP Virtual Private Cloud Route Creation
- GCP Virtual Private Cloud Route Deletion
- Google Drive Ownership Transferred via Google Workspace
- Google Workspace 2SV Policy Disabled
- Google Workspace API Access Granted via Domain-Wide Delegation of Authority
- Google Workspace Admin Role Assigned to a User
- Google Workspace Admin Role Deletion
- Google Workspace Bitlocker Setting Disabled
- Google Workspace Custom Admin Role Created
- Google Workspace Custom Gmail Route Created or Modified
- Google Workspace Drive Encryption Key(s) Accessed from Anonymous User
- Google Workspace MFA Enforcement Disabled
- Google Workspace Object Copied from External Drive and Access Granted to Custom Application
- Google Workspace Password Policy Modified
- Google Workspace Restrictions for Google Marketplace Modified to Allow Any App
- Google Workspace Role Modified
- Google Workspace Suspended User Account Renewed
- Google Workspace User Organizational Unit Changed
- Group Policy Abuse for Privilege Addition
- Group Policy Discovery via Microsoft GPResult Utility
- Halfbaked Command and Control Beacon
- High Number of Okta User Password Reset or Unlock Attempts
- High Number of Process Terminations
- High Number of Process and/or Service Terminations
- Host Files System Changes via Windows Subsystem for Linux
- Hosts File Modified
- Hping Process Activity
- IIS HTTP Logging Disabled
- IPSEC NAT Traversal Port Activity
- Image File Execution Options Injection
- ImageLoad via Windows Update Auto Update Client
- Inbound Connection to an Unsecure Elasticsearch Node
- Incoming DCOM Lateral Movement via MSHTA
- Incoming DCOM Lateral Movement with MMC
- Incoming DCOM Lateral Movement with ShellBrowserWindow or ShellWindows
- Incoming Execution via PowerShell Remoting
- Incoming Execution via WinRM Remote Shell
- Ingress Transfer via Windows BITS
- InstallUtil Process Making Network Connections
- Installation of Custom Shim Databases
- Installation of Security Support Provider
- Interactive Terminal Spawned via Perl
- Interactive Terminal Spawned via Python
- KRBTGT Delegation Backdoor
- Kerberos Cached Credentials Dumping
- Kerberos Pre-authentication Disabled for User
- Kerberos Traffic from Unusual Process
- Kernel Load or Unload via Kexec Detected
- Kernel Module Removal
- Kernel module load via insmod
- Keychain Password Retrieval via Command Line
- Kubernetes Anonymous Request Authorized
- Kubernetes Container Created with Excessive Linux Capabilities
- Kubernetes Denied Service Account Request
- Kubernetes Exposed Service Created With Type NodePort
- Kubernetes Pod Created With HostIPC
- Kubernetes Pod Created With HostNetwork
- Kubernetes Pod Created With HostPID
- Kubernetes Pod created with a Sensitive hostPath Volume
- Kubernetes Privileged Pod Created
- Kubernetes Suspicious Assignment of Controller Service Account
- Kubernetes Suspicious Self-Subject Review
- Kubernetes User Exec into Pod
- LSASS Memory Dump Creation
- LSASS Memory Dump Handle Access
- Lateral Movement via Startup Folder
- Launch Agent Creation or Modification and Immediate Loading
- LaunchDaemon Creation or Modification and Immediate Loading
- Linux Group Creation
- Linux Restricted Shell Breakout via Linux Binary(s)
- Linux System Information Discovery
- Linux User Account Creation
- Linux User Added to Privileged Group
- Local Account TokenFilter Policy Disabled
- Local Scheduled Task Creation
- MFA Disabled for Google Workspace Organization
- MS Office Macro Security Registry Modifications
- MacOS Installer Package Spawns Network Event
- Malware - Detected - Elastic Endgame
- Malware - Prevented - Elastic Endgame
- Masquerading Space After Filename
- Microsoft 365 Exchange Anti-Phish Policy Deletion
- Microsoft 365 Exchange Anti-Phish Rule Modification
- Microsoft 365 Exchange DKIM Signing Configuration Disabled
- Microsoft 365 Exchange DLP Policy Removed
- Microsoft 365 Exchange Malware Filter Policy Deletion
- Microsoft 365 Exchange Malware Filter Rule Modification
- Microsoft 365 Exchange Management Group Role Assignment
- Microsoft 365 Exchange Safe Attachment Rule Disabled
- Microsoft 365 Exchange Safe Link Policy Disabled
- Microsoft 365 Exchange Transport Rule Creation
- Microsoft 365 Exchange Transport Rule Modification
- Microsoft 365 Global Administrator Role Assigned
- Microsoft 365 Impossible travel activity
- Microsoft 365 Inbox Forwarding Rule Created
- Microsoft 365 Mass download by a single user
- Microsoft 365 Potential ransomware activity
- Microsoft 365 Teams Custom Application Interaction Allowed
- Microsoft 365 Teams External Access Enabled
- Microsoft 365 Teams Guest Access Enabled
- Microsoft 365 Unusual Volume of File Deletion
- Microsoft 365 User Restricted from Sending Email
- Microsoft Build Engine Started an Unusual Process
- Microsoft Build Engine Started by a Script Process
- Microsoft Build Engine Started by a System Process
- Microsoft Build Engine Started by an Office Application
- Microsoft Build Engine Using an Alternate Name
- Microsoft Exchange Server UM Spawning Suspicious Processes
- Microsoft Exchange Server UM Writing Suspicious Files
- Microsoft Exchange Transport Agent Install Script
- Microsoft Exchange Worker Spawning Suspicious Processes
- Microsoft IIS Connection Strings Decryption
- Microsoft IIS Service Account Password Dumped
- Microsoft Windows Defender Tampering
- Mimikatz Memssp Log File Detected
- Modification of AmsiEnable Registry Key
- Modification of Boot Configuration
- Modification of Dynamic Linker Preload Shared Object
- Modification of Environment Variable via Launchctl
- Modification of OpenSSH Binaries
- Modification of Safari Settings via Defaults Command
- Modification of Standard Authentication Module or Configuration
- Modification of WDigest Security Provider
- Modification of the msPKIAccountCredentials
- Modification or Removal of an Okta Application Sign-On Policy
- Mounting Hidden or WebDav Remote Shares
- MsBuild Making Network Connections
- MsBuild Network Connection Sequence
- MsXsl Making Network Connections
- Mshta Making Network Connections
- Multi-Factor Authentication Disabled for an Azure User
- Multiple Alerts Involving a User
- Multiple Alerts in Different ATT&CK Tactics on a Single Host
- Multiple Logon Failure Followed by Logon Success
- Multiple Logon Failure from the same Source Address
- Multiple Vault Web Credentials Read
- NTDS or SAM Database File Copied
- Namespace Manipulation Using Unshare
- Network Connection via Certutil
- Network Connection via Compiled HTML File
- Network Connection via MsXsl
- Network Connection via Registration Utility
- Network Connection via Signed Binary
- Network Logon Provider Registry Modification
- Network Traffic to Rare Destination Country
- New ActiveSyncAllowedDeviceID Added via PowerShell
- New Systemd Service Created by Previously Unknown Process
- New Systemd Timer Created
- New or Modified Federation Domain
- Nping Process Activity
- NullSessionPipe Registry Modification
- O365 Email Reported by User as Malware or Phish
- O365 Excessive Single Sign-On Logon Errors
- O365 Exchange Suspicious Mailbox Right Delegation
- O365 Mailbox Audit Logging Bypass
- Okta Brute Force or Password Spraying Attack
- Okta ThreatInsight Threat Suspected Promotion
- Okta User Session Impersonation
- OneDrive Malware File Upload
- Outbound Scheduled Task Activity via PowerShell
- Parent Process PID Spoofing
- Peripheral Device Discovery
- Permission Theft - Detected - Elastic Endgame
- Permission Theft - Prevented - Elastic Endgame
- Persistence via BITS Job Notify Cmdline
- Persistence via DirectoryService Plugin Modification
- Persistence via Docker Shortcut Modification
- Persistence via Folder Action Script
- Persistence via Hidden Run Key Detected
- Persistence via KDE AutoStart Script or Desktop File Modification
- Persistence via Login or Logout Hook
- Persistence via Microsoft Office AddIns
- Persistence via Microsoft Outlook VBA
- Persistence via PowerShell profile
- Persistence via Scheduled Job Creation
- Persistence via TelemetryController Scheduled Task Hijack
- Persistence via Update Orchestrator Service Hijack
- Persistence via WMI Event Subscription
- Persistence via WMI Standard Registry Provider
- Persistent Scripts in the Startup Directory
- Port Forwarding Rule Addition
- Possible Consent Grant Attack via Azure-Registered Application
- Possible FIN7 DGA Command and Control Behavior
- Possible Okta DoS Attack
- Potential Abuse of Repeated MFA Push Notifications
- Potential Admin Group Account Addition
- Potential Antimalware Scan Interface Bypass via PowerShell
- Potential Application Shimming via Sdbinst
- Potential Code Execution via Postgresql
- Potential Command and Control via Internet Explorer
- Potential Cookies Theft via Browser Debugging
- Potential Credential Access via DCSync
- Potential Credential Access via DuplicateHandle in LSASS
- Potential Credential Access via LSASS Memory Dump
- Potential Credential Access via Renamed COM+ Services DLL
- Potential Credential Access via Trusted Developer Utility
- Potential Credential Access via Windows Utilities
- Potential Cross Site Scripting (XSS)
- Potential DLL Side-Loading via Microsoft Antimalware Service Executable
- Potential DLL SideLoading via Trusted Microsoft Programs
- Potential DNS Tunneling via Iodine
- Potential DNS Tunneling via NsLookup
- Potential Defense Evasion via PRoot
- Potential Disabling of SELinux
- Potential Evasion via Filter Manager
- Potential Exfiltration via Certreq
- Potential Exploitation of an Unquoted Service Path Vulnerability
- Potential External Linux SSH Brute Force Detected
- Potential Hidden Local User Account Creation
- Potential Hidden Process via Mount Hidepid
- Potential Internal Linux SSH Brute Force Detected
- Potential Invoke-Mimikatz PowerShell Script
- Potential JAVA/JNDI Exploitation Attempt
- Potential Kerberos Attack via Bifrost
- Potential LSA Authentication Package Abuse
- Potential LSASS Clone Creation via PssCaptureSnapShot
- Potential LSASS Memory Dump via PssCaptureSnapShot
- Potential Lateral Tool Transfer via SMB Share
- Potential Linux Backdoor User Account Creation
- Potential Linux Credential Dumping via Proc Filesystem
- Potential Linux Credential Dumping via Unshadow
- Potential Linux Local Account Brute Force Detected
- Potential Linux Ransomware Note Creation Detected
- Potential Local NTLM Relay via HTTP
- Potential Malicious File Downloaded from Google Drive
- Potential Masquerading as Communication Apps
- Potential Microsoft Office Sandbox Evasion
- Potential Modification of Accessibility Binaries
- Potential Network Scan Detected
- Potential Network Share Discovery
- Potential Network Sweep Detected
- Potential Non-Standard Port HTTP/HTTPS connection
- Potential Non-Standard Port SSH connection
- Potential OpenSSH Backdoor Logging Activity
- Potential Pass-the-Hash (PtH) Attempt
- Potential Password Spraying of Microsoft 365 User Accounts
- Potential Persistence Through MOTD File Creation Detected
- Potential Persistence Through Run Control Detected
- Potential Persistence Through init.d Detected
- Potential Persistence via Atom Init Script Modification
- Potential Persistence via Login Hook
- Potential Persistence via Periodic Tasks
- Potential Persistence via Time Provider Modification
- Potential Port Monitor or Print Processor Registration Abuse
- Potential PowerShell HackTool Script by Function Names
- Potential Privacy Control Bypass via Localhost Secure Copy
- Potential Privacy Control Bypass via TCCDB Modification
- Potential Privilege Escalation through Writable Docker Socket
- Potential Privilege Escalation via InstallerFileTakeOver
- Potential Privilege Escalation via OverlayFS
- Potential Privilege Escalation via PKEXEC
- Potential Privilege Escalation via Sudoers File Modification
- Potential Privileged Escalation via SamAccountName Spoofing
- Potential Process Herpaderping Attempt
- Potential Process Injection via LD_PRELOAD Environment Variable
- Potential Process Injection via PowerShell
- Potential Protocol Tunneling via EarthWorm
- Potential Pspy Process Monitoring Detected
- Potential Remote Code Execution via Web Server
- Potential Remote Credential Access via Registry
- Potential Remote Desktop Shadowing Activity
- Potential Remote Desktop Tunneling Detected
- Potential Reverse Shell
- Potential Reverse Shell Activity via Terminal
- Potential Reverse Shell via Java
- Potential Reverse Shell via Suspicious Binary
- Potential Reverse Shell via Suspicious Child Process
- Potential Reverse Shell via Suspicious Parent Process
- Potential SSH Password Guessing
- Potential SYN-Based Network Scan Detected
- Potential Secure File Deletion via SDelete Utility
- Potential Shadow Credentials added to AD Object
- Potential Shadow File Read via Command Line Utilities
- Potential SharpRDP Behavior
- Potential Successful Linux FTP Brute Force Attack Detected
- Potential Successful Linux RDP Brute Force Attack Detected
- Potential Suspicious File Edit
- Potential Windows Error Manager Masquerading
- Potential macOS SSH Brute Force Detected
- PowerShell Invoke-NinjaCopy script
- PowerShell Kerberos Ticket Request
- PowerShell Keylogging Script
- PowerShell Mailbox Collection Script
- PowerShell MiniDump Script
- PowerShell PSReflect Script
- PowerShell Script Block Logging Disabled
- PowerShell Script with Archive Compression Capabilities
- PowerShell Script with Discovery Capabilities
- PowerShell Script with Encryption/Decryption Capabilities
- PowerShell Script with Log Clear Capabilities
- PowerShell Script with Token Impersonation Capabilities
- PowerShell Share Enumeration Script
- PowerShell Suspicious Discovery Related Windows API Functions
- PowerShell Suspicious Payload Encoded and Compressed
- PowerShell Suspicious Script with Audio Capture Capabilities
- PowerShell Suspicious Script with Clipboard Retrieval Capabilities
- PowerShell Suspicious Script with Screenshot Capabilities
- Privilege Escalation via Named Pipe Impersonation
- Privilege Escalation via Rogue Named Pipe Impersonation
- Privilege Escalation via Root Crontab File Modification
- Privilege Escalation via Windir Environment Variable
- Privileged Account Brute Force
- Privileges Elevation via Parent Process PID Spoofing
- Process Activity via Compiled HTML File
- Process Created with an Elevated Token
- Process Creation via Secondary Logon
- Process Discovery Using Built-in Tools
- Process Discovery via Built-In Applications
- Process Execution from an Unusual Directory
- Process Injection - Detected - Elastic Endgame
- Process Injection - Prevented - Elastic Endgame
- Process Injection by the Microsoft Build Engine
- Process Started from Process ID (PID) File
- Process Termination followed by Deletion
- Program Files Directory Masquerading
- Prompt for Credentials with OSASCRIPT
- PsExec Network Connection
- Python Script Execution via Command Line
- Query Registry using Built-in Tools
- RDP (Remote Desktop Protocol) from the Internet
- RDP Enabled via Registry
- RPC (Remote Procedure Call) from the Internet
- RPC (Remote Procedure Call) to the Internet
- Ransomware - Detected - Elastic Endgame
- Ransomware - Prevented - Elastic Endgame
- Rare AWS Error Code
- Rare User Logon
- Registry Persistence via AppCert DLL
- Registry Persistence via AppInit DLL
- Remote Computer Account DnsHostName Update
- Remote Desktop Enabled in Windows Firewall by Netsh
- Remote Execution via File Shares
- Remote File Copy to a Hidden Share
- Remote File Copy via TeamViewer
- Remote File Download via Desktopimgdownldr Utility
- Remote File Download via MpCmdRun
- Remote File Download via PowerShell
- Remote File Download via Script Interpreter
- Remote Logon followed by Scheduled Task Creation
- Remote SSH Login Enabled via systemsetup Command
- Remote Scheduled Task Creation
- Remote System Discovery Commands
- Remote Windows Service Installed
- Remotely Started Services via RPC
- Renamed AutoIt Scripts Interpreter
- Renamed Utility Executed with Short Program Name
- Roshal Archive (RAR) or PowerShell File Downloaded from the Internet
- SIP Provider Modification
- SMB (Windows File Sharing) Activity to the Internet
- SMTP on Port 26/TCP
- SSH Authorized Keys File Modification
- SUNBURST Command and Control Activity
- Scheduled Task Created by a Windows Script
- Scheduled Task Execution at Scale via GPO
- Scheduled Tasks AT Command Enabled
- Screensaver Plist File Modified by Unexpected Process
- SeDebugPrivilege Enabled by a Suspicious Process
- Searching for Saved Credentials via VaultCmd
- Security Software Discovery using WMIC
- Security Software Discovery via Grep
- Sensitive Files Compression
- Sensitive Privilege SeEnableDelegationPrivilege assigned to a User
- Service Command Lateral Movement
- Service Control Spawned via Script Interpreter
- Service Creation via Local Kerberos Authentication
- Setuid / Setgid Bit Set via chmod
- SharePoint Malware File Upload
- Shared Object Created or Changed by Previously Unknown Process
- Shell Execution via Apple Scripting
- Signed Proxy Execution via MS Work Folders
- SoftwareUpdate Preferences Modification
- SolarWinds Process Disabling Services via Registry
- Spike in AWS Error Messages
- Spike in Failed Logon Events
- Spike in Firewall Denies
- Spike in Logon Events
- Spike in Network Traffic
- Spike in Network Traffic To a Country
- Spike in Successful Logon Events from a Source IP
- Startup Folder Persistence via Unsigned Process
- Startup Persistence by a Suspicious Process
- Startup or Run Key Registry Modification
- Startup/Logon Script added to Group Policy Object
- Sublime Plugin or Application Script Modification
- Sudo Heap-Based Buffer Overflow Attempt
- Sudoers File Modification
- Suspicious .NET Code Compilation
- Suspicious .NET Reflection via PowerShell
- Suspicious Activity Reported by Okta User
- Suspicious Antimalware Scan Interface DLL
- Suspicious Automator Workflows Execution
- Suspicious Browser Child Process
- Suspicious Calendar File Modification
- Suspicious CertUtil Commands
- Suspicious Child Process of Adobe Acrobat Reader Update Service
- Suspicious Cmd Execution via WMI
- Suspicious Content Extracted or Decompressed via Funzip
- Suspicious CronTab Creation or Modification
- Suspicious DLL Loaded for Persistence or Privilege Escalation
- Suspicious Data Encryption via OpenSSL Utility
- Suspicious Emond Child Process
- Suspicious Endpoint Security Parent Process
- Suspicious Execution from a Mounted Device
- Suspicious Execution via Microsoft Office Add-Ins
- Suspicious Execution via Scheduled Task
- Suspicious Execution via Windows Subsystem for Linux
- Suspicious Explorer Child Process
- Suspicious File Changes Activity Detected
- Suspicious File Creation in /etc for Persistence
- Suspicious HTML File Creation
- Suspicious Hidden Child Process of Launchd
- Suspicious Image Load (taskschd.dll) from MS Office
- Suspicious ImagePath Service Creation
- Suspicious Inter-Process Communication via Outlook
- Suspicious JAVA Child Process
- Suspicious LSASS Access via MalSecLogon
- Suspicious Lsass Process Access
- Suspicious MS Office Child Process
- Suspicious MS Outlook Child Process
- Suspicious Managed Code Hosting Process
- Suspicious Microsoft 365 Mail Access by ClientAppId
- Suspicious Microsoft Diagnostics Wizard Execution
- Suspicious Mining Process Creation Event
- Suspicious Modprobe File Event
- Suspicious Module Loaded by LSASS
- Suspicious Network Activity to the Internet by Previously Unknown Executable
- Suspicious Network Connection Attempt by Root
- Suspicious PDF Reader Child Process
- Suspicious Portable Executable Encoded in Powershell Script
- Suspicious PowerShell Engine ImageLoad
- Suspicious Powershell Script
- Suspicious Print Spooler File Deletion
- Suspicious Print Spooler Point and Print DLL
- Suspicious Print Spooler SPL File Created
- Suspicious PrintSpooler Service Executable File Creation
- Suspicious Proc Pseudo File System Enumeration
- Suspicious Process Access via Direct System Call
- Suspicious Process Creation CallTrace
- Suspicious Process Execution via Renamed PsExec Executable
- Suspicious Process Spawned from MOTD Detected
- Suspicious RDP ActiveX Client Loaded
- Suspicious Remote Registry Access via SeBackupPrivilege
- Suspicious Renaming of ESXI Files
- Suspicious Renaming of ESXI index.html File
- Suspicious Script Object Execution
- Suspicious Service was Installed in the System
- Suspicious SolarWinds Child Process
- Suspicious Startup Shell Folder Modification
- Suspicious Sysctl File Event
- Suspicious System Commands Executed by Previously Unknown Executable
- Suspicious Termination of ESXI Process
- Suspicious WMI Image Load from MS Office
- Suspicious WMIC XSL Script Execution
- Suspicious WerFault Child Process
- Suspicious Zoom Child Process
- Suspicious macOS MS Office Child Process
- Svchost spawning Cmd
- Symbolic Link to Shadow Copy Created
- System Hosts File Access
- System Information Discovery via Windows Command Shell
- System Log File Deletion
- System Network Connections Discovery
- System Owner/User Discovery Linux
- System Service Discovery through built-in Windows Utilities
- System Shells via Services
- System Time Discovery
- SystemKey Access via Command Line
- TCC Bypass via Mounted APFS Snapshot Access
- Tampering of Bash Command-Line History
- Temporarily Scheduled Task Creation
- Third-party Backup Files Deleted via Unexpected Process
- Threat Intel Hash Indicator Match
- Threat Intel IP Address Indicator Match
- Threat Intel URL Indicator Match
- Threat Intel Windows Registry Indicator Match
- Timestomping using Touch Command
- UAC Bypass Attempt via Elevated COM Internet Explorer Add-On Installer
- UAC Bypass Attempt via Privileged IFileOperation COM Interface
- UAC Bypass Attempt via Windows Directory Masquerading
- UAC Bypass Attempt with IEditionUpgradeManager Elevated COM Interface
- UAC Bypass via DiskCleanup Scheduled Task Hijack
- UAC Bypass via ICMLuaUtil Elevated COM Interface
- UAC Bypass via Windows Firewall Snap-In Hijack
- Unauthorized Access to an Okta Application
- Uncommon Registry Persistence Change
- Unexpected Child Process of macOS Screensaver Engine
- Unsigned DLL Loaded by Svchost
- Unsigned DLL Side-Loading from a Suspicious Folder
- Untrusted Driver Loaded
- Unusual AWS Command for a User
- Unusual Child Process from a System Virtual Process
- Unusual Child Process of dns.exe
- Unusual Child Processes of RunDLL32
- Unusual City For an AWS Command
- Unusual Country For an AWS Command
- Unusual DNS Activity
- Unusual Executable File Creation by a System Critical Process
- Unusual File Creation - Alternate Data Stream
- Unusual File Modification by dns.exe
- Unusual Hour for a User to Logon
- Unusual Linux Network Activity
- Unusual Linux Network Configuration Discovery
- Unusual Linux Network Connection Discovery
- Unusual Linux Network Port Activity
- Unusual Linux Process Calling the Metadata Service
- Unusual Linux Process Discovery Activity
- Unusual Linux System Information Discovery Activity
- Unusual Linux User Calling the Metadata Service
- Unusual Linux User Discovery Activity
- Unusual Linux Username
- Unusual Login Activity
- Unusual Network Activity from a Windows System Binary
- Unusual Network Connection via DllHost
- Unusual Network Connection via RunDLL32
- Unusual Network Destination Domain Name
- Unusual Parent Process for cmd.exe
- Unusual Parent-Child Relationship
- Unusual Persistence via Services Registry
- Unusual Print Spooler Child Process
- Unusual Process Execution Path - Alternate Data Stream
- Unusual Process For a Linux Host
- Unusual Process For a Windows Host
- Unusual Process Network Connection
- Unusual Service Host Child Process - Childless Service
- Unusual Source IP for a User to Logon from
- Unusual Sudo Activity
- Unusual Web Request
- Unusual Web User Agent
- Unusual Windows Network Activity
- Unusual Windows Path Activity
- Unusual Windows Process Calling the Metadata Service
- Unusual Windows Remote User
- Unusual Windows Service
- Unusual Windows User Calling the Metadata Service
- Unusual Windows User Privilege Elevation Activity
- Unusual Windows Username
- User Account Creation
- User Added as Owner for Azure Application
- User Added as Owner for Azure Service Principal
- User Added to Privileged Group
- User account exposed to Kerberoasting
- VNC (Virtual Network Computing) from the Internet
- VNC (Virtual Network Computing) to the Internet
- Virtual Machine Fingerprinting
- Virtual Machine Fingerprinting via Grep
- Virtual Private Network Connection Attempt
- Volume Shadow Copy Deleted or Resized via VssAdmin
- Volume Shadow Copy Deletion via PowerShell
- Volume Shadow Copy Deletion via WMIC
- WMI Incoming Lateral Movement
- WPAD Service Exploit
- Web Application Suspicious Activity: POST Request Declined
- Web Application Suspicious Activity: Unauthorized Method
- Web Application Suspicious Activity: sqlmap User Agent
- Web Shell Detection: Script Process Child of Common Web Processes
- WebProxy Settings Modification
- WebServer Access Logs Deleted
- Whoami Process Activity
- Windows Account or Group Discovery
- Windows CryptoAPI Spoofing Vulnerability (CVE-2020-0601 - CurveBall)
- Windows Defender Disabled via Registry Modification
- Windows Defender Exclusions Added via PowerShell
- Windows Event Logs Cleared
- Windows Firewall Disabled via PowerShell
- Windows Network Enumeration
- Windows Registry File Creation in SMB Share
- Windows Script Executing PowerShell
- Windows Script Interpreter Executing Process via WMI
- Windows Service Installed via an Unusual Client
- Windows Subsystem for Linux Distribution Installed
- Windows Subsystem for Linux Enabled via Dism Utility
- Windows System Information Discovery
- Windows System Network Connections Discovery
- Windows User Account Creation
- Wireless Credential Dumping using Netsh Command
- Zoom Meeting with no Passcode
- Downloadable rule updates
- Update v0.13.1
- Update v0.13.2
- Update v0.13.3
- Update v0.14.1
- Update v0.14.2
- Update v0.14.3
- Update v1.0.2
- Update v8.1.1
- Update v8.2.1
- Update v8.3.1
- Update v8.3.2
- Update v8.3.3
- Update v8.3.4
- Update v8.4.1
- Update v8.4.2
- Update v8.4.3
- Update v8.5.1
- Update v8.6.1
- Update v8.6.2
- Update v8.6.3
- Update v8.6.4
- Update v8.6.5
- Update v8.6.6
- Update v8.6.7
- Update v8.6.8
- Update v8.6.9
- Update v8.6.10
- Cloud native security
- Investigate
- Osquery
- Endpoint management
- Elastic Security APIs
- Detections API
- Exceptions API
- Create exception container
- Create exception item
- Create shared exception list
- Find exception containers
- Find exception items
- Get exception container
- Get exception item
- Import exception list
- Export exception list
- Update exception container
- Summary exception container
- Update exception item
- Delete exception container
- Delete exception item
- Lists index endpoint
- Lists API
- Detection Alerts Migration API
- Timeline API
- Get Timelines or Timeline templates
- Get Timeline / Timeline template by savedObjectId
- Get Timeline template by templateTimelineId
- Create Timeline or Timeline template
- Update Timeline or Timeline template
- Add a note to an existing Timeline
- Pin an event to an existing Timeline
- Delete Timelines or Timeline templates
- Import timelines and timeline templates
- Cases API
- Actions API (for pushing cases to external systems)
- Endpoint management API
- Elastic Security fields and object schemas
- Troubleshooting
- Technical preview
- Release notes
Create a detection rule
editCreate a detection rule
editRules run periodically and search for source events, matches, sequences, or machine learning job anomaly results that meet their criteria. When a rule’s criteria are met, a detection alert is created.
You can create the following types of rules:
- Custom query: Query-based rule, which searches the defined indices and creates an alert when one or more documents match the rule’s query.
-
Machine learning: Machine learning rule, which creates an alert when a machine learning job discovers an anomaly above the defined threshold (see Anomaly detection with machine learning).
For machine learning rules, the associated machine learning job must be running. If the machine learning job isn’t running, the rule will:
- Run and create alerts if existing anomaly results with scores above the defined threshold are discovered.
- Issue an error stating the machine learning job was not running when the rule executed.
-
Threshold: Searches the defined indices and creates a detections alert when the number of times the specified field’s value is present and meets the threshold during a single execution. When multiple values meet the threshold, an alert is generated for each value.
For example, if the threshold
fieldissource.ipand itsvalueis10, an alert is generated for every source IP address that appears in at least 10 of the rule’s search results. - Event correlation: Searches the defined indices and creates an alert when results match an Event Query Language (EQL) query.
-
Indicator match: Creates an alert when Elastic Security index field values match field values defined in the specified indicator index patterns. For example, you can create an indicator index for IP addresses and use this index to create an alert whenever an event’s
destination.ipequals a value in the index. Indicator index field mappings should be ECS-compliant. For information on creating Elasticsearch indices and field types, see Index some documents, Create index API, and Field data types. If you have indicators in a standard file format, such as CSV or JSON, you can also use the Machine Learning Data Visualizer to import your indicators into an indicator index. See Explore the data in Kibana and use the Import Data option to import your indicators.You can also use value lists as the indicator match index. See Use value lists with indicator match rules at the end of this topic for more information.
-
New terms: Generates an alert for each new term detected in source documents within a specified time range. You can also detect a combination of up to three new terms (for example, a
host.ipandhost.idthat have never been observed together before).
When modifying rules or managing detection alerts, you can add exceptions that prevent a rule from generating alerts even when its criteria are met. This is useful for reducing noise, such as preventing alerts from trusted processes and internal IP addresses.
You can add exceptions to custom query, machine learning, event correlation, and indicator match rule types.
For both prebuilt and custom rules, you can send notifications when alerts are created. Notifications can be sent via Jira, Microsoft Teams, PagerDuty, Slack, and others, and can be configured when you create or edit a rule.
Creating a new rule requires the following steps:
Additional configuration is required for detection rules using cross-cluster search. Refer to Cross-cluster search and detection rules.
At any step, you can preview the rule before saving it to see what kind of results you can expect.
After you activate a rule, you can check if it is running as expected
using the Monitoring tab on the Rules page. If you see
values in the Gap column, you can Troubleshoot missing alerts.
When a rule fails to run, the Elastic Security app tries to rerun it at its next scheduled run time.
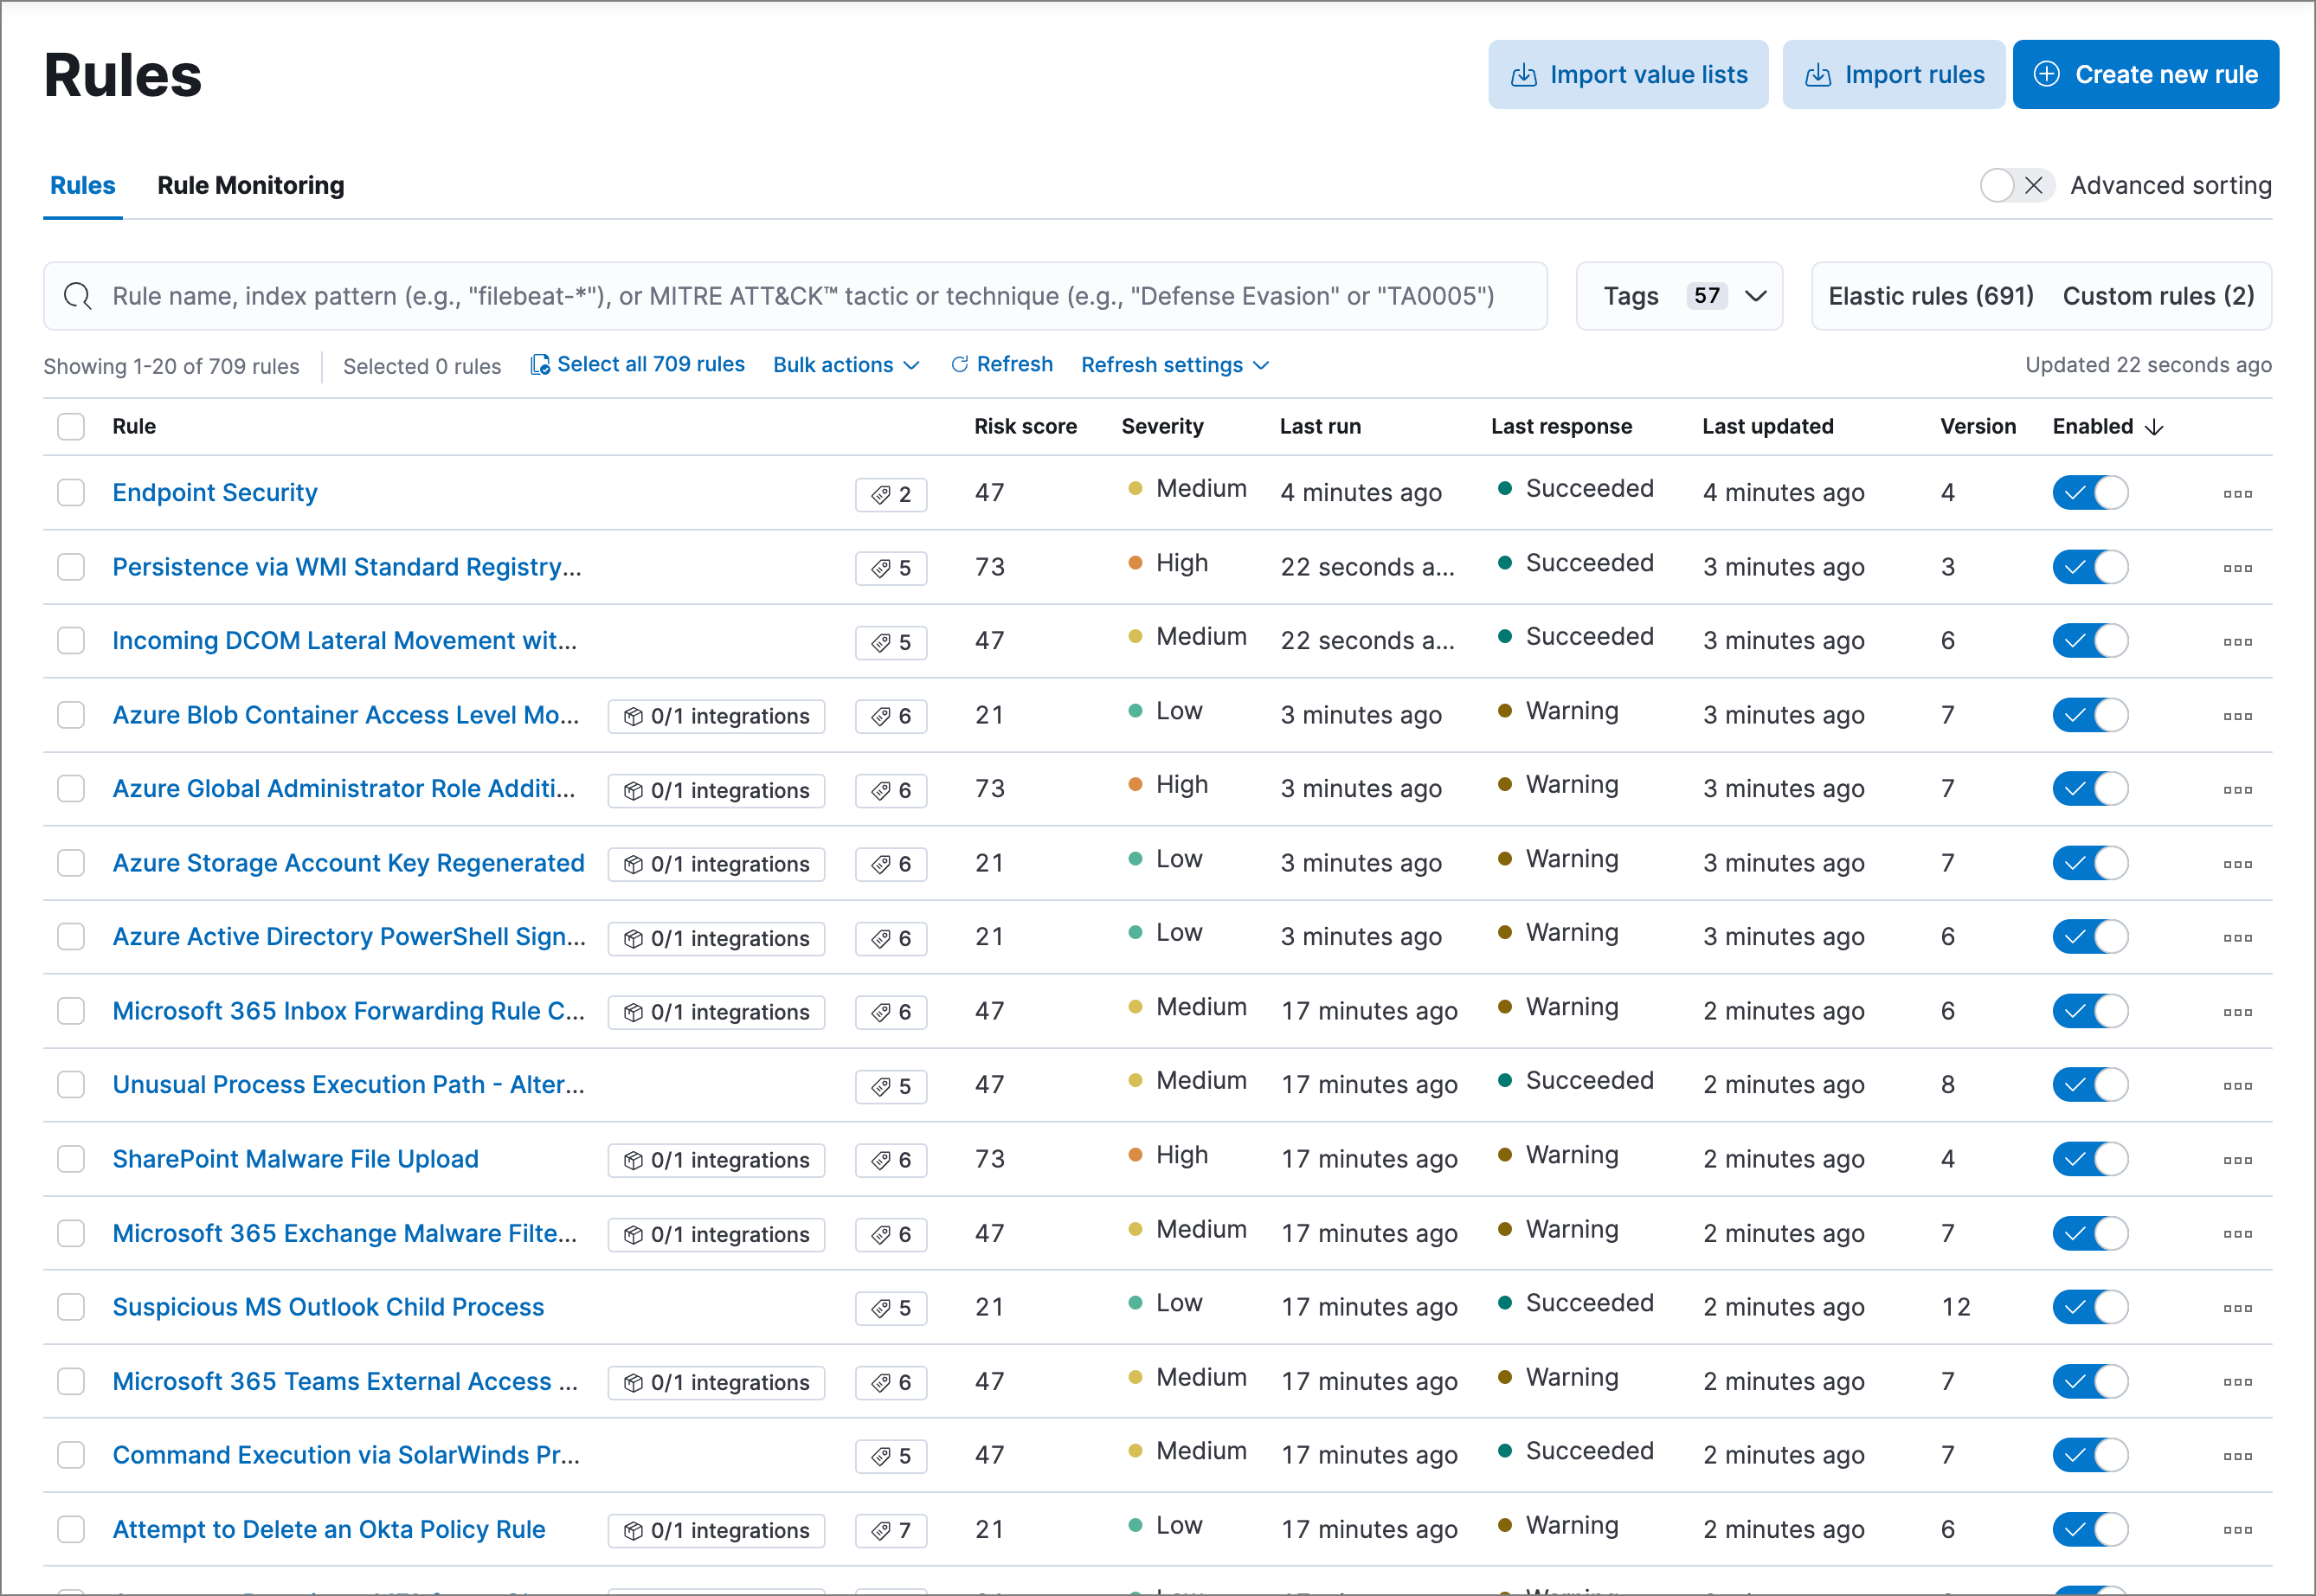
Authorization
editRules, including all background detection and the actions they generate, are authorized using an API key associated with the last user to edit the rule. Upon creating or modifying a rule, an API key is generated for that user, capturing a snapshot of their privileges. The API key is then used to run all background tasks associated with the rule including detection checks and executing actions.
If a rule requires certain privileges to run, such as index privileges, keep in mind that if a user without those privileges updates the rule, the rule will no longer function.
Data views and index patterns
editWhen you create a rule, you must either specify the Elasticsearch index pattens for which you’d like the rule to run, or select a data view as the data source. If you select a data view, you can select runtime fields associated with that data view to create a query for the rule (with the exception of machine learning rules, which do not use queries).
To access data views, ensure you have the required permissions.
Select rule type and scope
edit-
Go to Manage → Rules → Create new rule. The Create new rule page displays.
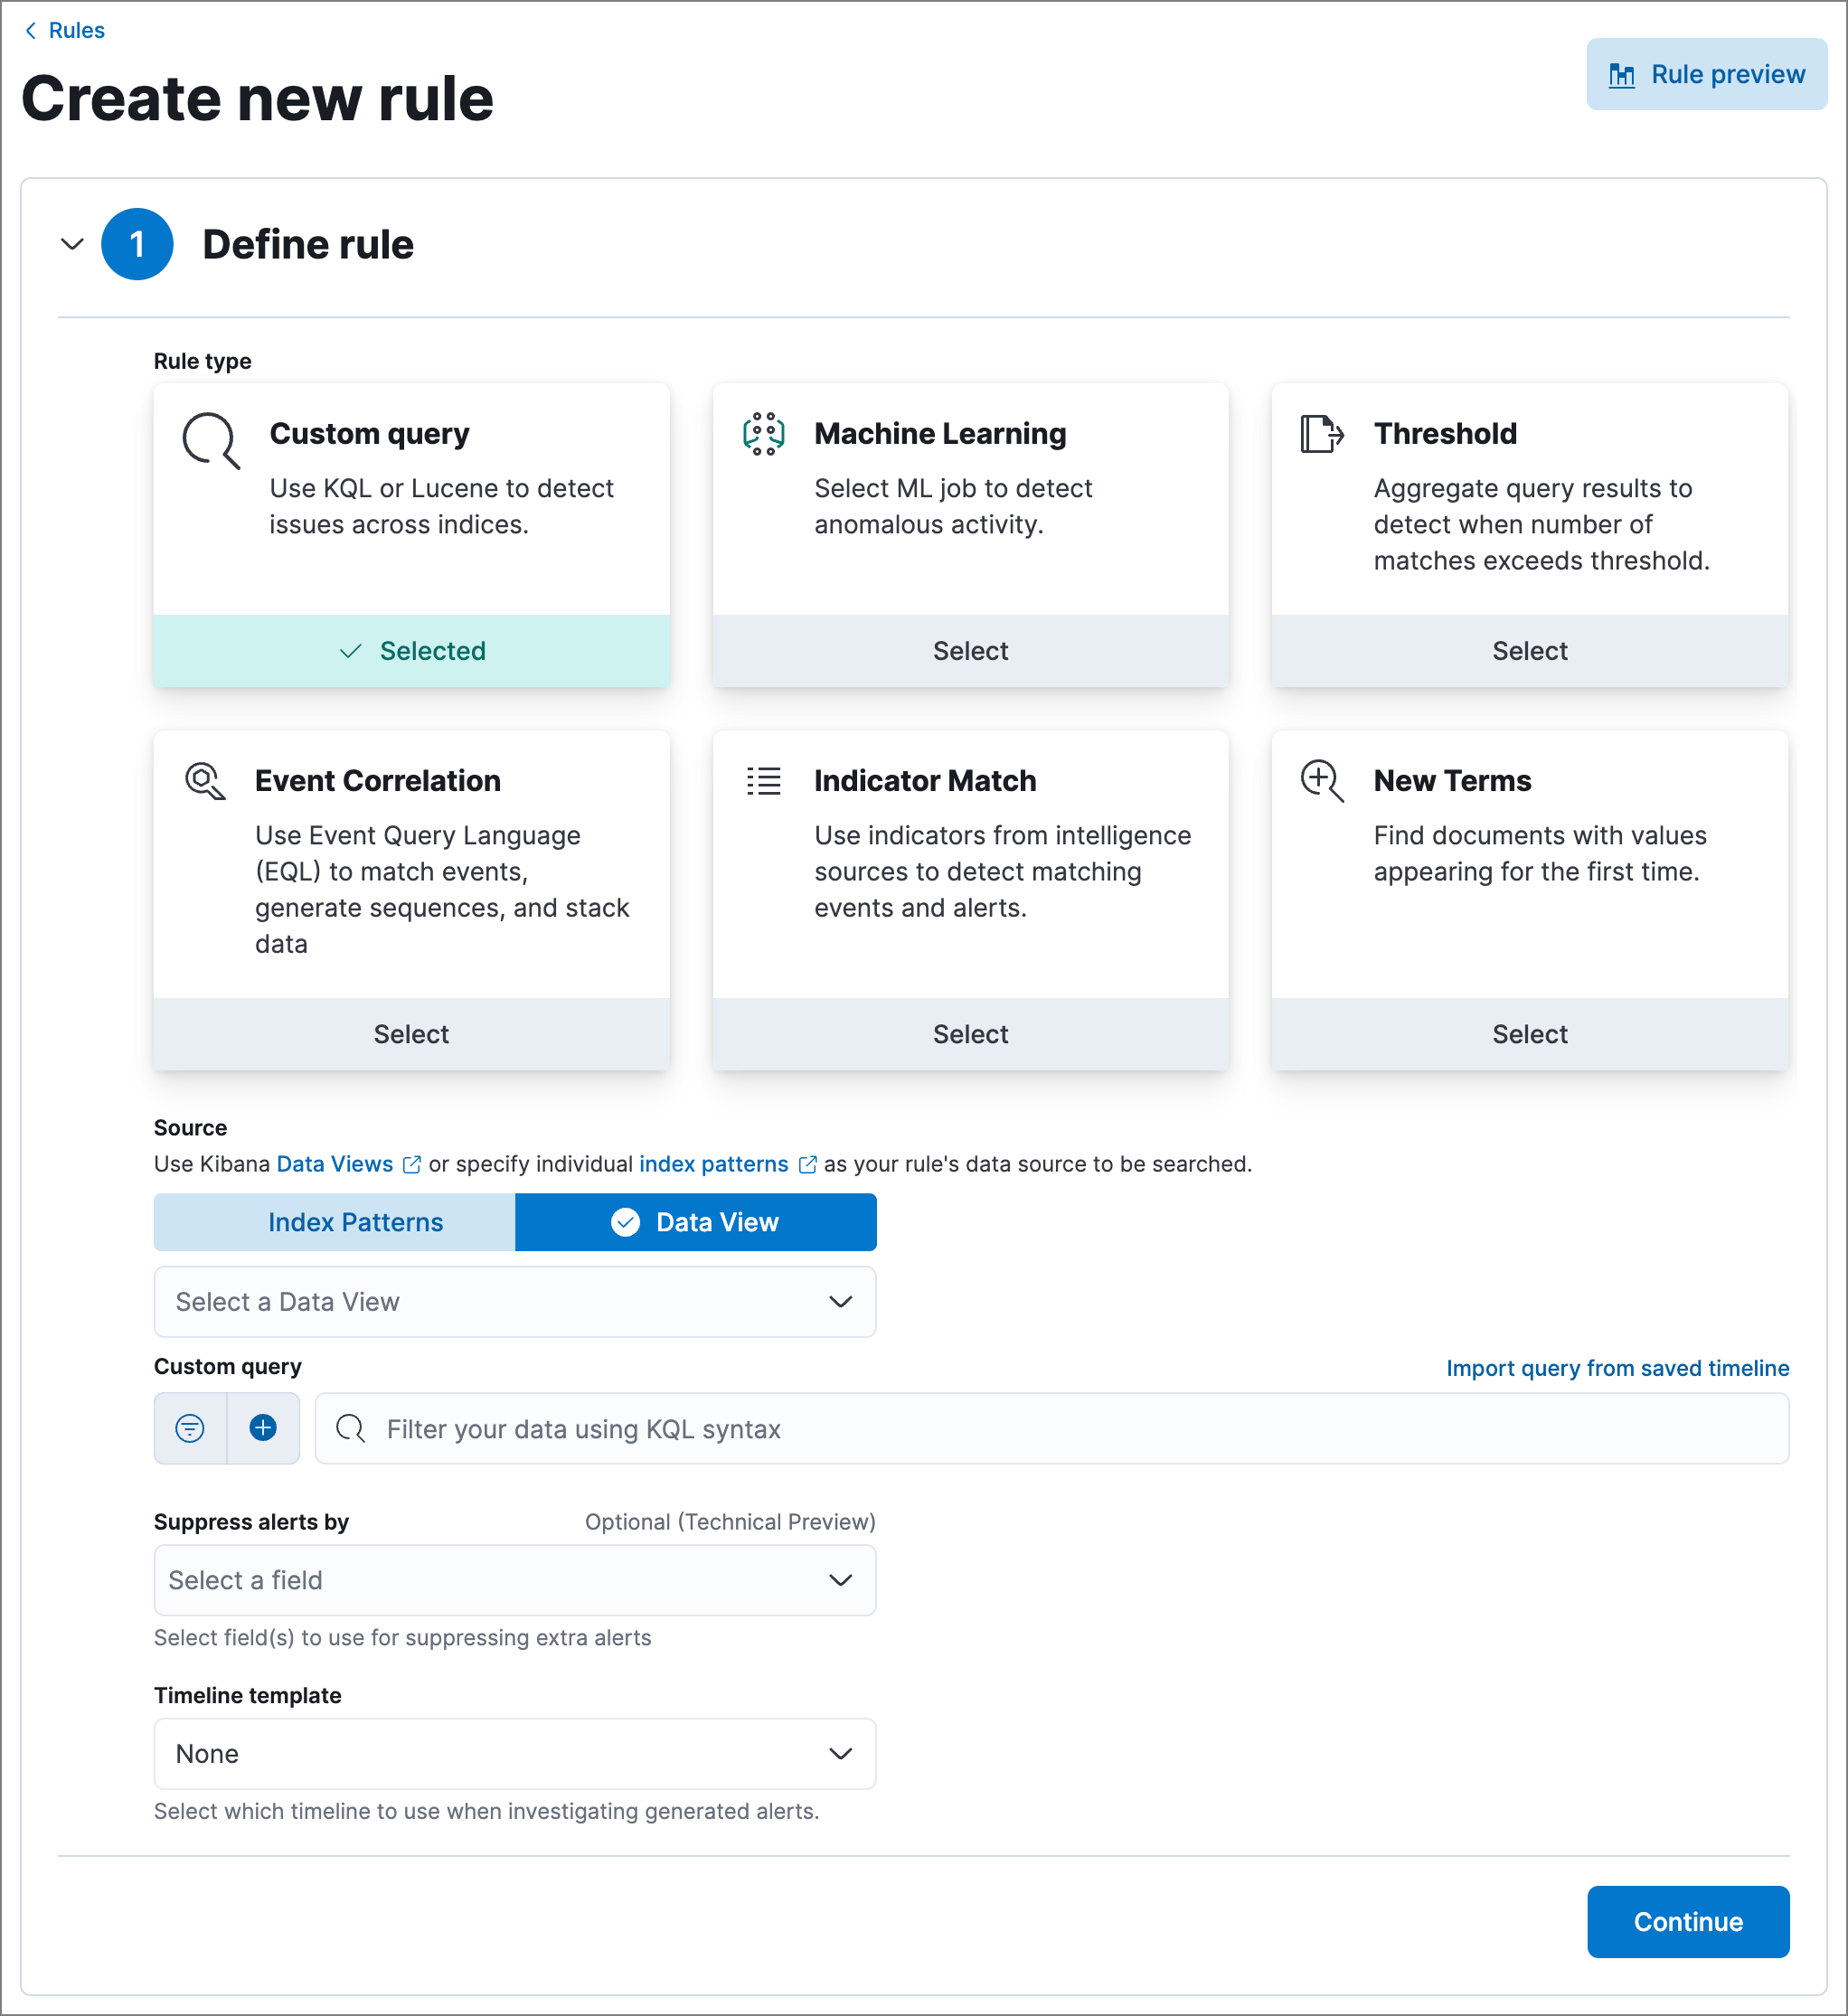
-
Select the type of rule you want to create, then follow the steps outlined in that section:
Create a machine learning rule
editTo create or edit machine learning rules, you must have the appropriate license or use a
cloud deployment. Additionally, you must have the machine_learning_admin user
role, and the selected machine learning job must be running for the rule to function correctly.
-
To create a rule based on a machine learning anomaly threshold, select Machine Learning, then select:
-
The required machine learning jobs.
If a required job isn’t currently running, it will automatically start when you finish configuring and enable the rule.
- The anomaly score threshold above which alerts are created.
-
- Click Continue to configure basic rule settings.
Create a custom query rule
edit-
To create a rule based on a KQL or Lucene query, select Custom query, then:
- Define which Elasticsearch indices or data view the rule searches for alerts.
-
Use the filter and query fields to create the criteria used for detecting alerts.
The following example (based on the prebuilt rule Volume Shadow Copy Deleted or Resized via VssAdmin) detects when the
vssadmin delete shadowsWindows command is executed:-
Index patterns:
winlogbeat-*Winlogbeat ships Windows event logs to Elastic Security.
-
Custom query:
event.action:"Process Create (rule: ProcessCreate)" and process.name:"vssadmin.exe" and process.args:("delete" and "shadows")Searches the
winlogbeat-*indices forvssadmin.exeexecutions with thedeleteandshadowarguments, which are used to delete a volume’s shadow copies.
-
-
You can use Kibana saved queries (
 ) and queries from saved Timelines (Import query from saved Timeline) as rule conditions.
When you use a saved query, the Load saved query "query name" dynamically on each rule execution check box appears:
- Select this to use the saved query every time the rule runs. This links the rule to the saved query, and you won’t be able to modify the rule’s Custom query field or filters because the rule will only use settings from the saved query. To make changes, modify the saved query itself.
- Deselect this to load the saved query as a one-time way of populating the rule’s Custom query field and filters. This copies the settings from the saved query to the rule, so you can then further adjust the rule’s query and filters as needed. If the saved query is later changed, the rule will not inherit those changes.
-
[preview] This functionality is in technical preview and may be changed or removed in a future release. Elastic will work to fix any issues, but features in technical preview are not subject to the support SLA of official GA features. (Optional, Platinum or higher subscription required) Use Suppress Alerts By to reduce the number of repeated or duplicate alerts created each time the rule runs. Enter a field name to group matching source events by the field’s unique values, and only one alert will be created for each group of events per rule execution. You can also enter multiple fields to group events by unique combinations of values.
You’ll still be able to view the original events associated with suppressed alerts by investigating the alert in Timeline. Refer to Suppress detection alerts for more information.
If you specify a field with multiple values, an alert grouping is created for each value. For example, if you suppress alerts by
destination.ipof[127.0.0.1, 127.0.0.2, 127.0.0.3], alerts will be suppressed separately for each matching value of127.0.0.1,127.0.0.2, and127.0.0.3. - Click Continue to configure basic rule settings.
Create a threshold rule
edit-
To create a rule based on a source event field threshold, select Threshold, then:
- Define which Elasticsearch indices the rule analyzes for alerts.
-
Use the filter and query fields to create the criteria used for detecting alerts.
You can use Kibana saved queries (
 ) and queries from saved Timelines (Import query from saved Timeline) as rule conditions.
 -
Use the
Group byandThresholdfields to determine which source event field is used as a threshold and the threshold’s value. -
Use the
Countfield to limit alerts by cardinality of a certain field.For example, if
Group byissource.ip,destination.ipand itsThresholdis10, an alert is generated for every pair of source and destination IP addresses that appear in at least 10 of the rule’s search results.You can also leave the
Group byfield undefined. The rule then creates an alert when the number of search results is equal to or greater than the threshold value. If you setCountto limit the results byprocess.name>= 2, an alert will only be generated for source/destination IP pairs that appear with at least 2 unique process names across all events.Alerts created by threshold rules are synthetic alerts that do not resemble the source documents. The alert itself only contains data about the fields that were aggregated over (the
Group byfields). Other fields are omitted, because they can vary across all source documents that were counted toward the threshold. Additionally, you can reference the actual count of documents that exceeded the threshold from thekibana.alert.threshold_result.countfield.
- Click Continue to configure basic rule settings.
Create an event correlation rule
edit-
To create an event correlation rule using EQL, select Event Correlation, then:
-
Define which Elasticsearch indices or data view the rule searches for alerts.
Event correlation rules have a limitation that prevents them from querying multiple indices from different clusters (local and remote). To enable this, a user with the
superuserrole must modify the EQL rules that are configured to use cross-cluster search. This updates the rule’s API key to usesuperuserprivileges and allows the rule to use cross-cluster search. -
Add an EQL statement used to detect alerts.
For example, the following rule detects when
msxsl.exemakes an outbound network connection:-
Index patterns:
winlogbeat-*Winlogbeat ships Windows events to Elastic Security.
-
EQL query:
sequence by process.entity_id
  [process
    where event.type in ("start", "process_started")
    and process.name == "msxsl.exe"]
  [network
    where event.type == "connection"
    and process.name == "msxsl.exe"
    and network.direction == "outgoing"]
Searches the
winlogbeat-*indices for sequences of amsxsl.exeprocess start event followed by an outbound network connection event that was started by themsxsl.exeprocess.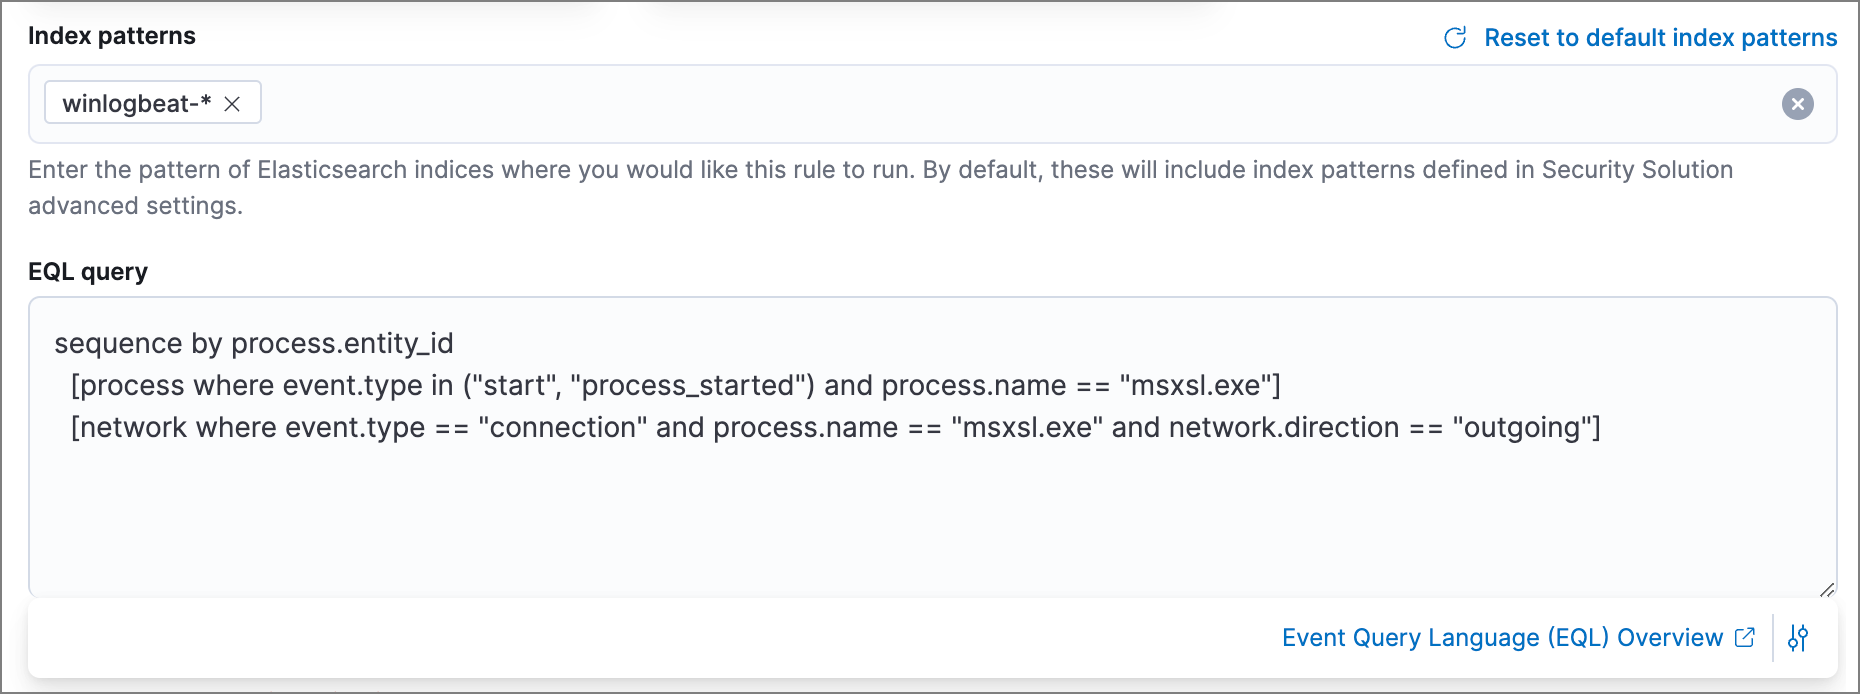
For sequence events, the Elastic Security app generates a single alert when all events listed in the sequence are detected. To see the matched sequence events in more detail, you can view the alert in the Timeline, and, if all events came from the same process, open the alert in Analyze Event view.
-
-
-
(Optional) Click the EQL settings icon (
 ) to configure additional fields used by EQL search:
-
Event category field: Contains the event classification, such as
process,file, ornetwork. This field is typically mapped as a field type in the keyword family. Defaults to theevent.categoryECS field. - Tiebreaker field: Sets a secondary field for sorting events (in ascending, lexicographic order) if they have the same timestamp.
-
Timestamp field: Contains the event timestamp used for sorting a sequence of events. This is different from the Timestamp override advanced setting, which is used for querying events within a range. Defaults to the
@timestampECS field.
-
Event category field: Contains the event classification, such as
- Click Continue to configure basic rule settings.
Create an indicator match rule
editElastic Security provides limited support for indicator match rules. See Limited support for indicator match rules for more information.
-
To create a rule that searches for events whose specified field value matches the specified indicator field value in the indicator index patterns, select Indicator Match, then fill in the following fields:
- Source: The individual index patterns or data view that specifies what data to search.
-
Custom query: The query and filters used to retrieve the required results from the Elastic Security event indices. For example, if you want to match documents that only contain a
destination.ipaddress field, adddestination.ip : *.If you want the rule to check every field in the indices, use this wildcard expression:
*:*.You can use Kibana saved queries (
 ) and queries from saved Timelines (Import query from saved Timeline) as rule conditions.
 -
Indicator index patterns: The indicator index patterns containing field values for which you want to generate alerts. This field is automatically populated with indices specified in the
securitySolution:defaultThreatIndexadvanced setting. For more information, see Update default Elastic Security threat intelligence indices.Data in indicator indices must be ECS compatible, and so it must contain a
@timestampfield. -
Indicator index query: The query and filters used to filter the fields from
the indicator index patterns. The default query
@timestamp > "now-30d/d"searches specified indicator indices for indicators ingested during the past 30 days and rounds the start time down to the nearest day (resolves to UTC00:00:00). -
Indicator mapping: Compares the values of the specified event and indicator fields, and generates an alert if the values are identical.
Only single-value fields are supported.
To define which field values are compared from the indices add the following:
- Field: The field used for comparing values in the Elastic Security event indices.
- Indicator index field: The field used for comparing values in the indicator indices.
-
You can add
ANDandORclauses to define when alerts are generated.For example, to create a rule that generates alerts when
host.nameanddestination.ipfield values in thelogs-*orpacketbeat-*Elastic Security indices are identical to the corresponding field values in themock-threat-listindicator index, enter the rule parameters seen in the following image: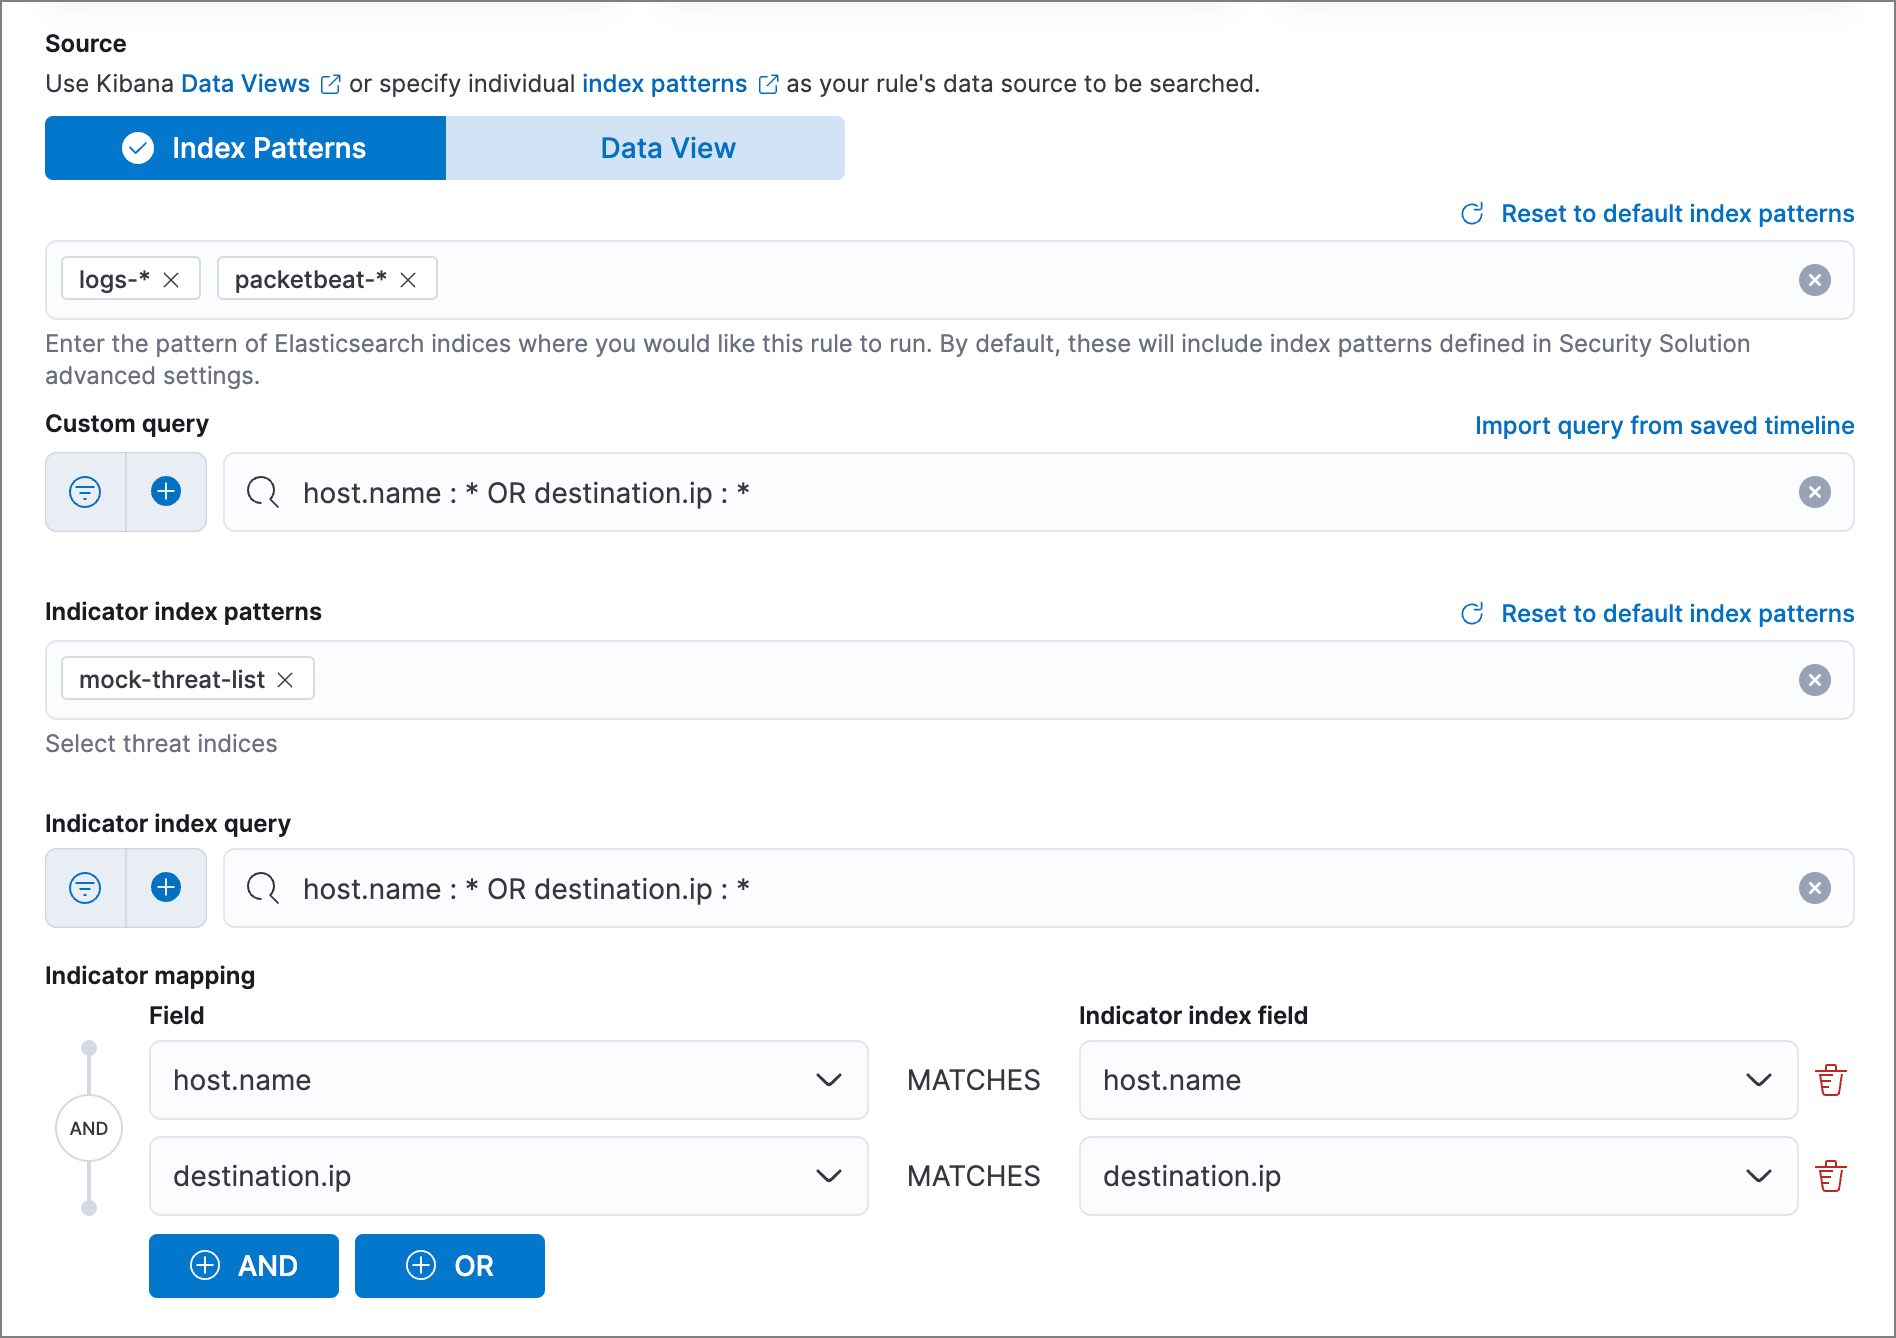
Before you create rules, create Timeline templates so they can be selected here. When alerts generated by the rule are investigated in the Timeline, Timeline query values are replaced with their corresponding alert field values.
- Click Continue to configure basic rule settings.
Create a new terms rule
edit-
To create a rule that searches for each new term detected in source documents, select New Terms, then:
- Specify what data to search by entering individual Elasticsearch index patterns or selecting an existing data view.
-
Use the filter and query fields to create the criteria used for detecting alerts.
You can use Kibana saved queries (
 ) and queries from saved Timelines (Import query from saved Timeline) as rule conditions.
 -
Use the Fields menu to select a field to check for new terms. You can also select up to three fields to detect a combination of new terms (for example, a
host.ipandhost.idthat have never been observed together before).When checking multiple fields, each unique combination of values from those fields is evaluated separately. For example, a document with
host.name: ["host-1", "host-2", "host-3"]anduser.name: ["user-1", "user-2", "user-3"]has 9 (3x3) unique combinations ofhost.nameanduser.name. A document with 11 values inhost.nameand 10 values inuser.namehas 110 (11x10) unique combinations. The new terms rule only evaluates 100 unique combinations per document, so selecting fields with large arrays of values might cause incorrect results. -
Use the History Window Size menu to specify the time range to search in minutes, hours, or days to determine if a term is new. The history window size must be larger than the rule interval plus additional look-back time, because the rule will look for terms where the only time(s) the term appears within the history window is also within the rule interval and additional look-back time.
For example, if a rule has an interval of 5 minutes, no additional look-back time, and a history window size of 7 days, a term will be considered new only if the time it appears within the last 7 days is also within the last 5 minutes. Configure the rule interval and additional look-back time when you set the rule’s schedule.
- Click Continue to configure basic rule settings.
Preview your rule (optional)
editYou can preview any custom or prebuilt rule to find out how noisy it will be. For a custom rule, you can then adjust the rule’s query or other settings.
To preview rules, you need the read privilege for the .preview.alerts-security.alerts-<space-id> and .internal.preview.alerts-security.alerts-<space-id>-* indices, plus All privileges for the Security feature. Refer to Detections prerequisites and requirements for more information.
Click the Rule preview button while creating or editing a rule. The preview opens in a side panel, showing a histogram and table with the alerts you can expect, based on the defined rule settings and past events in your indices.
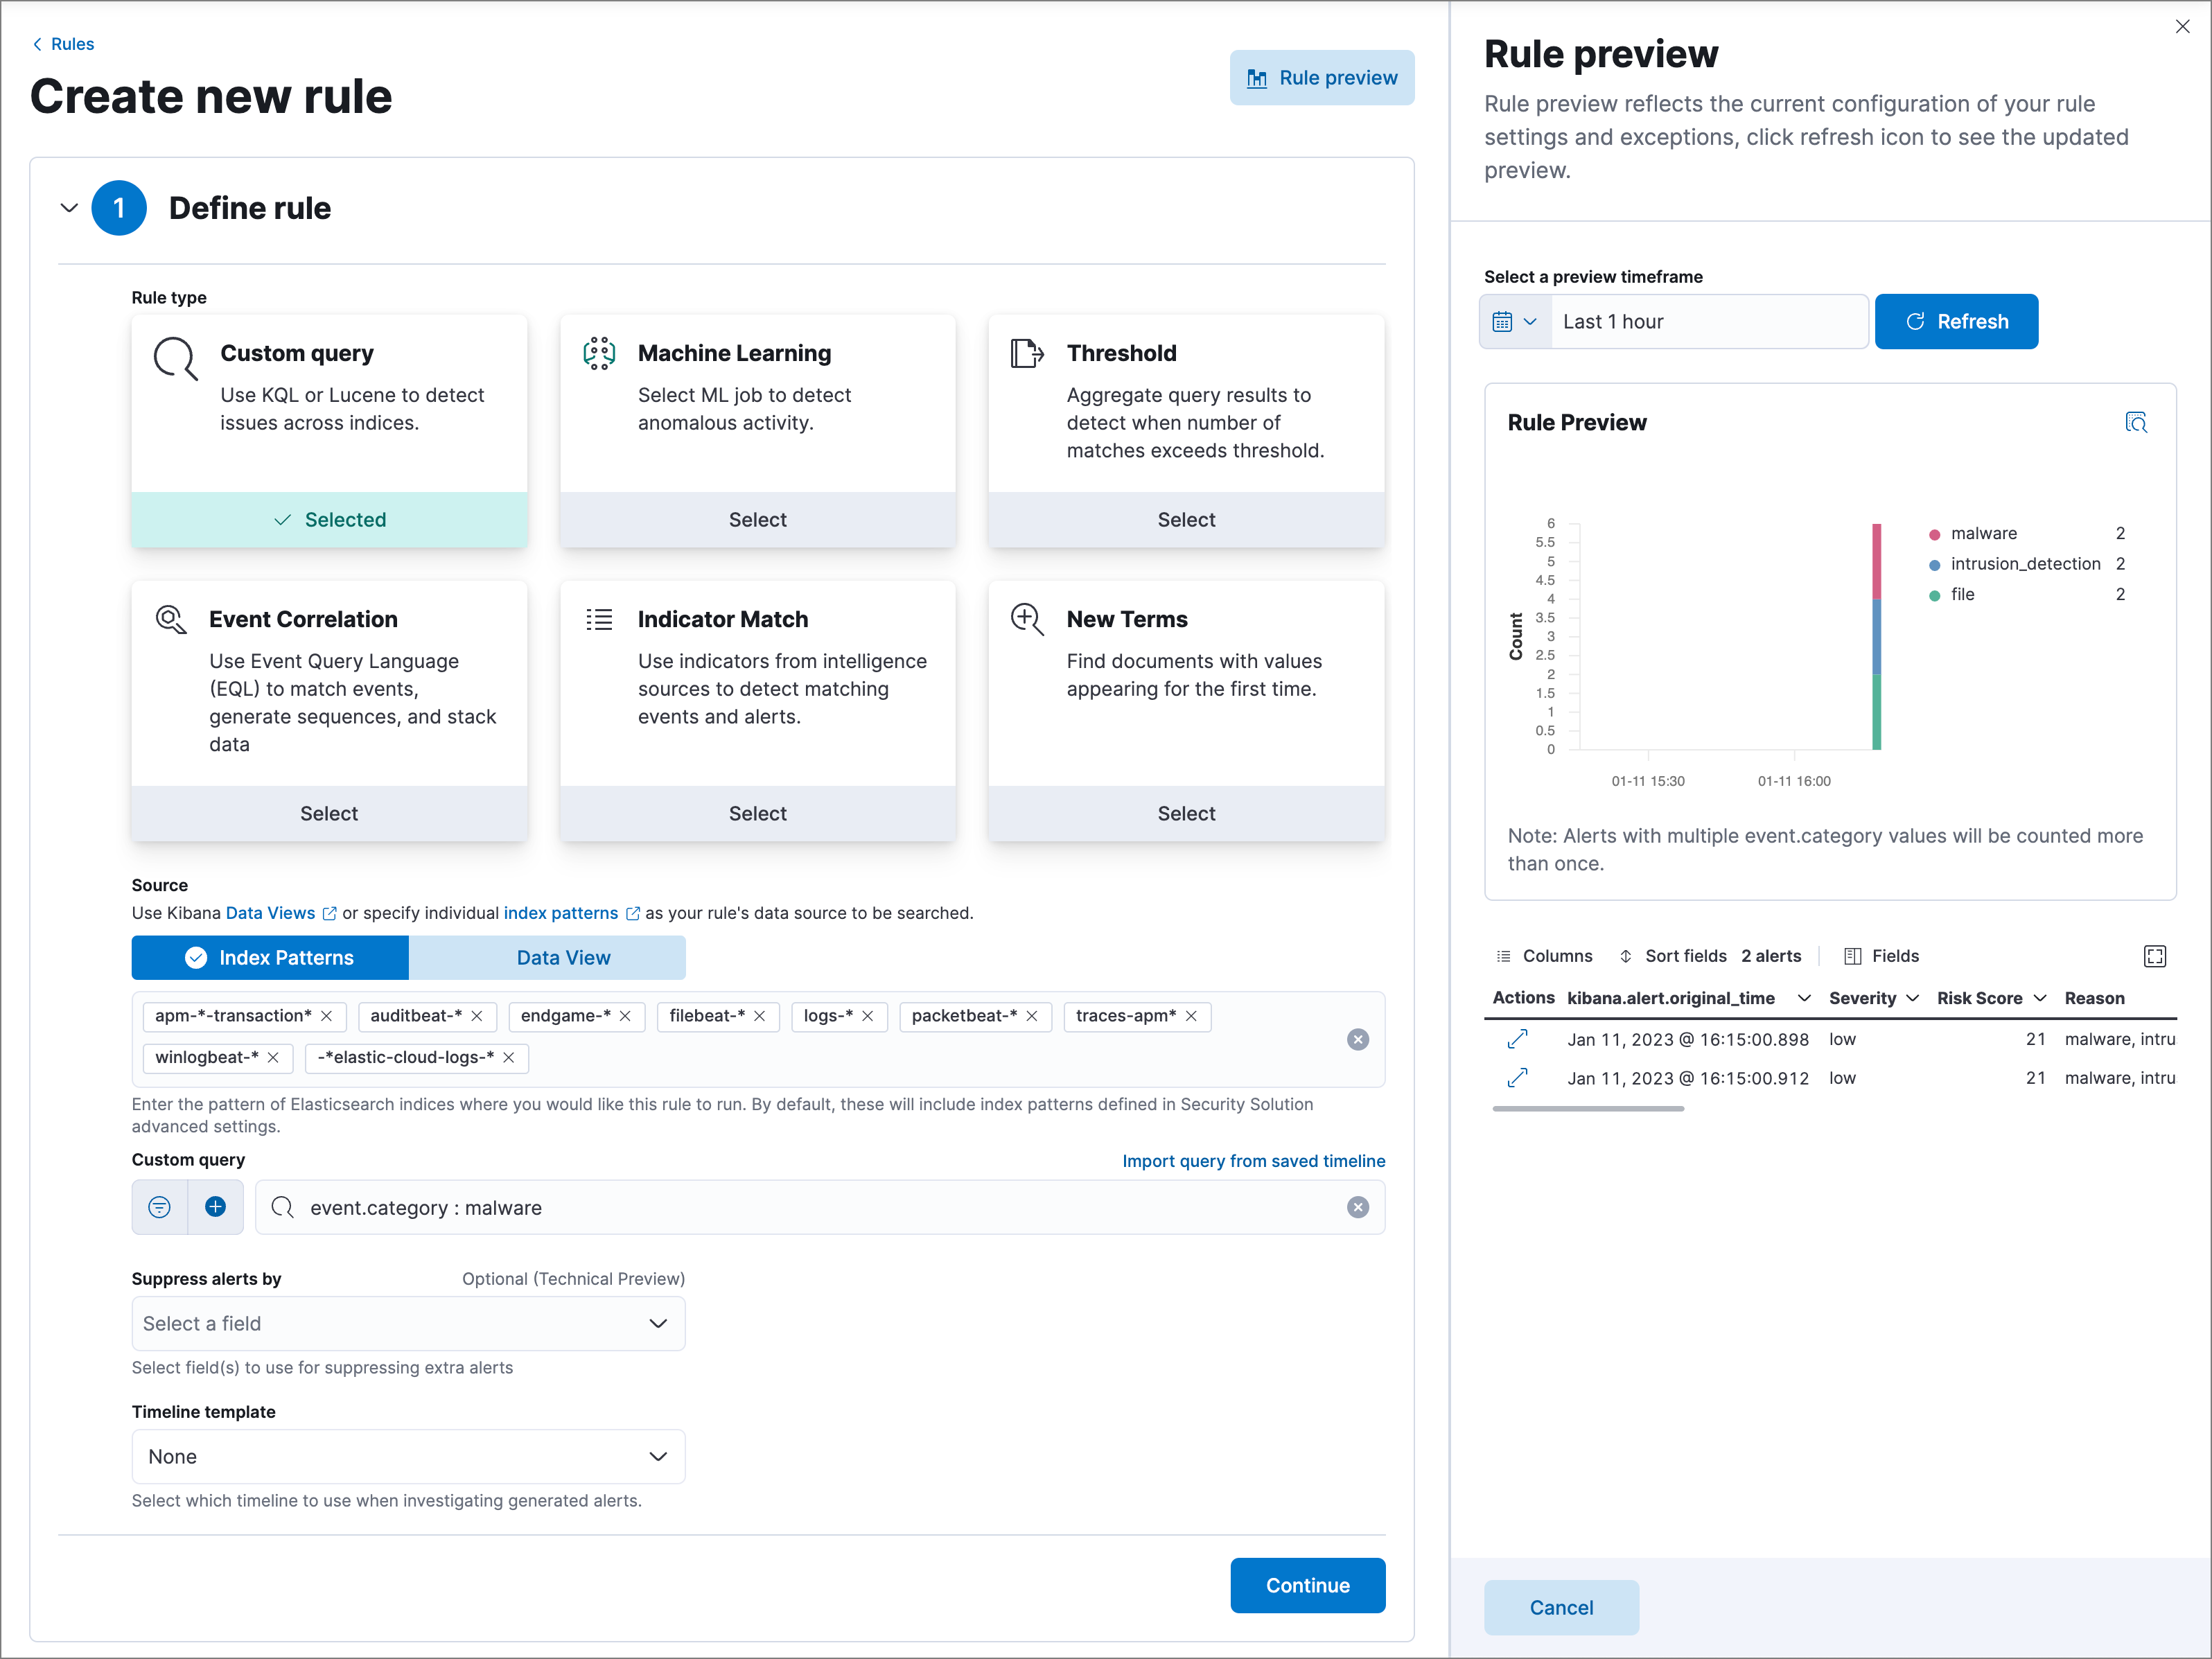
The preview also includes the effects of rule exceptions and override fields. In the histogram, alerts are stacked by event.category (or host.name for machine learning rules), and alerts with multiple values are counted more than once.
To interact with the rule preview:
-
Use the date and time picker to define the preview’s time range.
Avoid setting long time ranges with short rule intervals, or the rule preview might time out.
-
Click Refresh to update the preview.
-
When you edit the rule’s settings or the preview’s time range, the button changes from blue (
 ) to green (
 ) to indicate that the rule has been edited since the last preview.
-
For a relative time range (such as
Last 1 hour), refresh the preview to check for the latest results. (Previews don’t automatically refresh with new incoming data.)
-
When you edit the rule’s settings or the preview’s time range, the button changes from blue (
-
Click the View details icon (
 ) in the alerts table to view the details of a particular alert.
Configure basic rule settings
edit-
In the About rule pane, fill in the following fields:
- Name: The rule’s name.
- Description: A description of what the rule does.
-
Default severity: Select the severity level of alerts created by the rule:
- Low: Alerts that are of interest but generally are not considered to be security incidents. Sometimes a combination of low severity alerts can indicate suspicious activity.
- Medium: Alerts that require investigation.
- High: Alerts that require an immediate investigation.
- Critical: Alerts that indicate it is highly likely a security incident has occurred.
-
Severity override (optional): Select to use source event values to override the Default severity in generated alerts. When selected, a UI component is displayed where you can map the source event field values to severity levels. The following example shows how to map severity levels to
host.namevalues: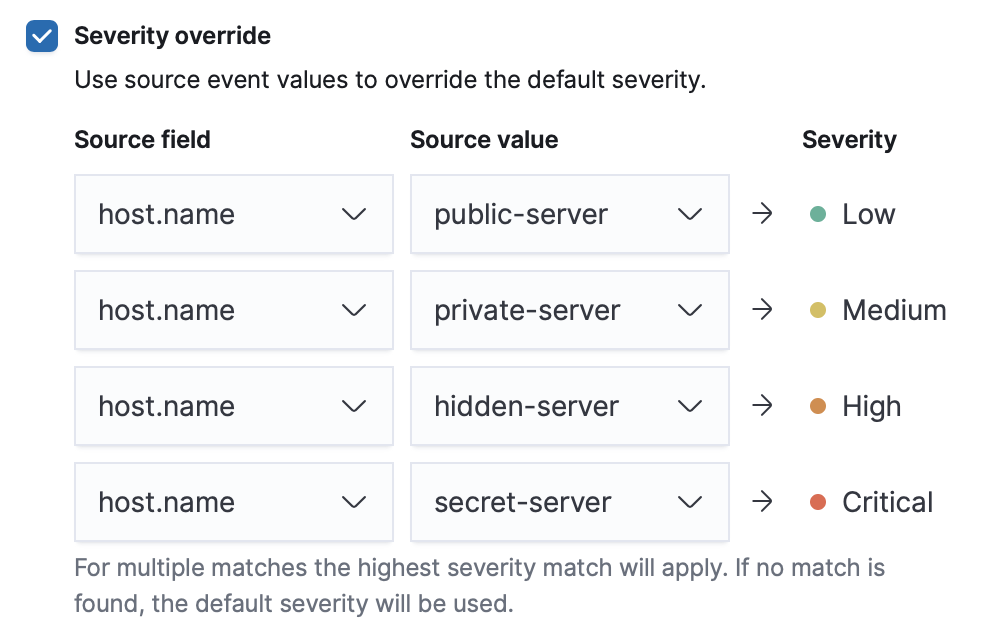
For threshold rules, not all source event values can be used for overrides; only the fields that were aggregated over (the
Group byfields) will contain data. Please also note that overrides are not supported for event correlation rules. -
Default risk score: A numerical value between 0 and 100 that indicates the risk of events detected by the rule. This setting changes to a default value when you change the Severity level, but you can adjust the risk score as needed. General guidelines are:
-
0-21represents low severity. -
22-47represents medium severity. -
48-73represents high severity. -
74-100represents critical severity.
-
-
Risk score override (optional): Select to use a source event value to override the Default risk score in generated alerts. When selected, a UI component is displayed to select the source field used for the risk score. For example, if you want to use the source event’s risk score in alerts:
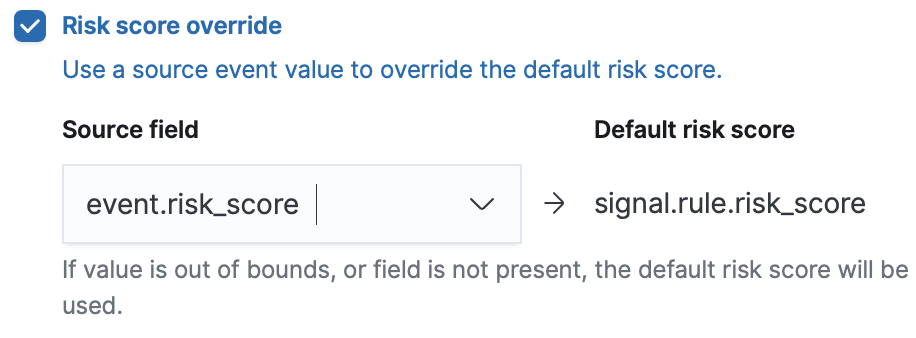
For threshold rules, not all source event values can be used for overrides; only the fields that were aggregated over (the
Group byfields) will contain data. - Tags (optional): Words and phrases used to categorize, filter, and search the rule.
-
Continue with one of the following:
Configure advanced rule settings (optional)
edit-
Click Advanced settings and fill in the following fields where applicable:
- Reference URLs (optional): References to information that is relevant to the rule. For example, links to background information.
- False positive examples (optional): List of common scenarios that may produce false-positive alerts.
- MITRE ATT&CKTM threats (optional): Add relevant MITRE framework tactics, techniques, and subtechniques.
- Investigation guide (optional): Information for analysts investigating alerts created by the rule.
- Author (optional): The rule’s authors.
- License (optional): The rule’s license.
-
Elastic endpoint exceptions (optional): Adds all Elastic Endpoint Security rule exceptions to this rule (refer to Add Elastic Endpoint exceptions to learn more about adding endpoint exceptions).
If you select this option, you can add Endpoint exceptions on the Rule details page. Additionally, all future exceptions added to the Endpoint Security rule also affect this rule.
- Building block (optional): Select to create a building-block rule. By default, alerts generated from a building-block rule are not displayed in the UI. See About building block rules for more information.
-
Indicator prefix override: Define the location of indicator data within the structure of indicator documents. When the indicator match rule executes, it queries specified indicator indices and references this setting to locate fields with indicator data. This data is used to enrich indicator match alerts with metadata about matched threat indicators. The default value for this setting is
threat.indicator.If your threat indicator data is at a different location, update this setting accordingly to ensure alert enrichment can still be performed.
-
Rule name override (optional): Select a source event field to use as the rule name in the UI (Alerts table). This is useful for exposing, at a glance, more information about an alert. For example, if the rule generates alerts from Suricata, selecting
event.actionlets you see what action (Suricata category) caused the event directly in the Alerts table.For threshold rules, not all source event values can be used for overrides; only the fields that were aggregated over (the
Group byfields) will contain data. -
Timestamp override (optional): Select a source event timestamp field. When selected, the rule’s query uses the selected field, instead of the default
@timestampfield, to search for alerts. This can help reduce missing alerts due to network or server outages. Specifically, if your ingest pipeline adds a timestamp when events are sent to Elasticsearch, this avoids missing alerts due to ingestion delays. However, if you know your data source has an inaccurate@timestampvalue, it is recommended you select the Do not use @timestamp as a fallback timestamp field option to ignore the@timestampfield entirely.The Microsoft and Google Workspace Filebeat modules have an
event.ingestedtimestamp field that can be used instead of the default@timestampfield.
-
Click Continue. The Schedule rule pane is displayed.
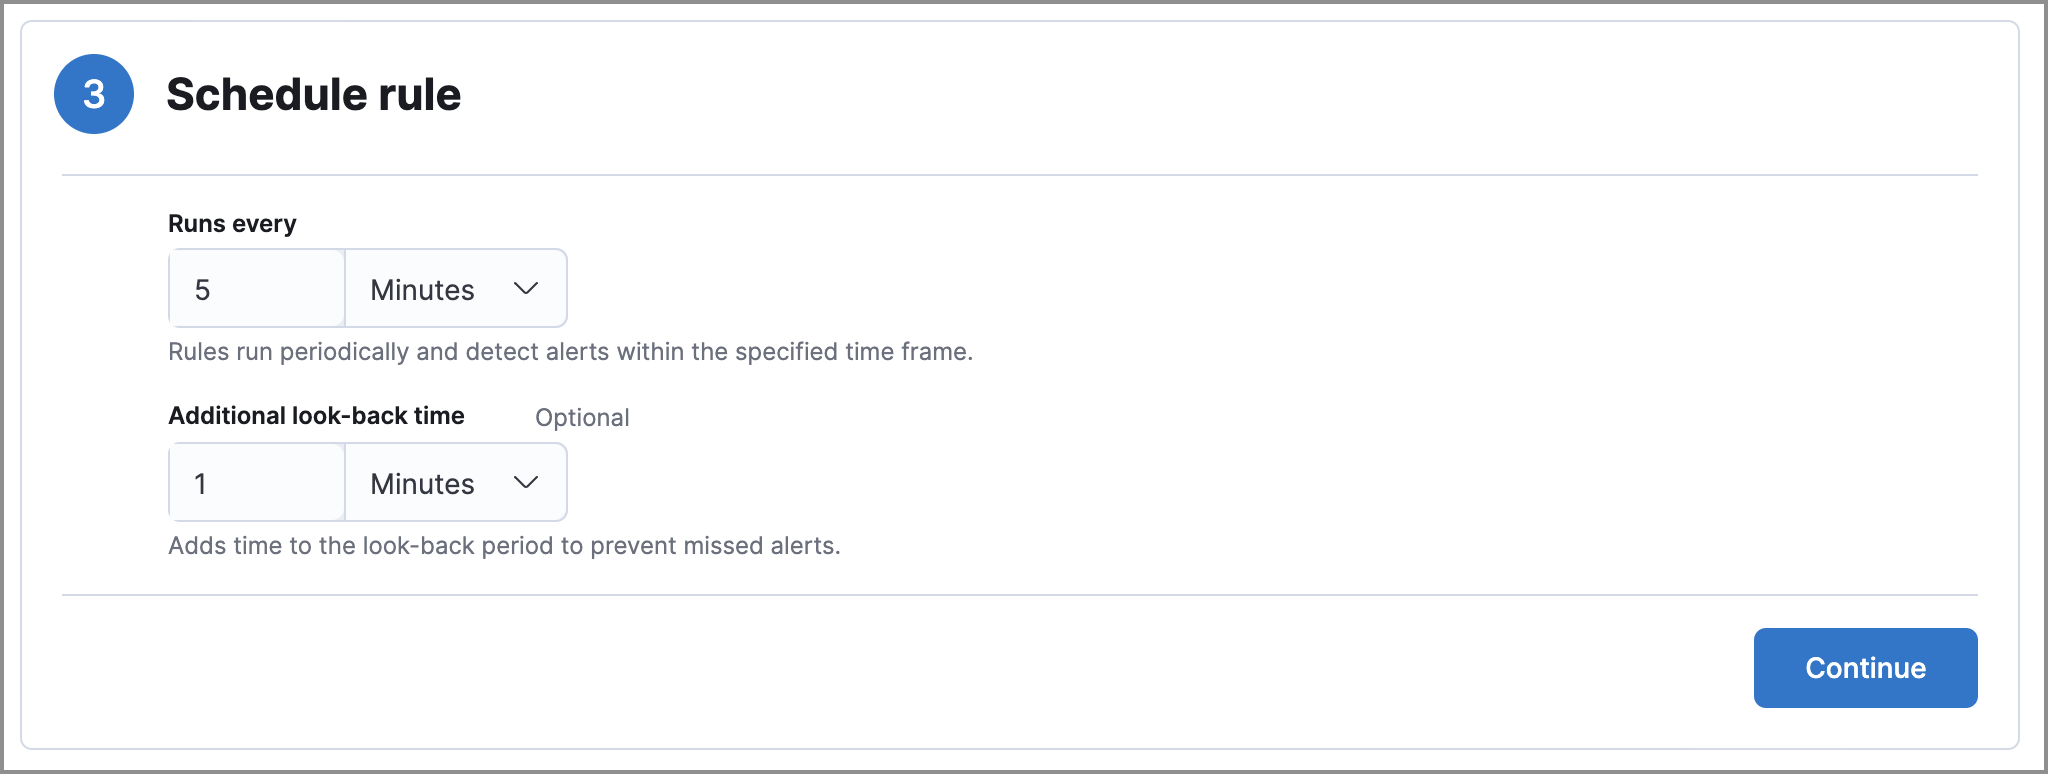
- Continue with setting the rule’s schedule.
Set the rule’s schedule
edit- Select how often the rule runs.
-
Optionally, add
Additional look-back timeto the rule. When defined, the rule searches indices with the additional time.For example, if you set a rule to run every 5 minutes with an additional look-back time of 1 minute, the rule runs every 5 minutes but analyzes the documents added to indices during the last 6 minutes.
It is recommended to set the
Additional look-back timeto at least 1 minute. This ensures there are no missing alerts when a rule does not run exactly at its scheduled time.Elastic Security prevents duplication. Any duplicate alerts that are discovered during the
Additional look-back timeare not created. -
Click Continue. The Rule actions pane is displayed.
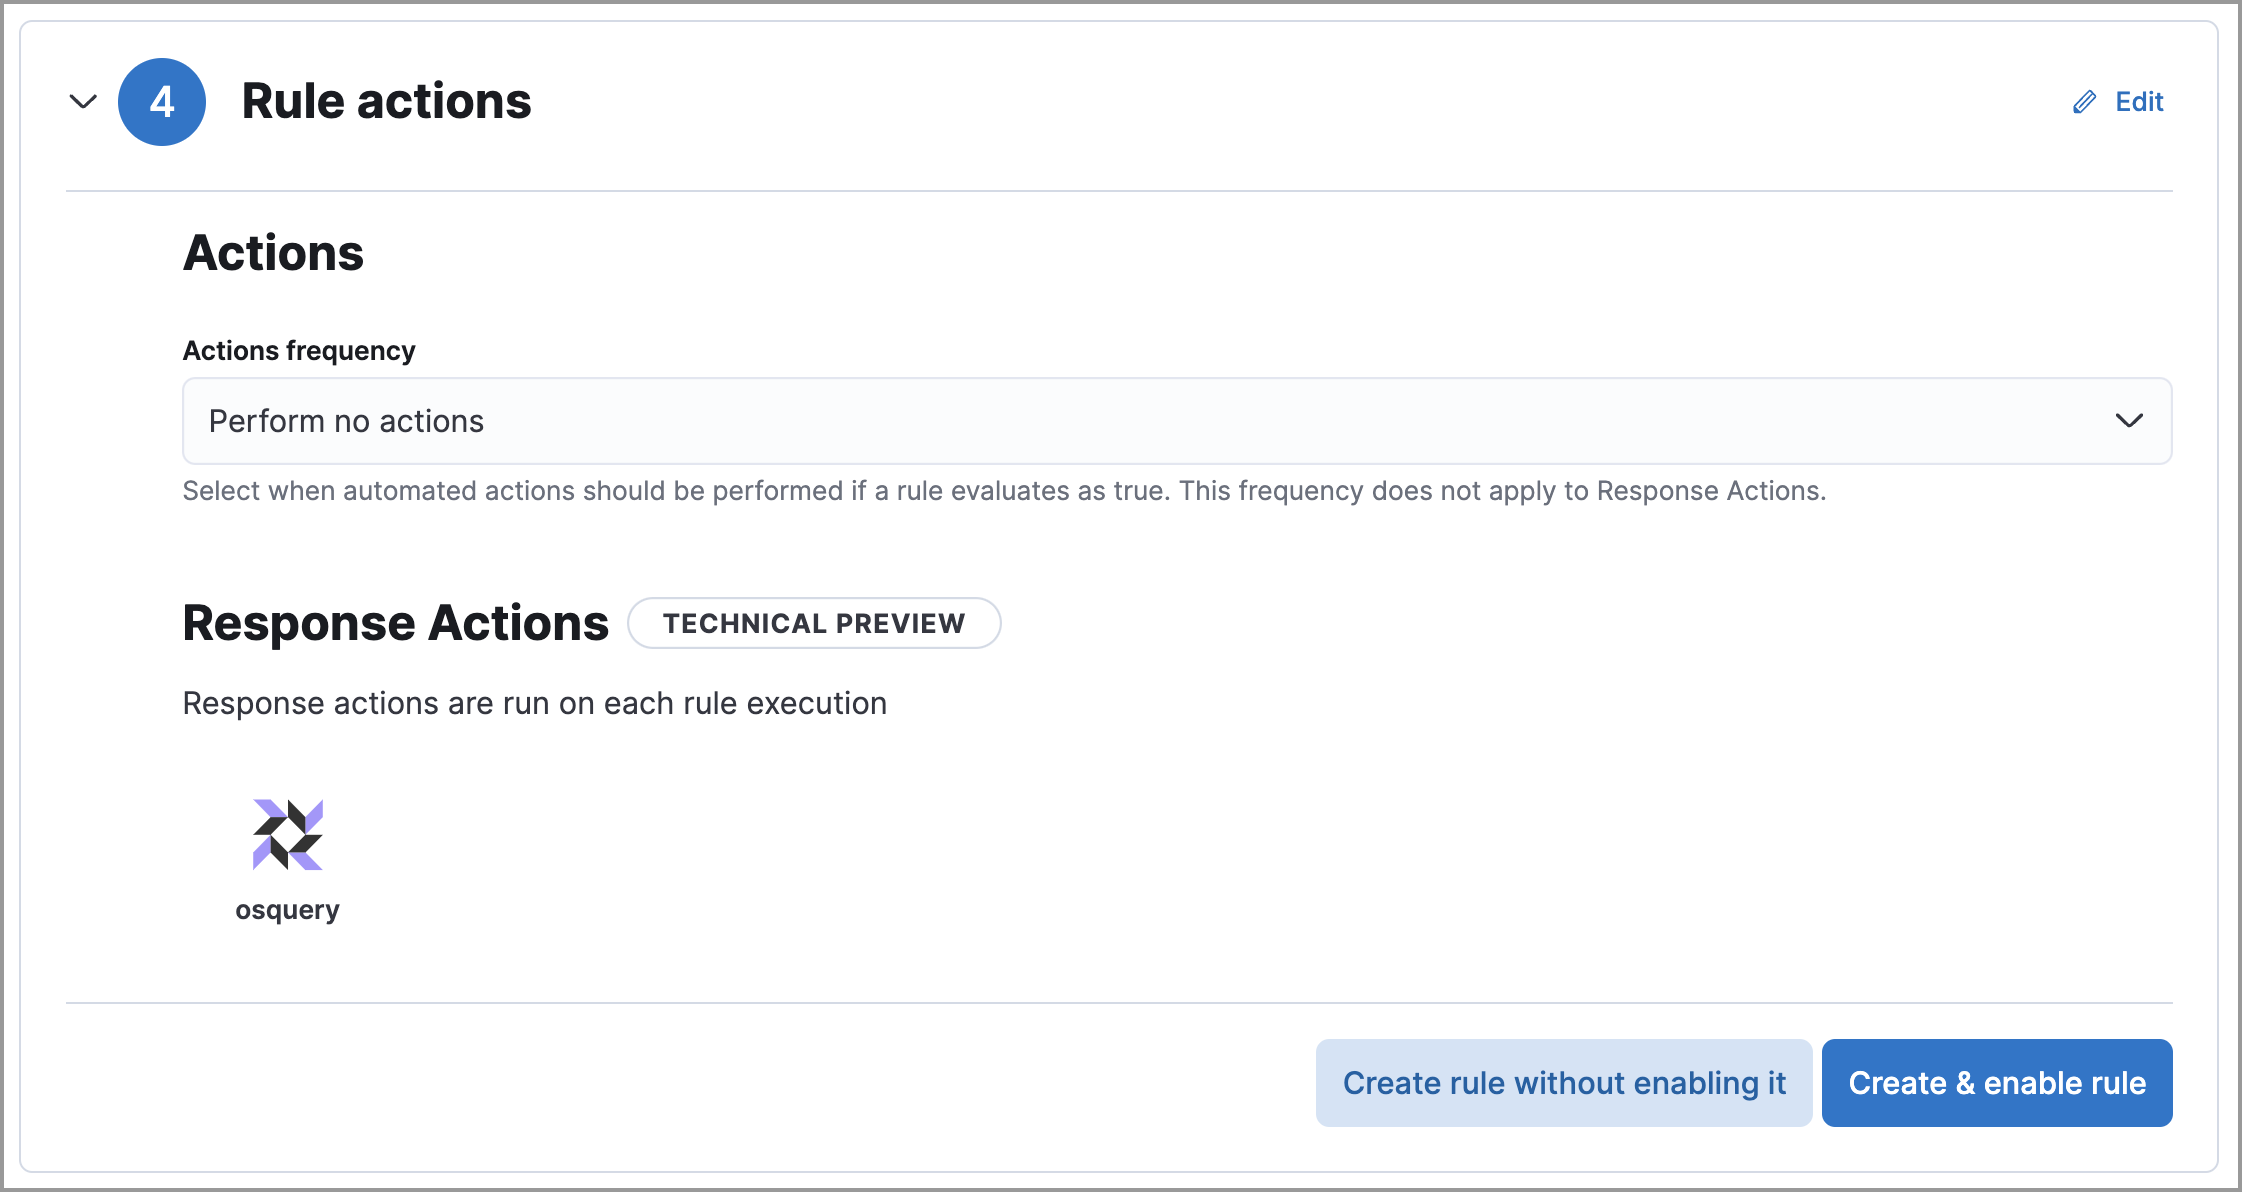
-
Do either of the following:
- Continue onto setting up alert notifications and Response Actions (optional).
- Create the rule (with or without activation).
Set up alert notifications (optional)
editUse Kibana Actions to set up notifications sent via other systems when alerts are generated.
To use Kibana Actions for alert notifications, you need the appropriate license and your role needs All privileges for the Action and Connectors feature. For more information, see Cases prerequisites.
-
Set when to send notifications:
- On each rule execution: Sends a notification every time new alerts are generated.
- Hourly: Sends a notification every hour.
- Daily: Sends a notification every day.
-
Weekly: Sends a notification every week.
Notifications are sent only when new alerts are generated.
The available connector types are displayed.
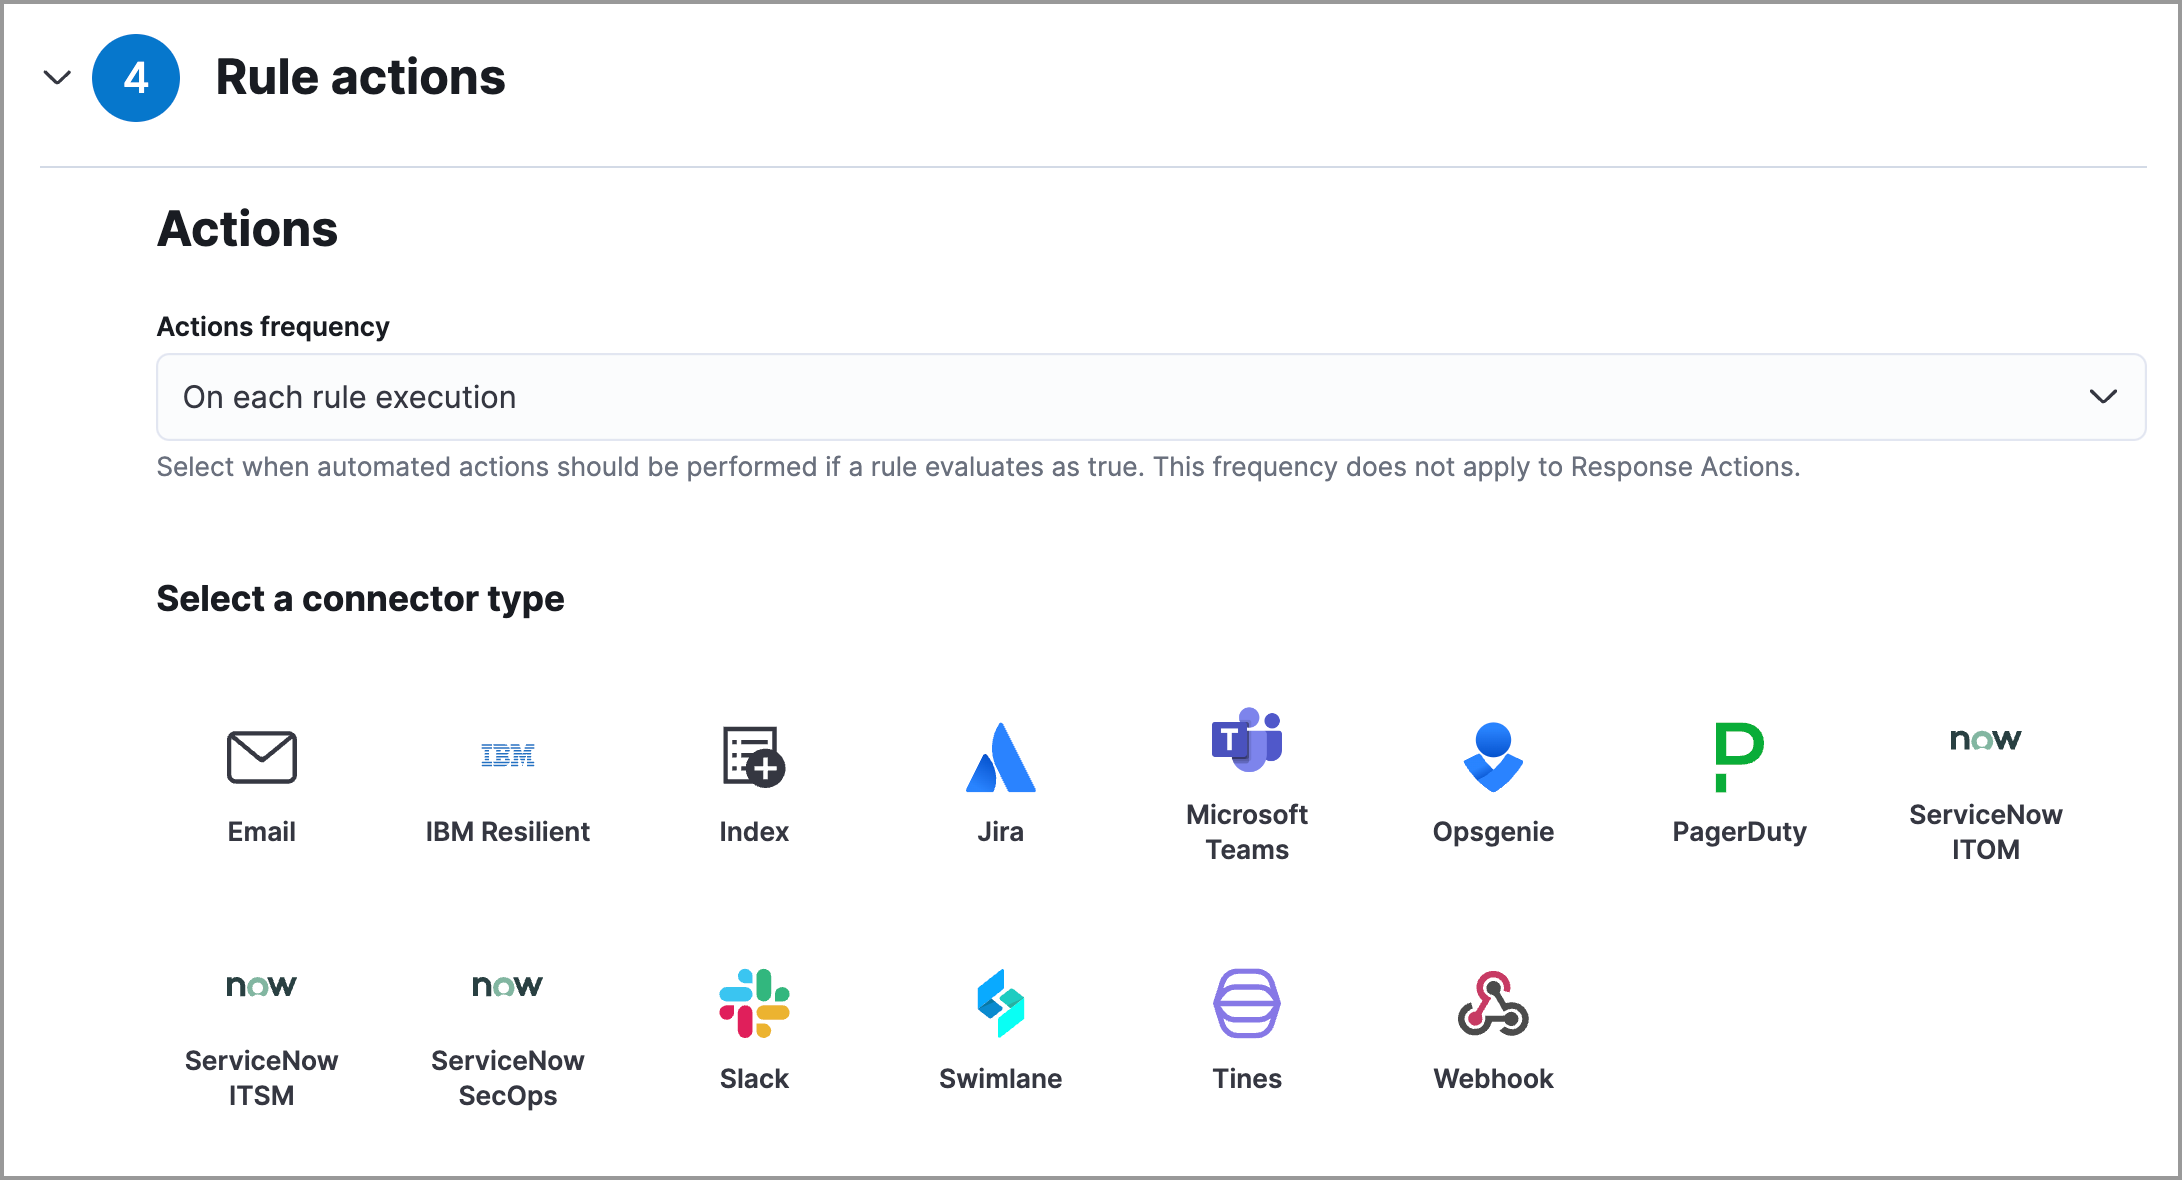
-
Select the required connector type, which determines how notifications are sent. For example, if you select the Jira connector, notifications are sent to your Jira system.
Each action type requires a connector. Connectors store the information required to send the notification from the external system. You can configure connectors while creating the rule or on the Kibana Rules and Connectors page (Stack Management → Rules and Connectors → Connectors). For more information, see Action and connector types.
The selected connector type fields are displayed (Jira example).
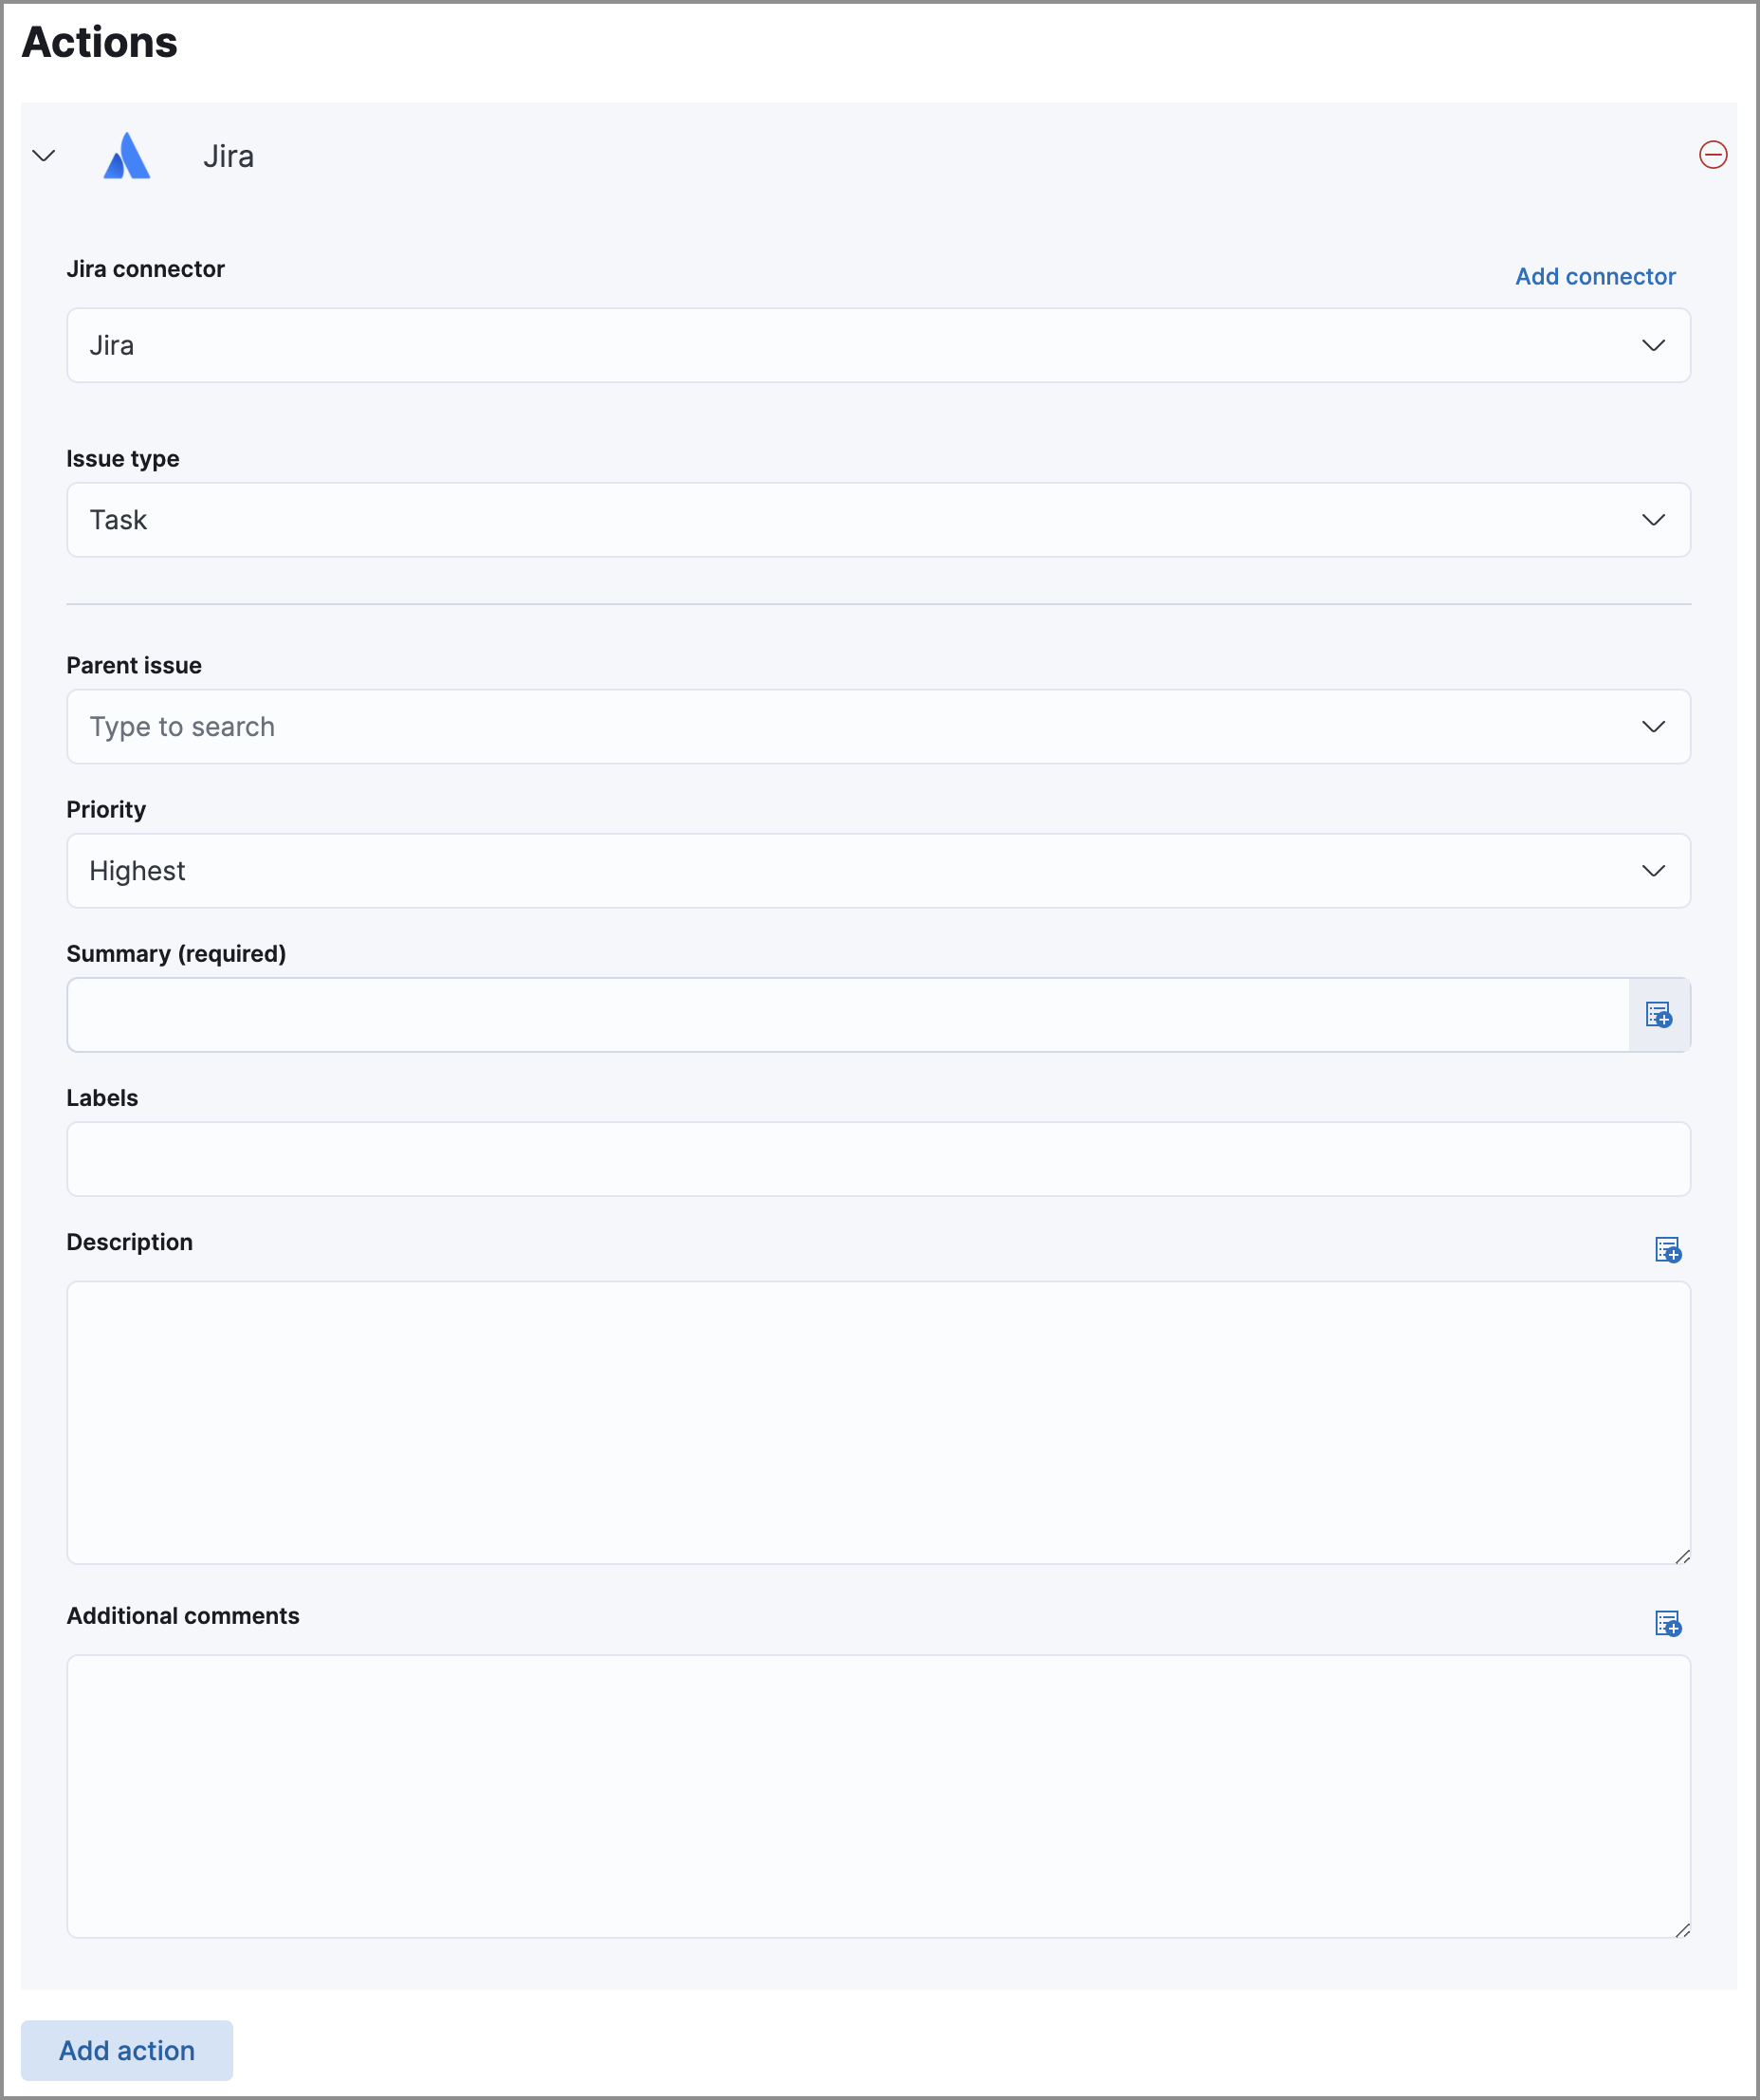
-
Fill in the fields for the selected connector types. For all connector types, click
the icon above the
Messagefield to add placeholders for rule and alert details to the notifications. -
Create the rule with or without activation.
When you activate a rule, it is queued, and its schedule is determined by its initial run time. For example, if you activate a rule that runs every 5 minutes at 14:03 but it does not run until 14:04, it will run again at 14:09.
Alert notification placeholders
editYou can use mustache syntax to add the following placeholders to rule action fields:
-
{{alert.actionGroup}}: Action group of the alert that scheduled actions for the rule -
{{alert.actionGroupName}}: Human readable name of the action group of the alert that scheduled actions for the rule -
{{alert.actionSubgroup}}: Action subgroup of the alert that scheduled actions for the rule -
{{alert.id}}: ID of the alert that scheduled actions for the rule -
{{context.alerts}}: Array of detected alerts -
{{{context.results_link}}}: URL to the alerts in Kibana -
{{context.rule.anomaly_threshold}}: Anomaly threshold score above which alerts are generated (machine learning rules only) -
{{context.rule.description}}: Rule description -
{{context.rule.false_positives}}: Rule false positives -
{{context.rule.filters}}: Rule filters (query rules only) -
{{context.rule.id}}: Unique rule ID returned after creating the rule -
{{context.rule.index}}: Indices rule runs on (query rules only) -
{{context.rule.language}}: Rule query language (query rules only) -
{{context.rule.machine_learning_job_id}}: ID of associated machine learning job (machine learning rules only) -
{{context.rule.max_signals}}: Maximum allowed number of alerts per rule execution -
{{context.rule.name}}: Rule name -
{{context.rule.query}}: Rule query (query rules only) -
{{context.rule.references}}: Rule references -
{{context.rule.risk_score}}: Default rule risk score -
{{context.rule.rule_id}}: Generated or user-defined rule ID that can be used as an identifier across systems -
{{context.rule.saved_id}}: Saved search ID -
{{context.rule.severity}}: Default rule severity -
{{context.rule.threat}}: Rule threat framework -
{{context.rule.threshold}}: Rule threshold values (threshold rules only) -
{{context.rule.timeline_id}}: Associated Timeline ID -
{{context.rule.timeline_title}}: Associated Timeline name -
{{context.rule.type}}: Rule type -
{{context.rule.version}}: Rule version -
{{date}}`: Date the rule scheduled the action -
{{kibanaBaseUrl}}: Configuredserver.publicBaseUrlvalue, or empty string if not configured -
{{rule.id}}: ID of the rule -
{{rule.name}}: Name of the rule -
{{rule.spaceId}}: Space ID of the rule -
{{rule.tags}}: Tags of the rule -
{{rule.type}}: Type of rule -
{{state.signals_count}}: Number of alerts detected
The {{context.rule.severity}} and {{context.rule.risk_score}}
placeholders contain the rule’s default values even when the Severity override
and Risk score override options are used.
Alert placeholder examples
editTo understand which fields to parse, see the Detections API to view the JSON representation of rules.
Example using {{context.rule.filters}} to output a list of filters:
{{#context.rule.filters}}
{{^meta.disabled}}{{meta.key}} {{#meta.negate}}NOT {{/meta.negate}}{{meta.type}} {{^exists}}{{meta.value}}{{meta.params.query}}{{/exists}}{{/meta.disabled}}
{{/context.rule.filters}}
Example using {{context.alerts}} as an array, which contains each alert generated since the last time the action was executed:
{{#context.alerts}}
Detection alert for user: {{user.name}}
{{/context.alerts}}
Example using the mustache "current element" notation {{.}} to output all the rule references in the signal.rule.references array:
{{#signal.rule.references}} {{.}} {{/signal.rule.references}}
Set up response actions (optional)
editUse Response Actions to set up additional functionality that will run whenever a rule executes.
This functionality is in technical preview and may be changed or removed in a future release. Elastic will work to fix any issues, but features in technical preview are not subject to the support SLA of official GA features.
The Osquery Response Action allows you to include live Osquery queries with a custom query rule. When an alert is generated, Osquery automatically collects data on the system related to the alert. Refer to Add Osquery Response Actions to learn more.
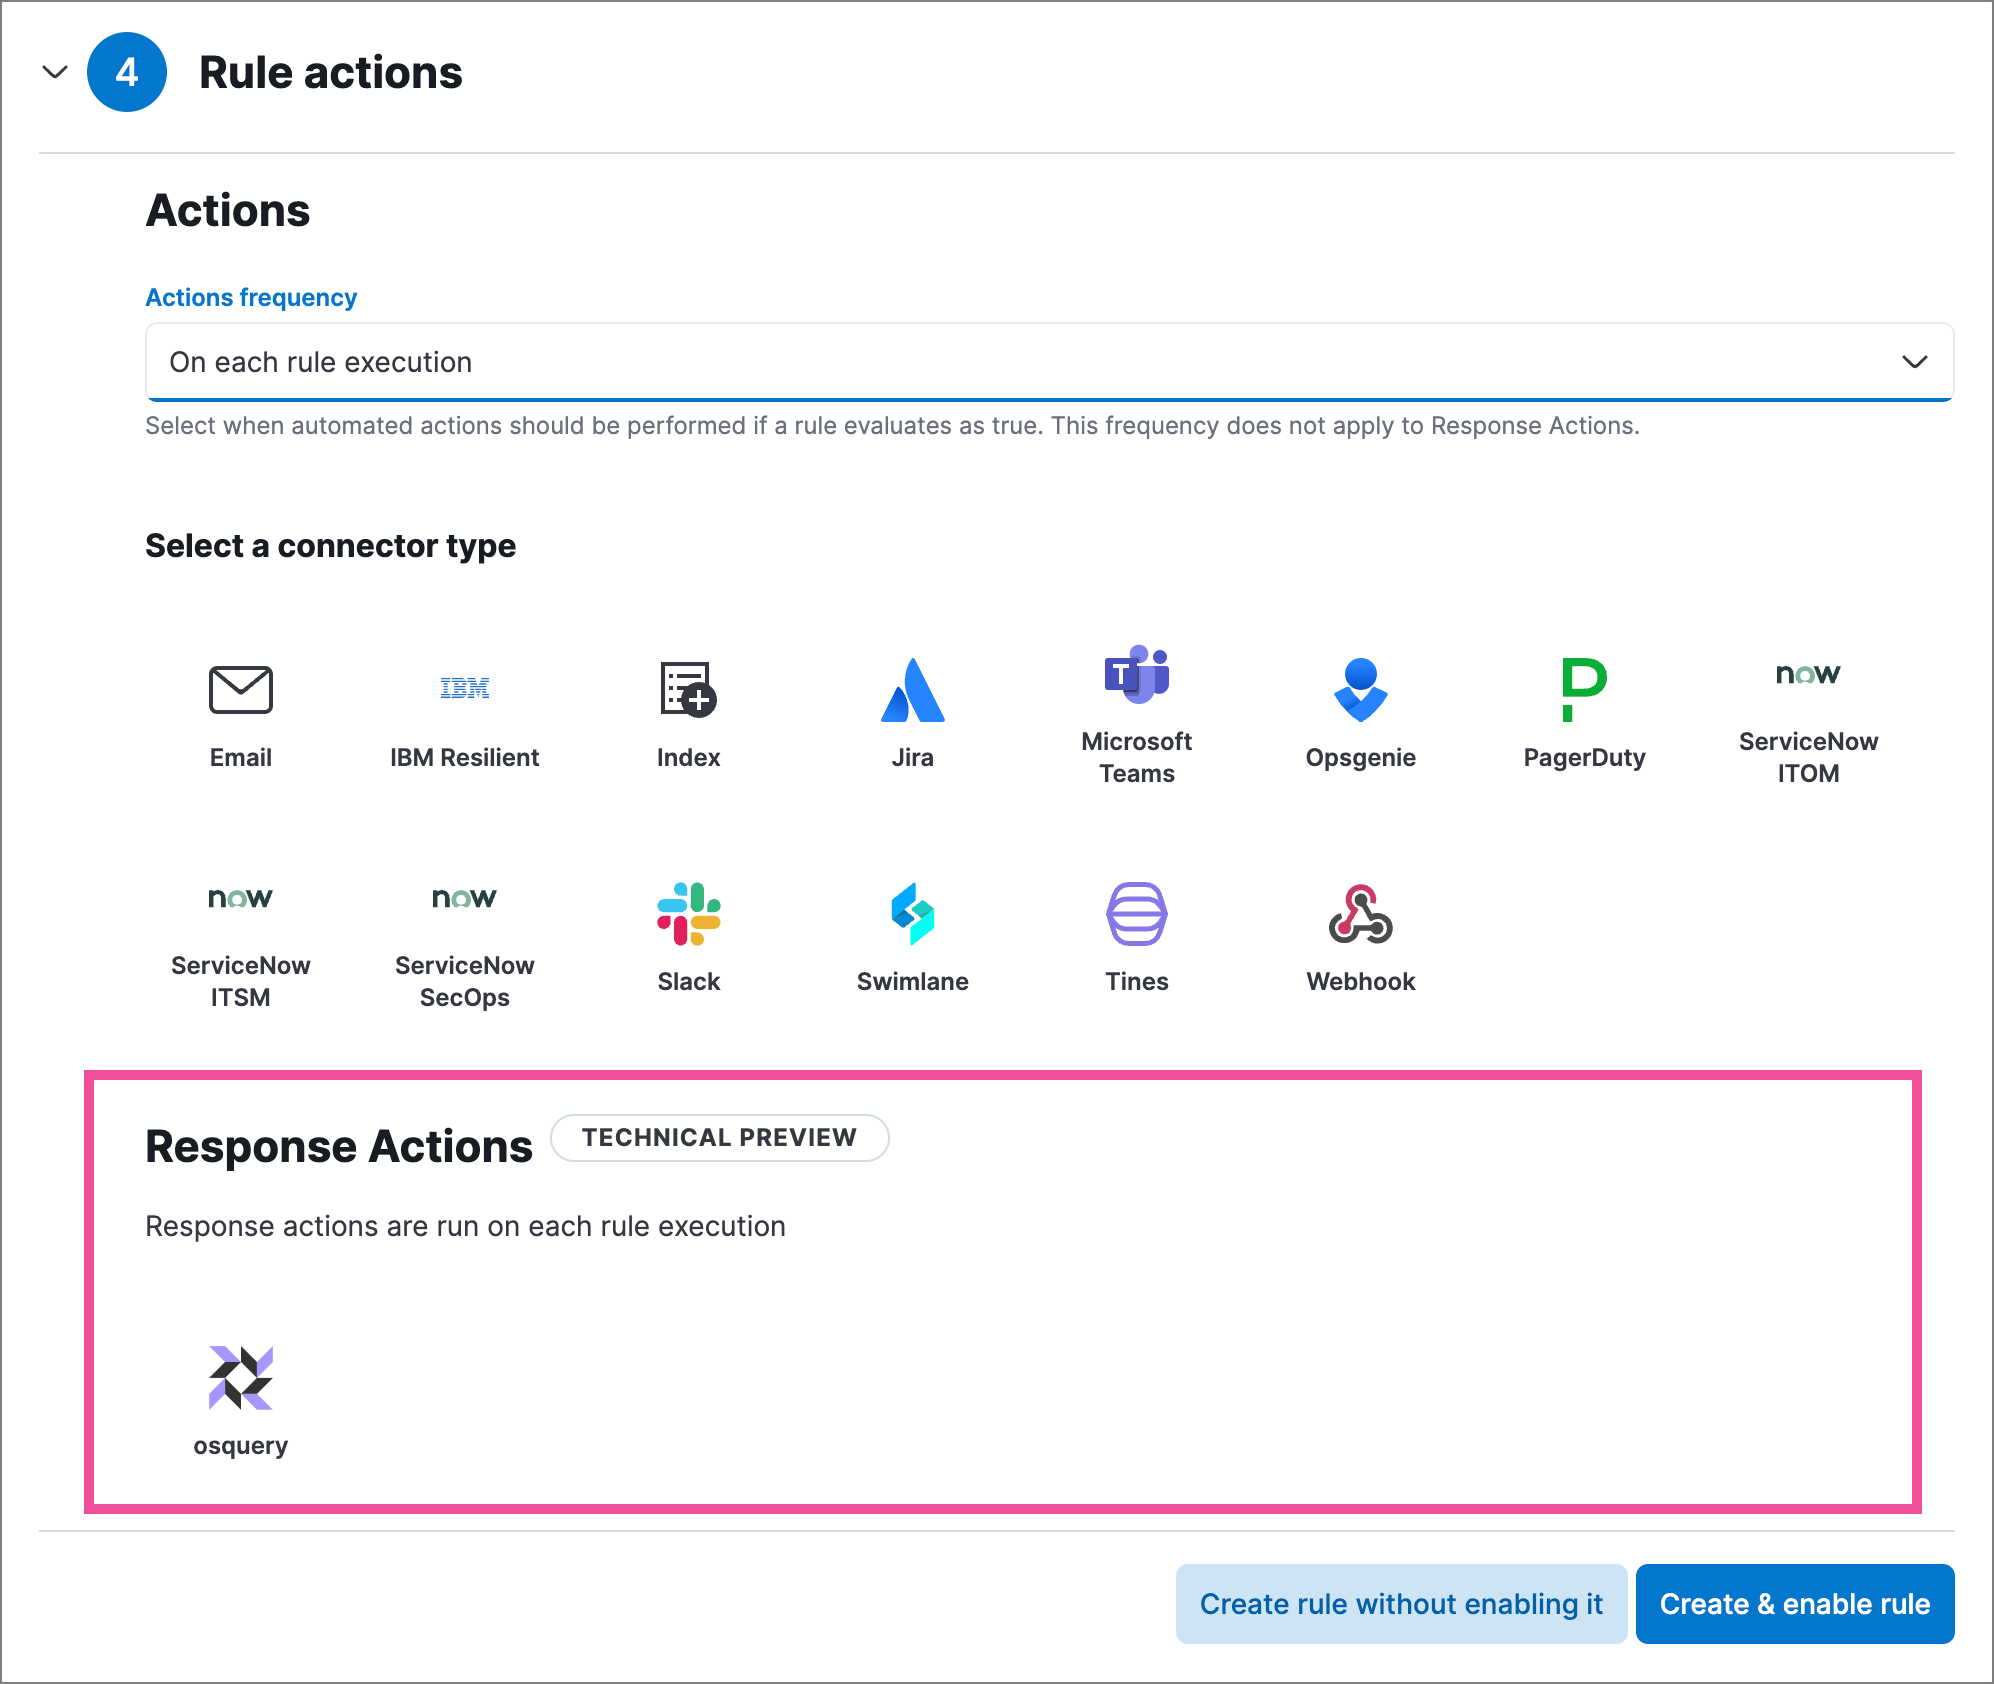
Use value lists with indicator match rules
editWhile there are numerous ways you can add data into indicator indices, you can use value lists as the indicator match index in an indicator match rule. Take the following scenario, for example:
You uploaded a value list of known ransomware domains, and you want to be notified if any of those domains matches a value contained in a domain field in your security event index pattern.
- Upload a value list of indicators.
-
Create an indicator match rule and fill in the following fields:
- Index patterns: The Elastic Security event indices on which the rule runs.
-
Custom query: The query and filters used to retrieve the required results from the Elastic Security event indices (e.g.,
host.domain :*). -
Indicator index patterns: Value lists are stored in a hidden index called
.items-<Kibana space>. Enter the name of the Kibana space in which this rule will run in this field. -
Indicator index query: Enter the value
list_id :, followed by the name of the value list you want to use as your indicator index (uploaded in Step 1 above). -
Indicator mapping
- Field: Enter the field from the Elastic Security event indices to be used for comparing values.
-
Indicator index field: Enter the type of value list you created (i.e.,
keyword,text, orIP).If you don’t remember this information, go to Manage → Rules → Import value lists. Locate the appropriate value list and note the field in the corresponding
Typecolumn. (Examples include keyword, text, and IP.)
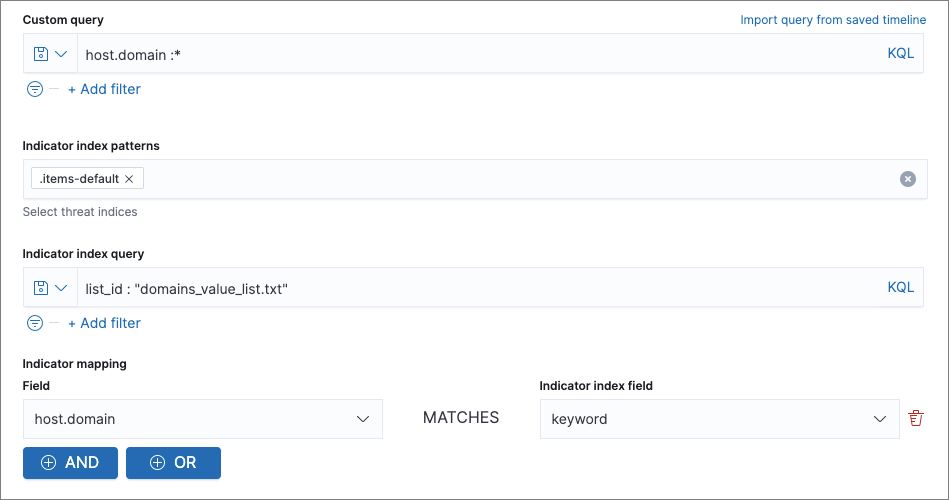
On this page
- Authorization
- Data views and index patterns
- Select rule type and scope
- Create a machine learning rule
- Create a custom query rule
- Create a threshold rule
- Create an event correlation rule
- Create an indicator match rule
- Create a new terms rule
- Preview your rule (optional)
- Configure basic rule settings
- Configure advanced rule settings (optional)
- Set the rule’s schedule
- Set up alert notifications (optional)
- Alert notification placeholders
- Alert placeholder examples
- Set up response actions (optional)
- Use value lists with indicator match rules