Explore and analyze data with Kibana
The Elasticsearch platform and its UI, also known as Kibana, provide a comprehensive suite of tools to help you search, interact with, explore, and analyze your data effectively. These features empower you to gain deep insights, uncover trends, and take actionable steps based on your findings. This page is an overview of the key capabilities.
Elasticsearch’s robust query capabilities enable you to retrieve specific data from your datasets. Using the Query DSL (Domain Specific Language), you can build powerful, flexible queries that support:
- Full-text search
- Boolean logic
- Fuzzy matching
- Proximity searches
- Semantic search
- …and more.
These tools simplify refining searches and pinpointing relevant information in real-time.
Aggregations provide advanced data analysis, enabling you to extract actionable insights. With aggregations, you can calculate statistical metrics (for example, sums, averages, medians), group data into buckets (histograms, terms, and so on), or perform nested and multi-level analyses. Aggregations transform raw data into structured insights with ease.
The geospatial capabilities enable analysis of location-based data, including distance calculations, polygon and bounding box queries, and geohash grid aggregations. This functionality is necessary for logistics, real estate, and IoT industries, where location matters.
Elasticsearch integrates machine learning for proactive analytics, helping you to:
- Detect anomalies in time-series data
- Forecast future trends
- Analyze seasonal patterns
- Perform powerful NLP operations such as semantic search
Machine learning models simplify complex predictive tasks, unlocking new opportunities for optimization.
Scripting makes custom data manipulation and transformation possible during search and aggregation processes. Using scripting languages like Painless, you can calculate custom metrics, perform conditional logic, or adjust data dynamically in search time. This flexibility ensures tailored insights specific to your needs.
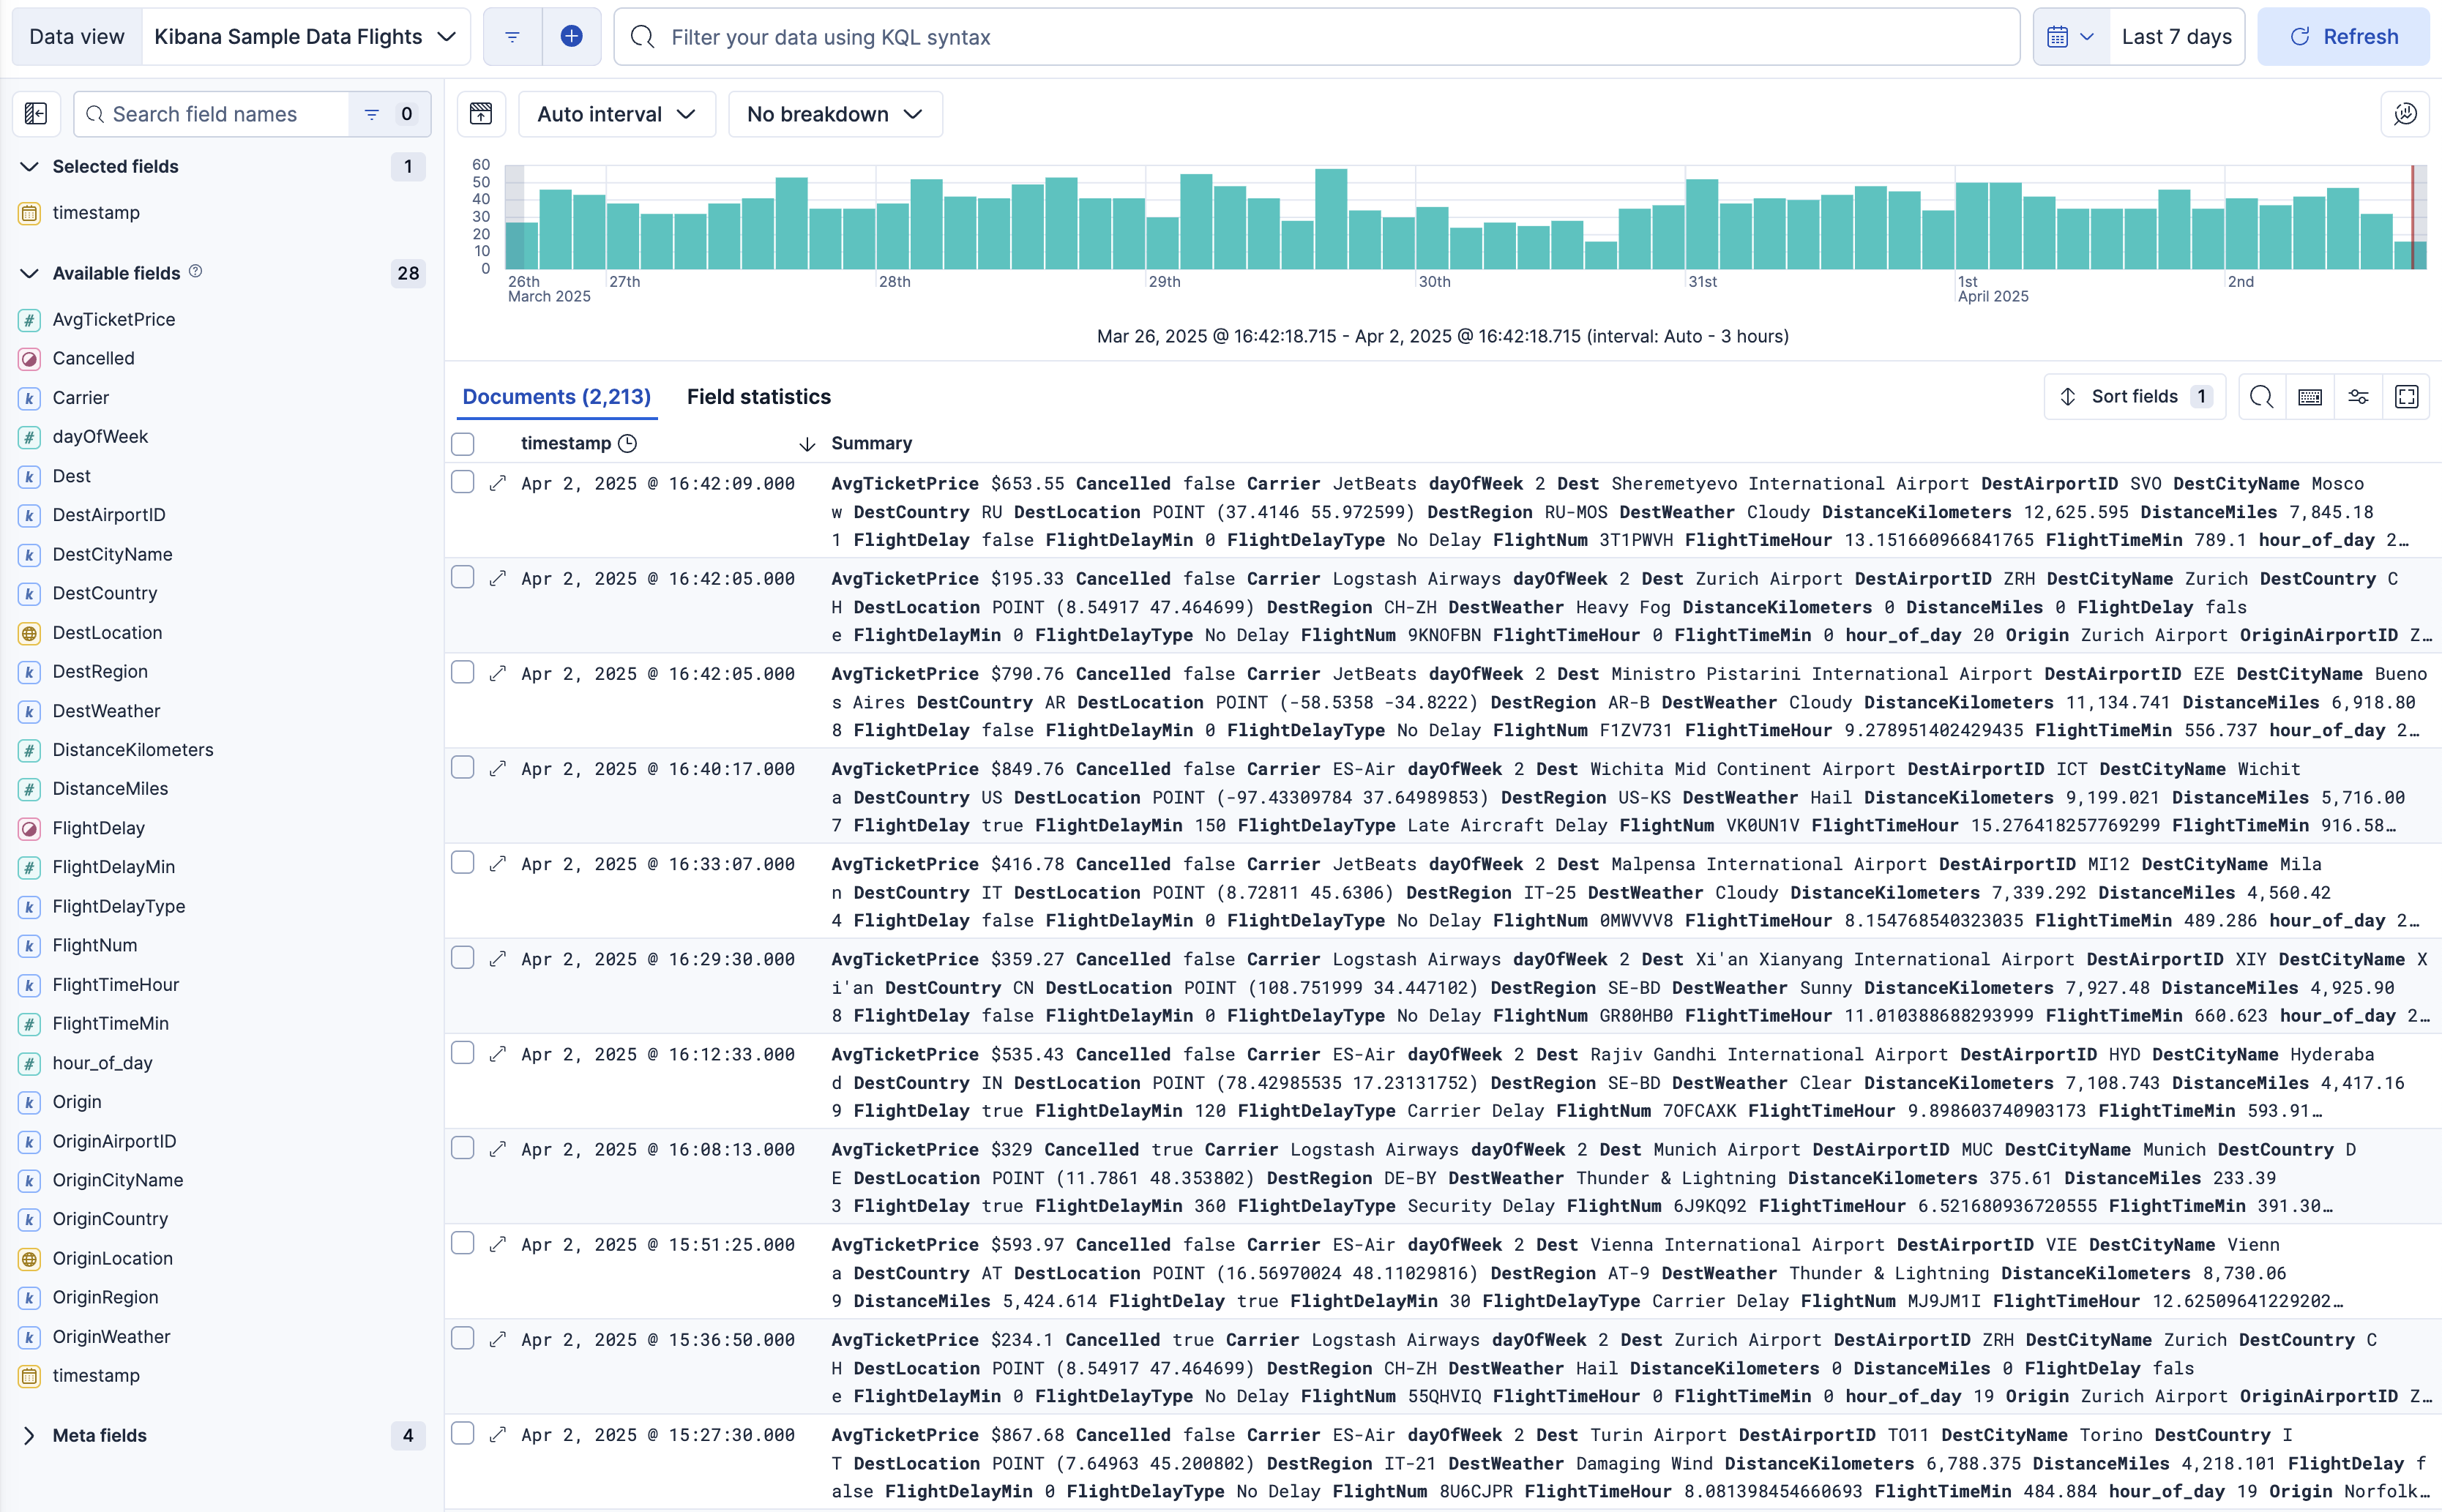
Discover lets you interact directly with raw data. Use Discover to:
- Browse documents in your indices
- Apply filters and search queries
- Visualize results in real-time
It’s the starting point for exploratory analysis.

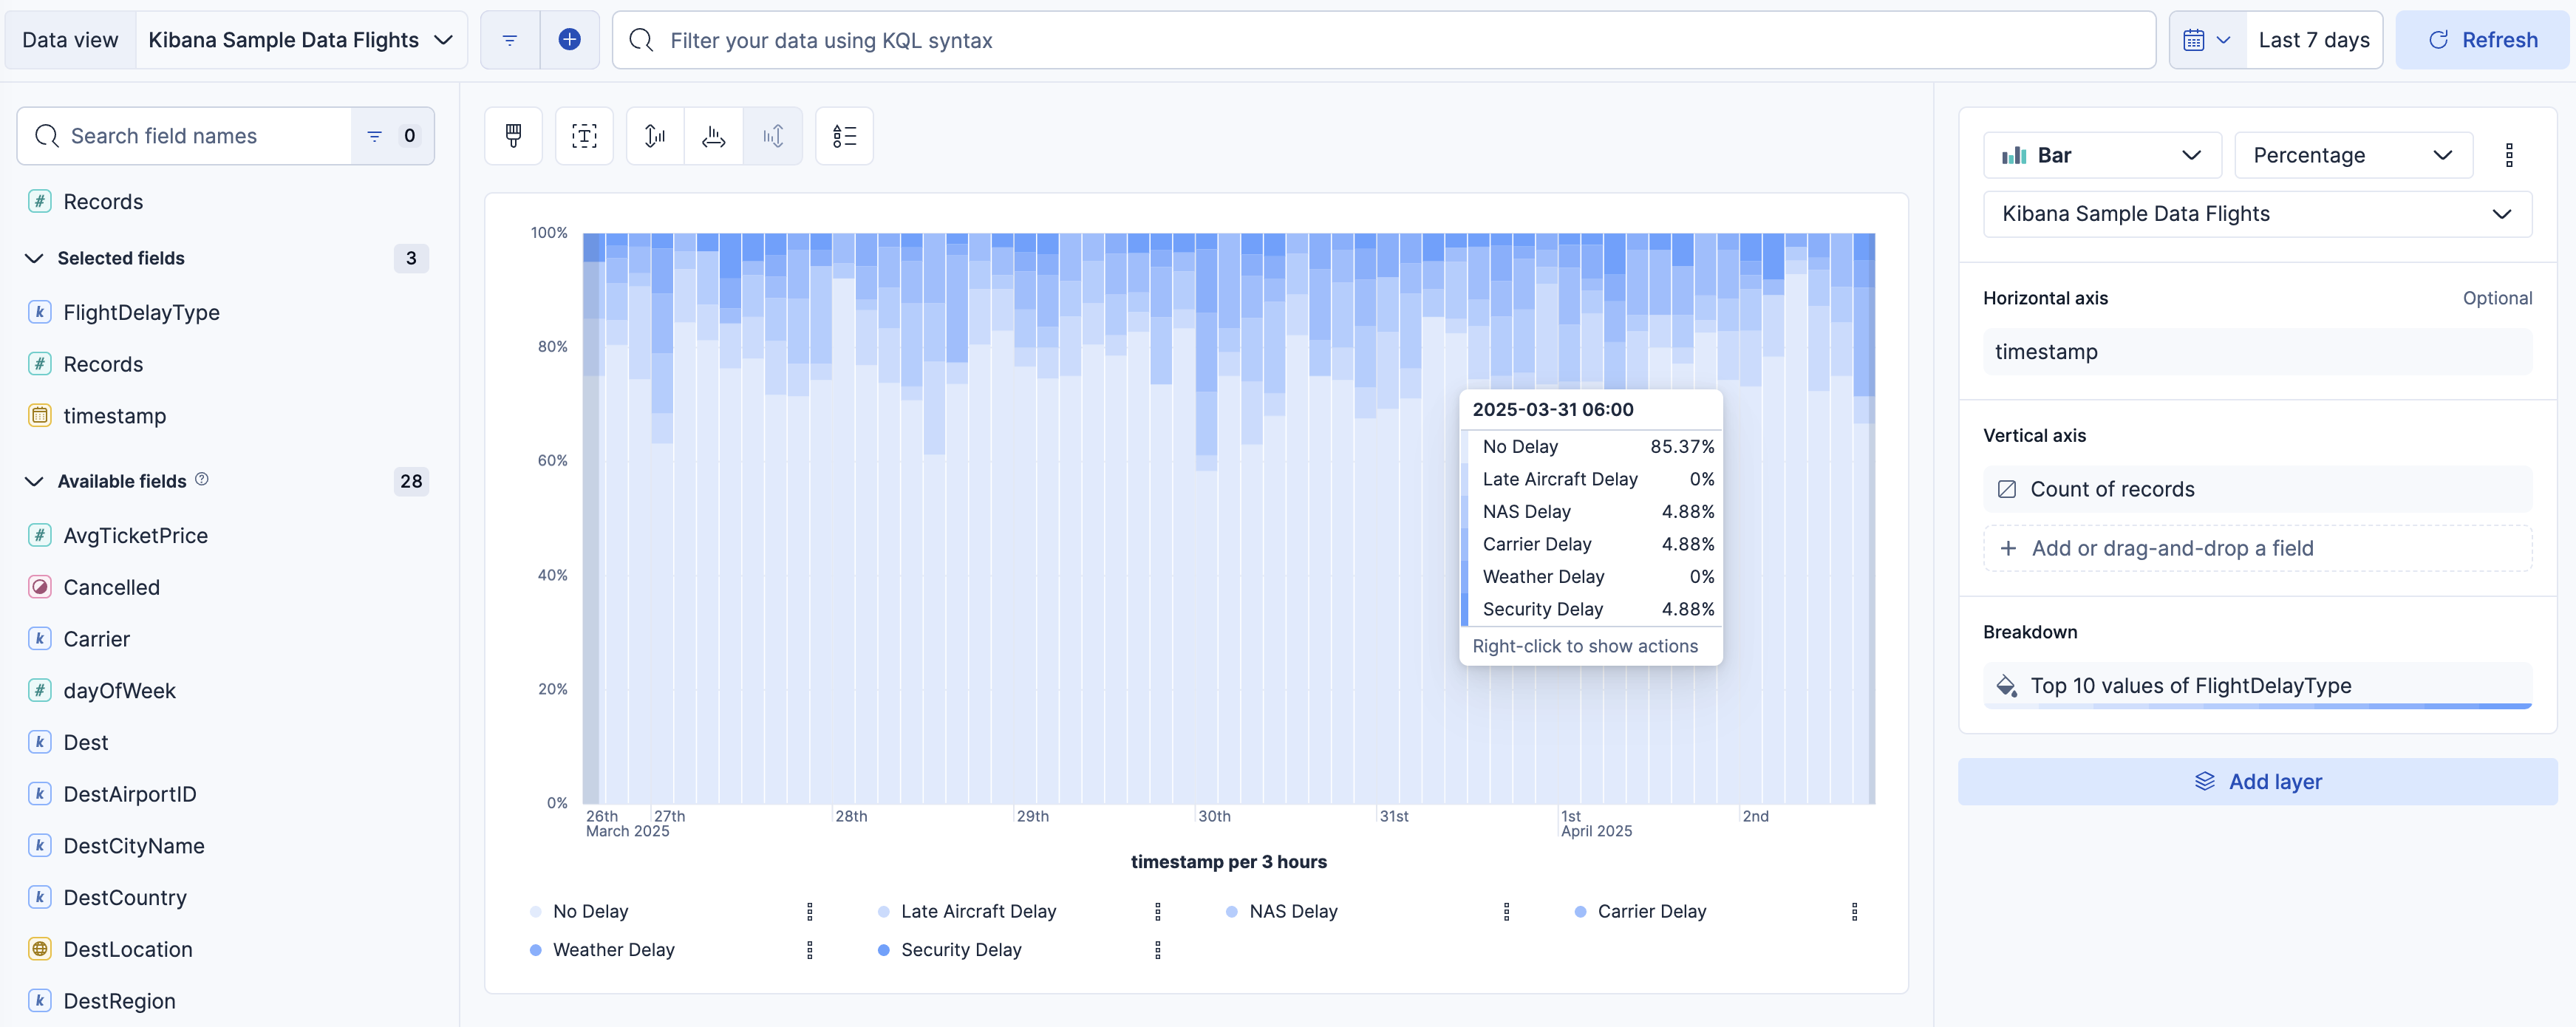
Create a variety of visualizations and add them to a dashboard.
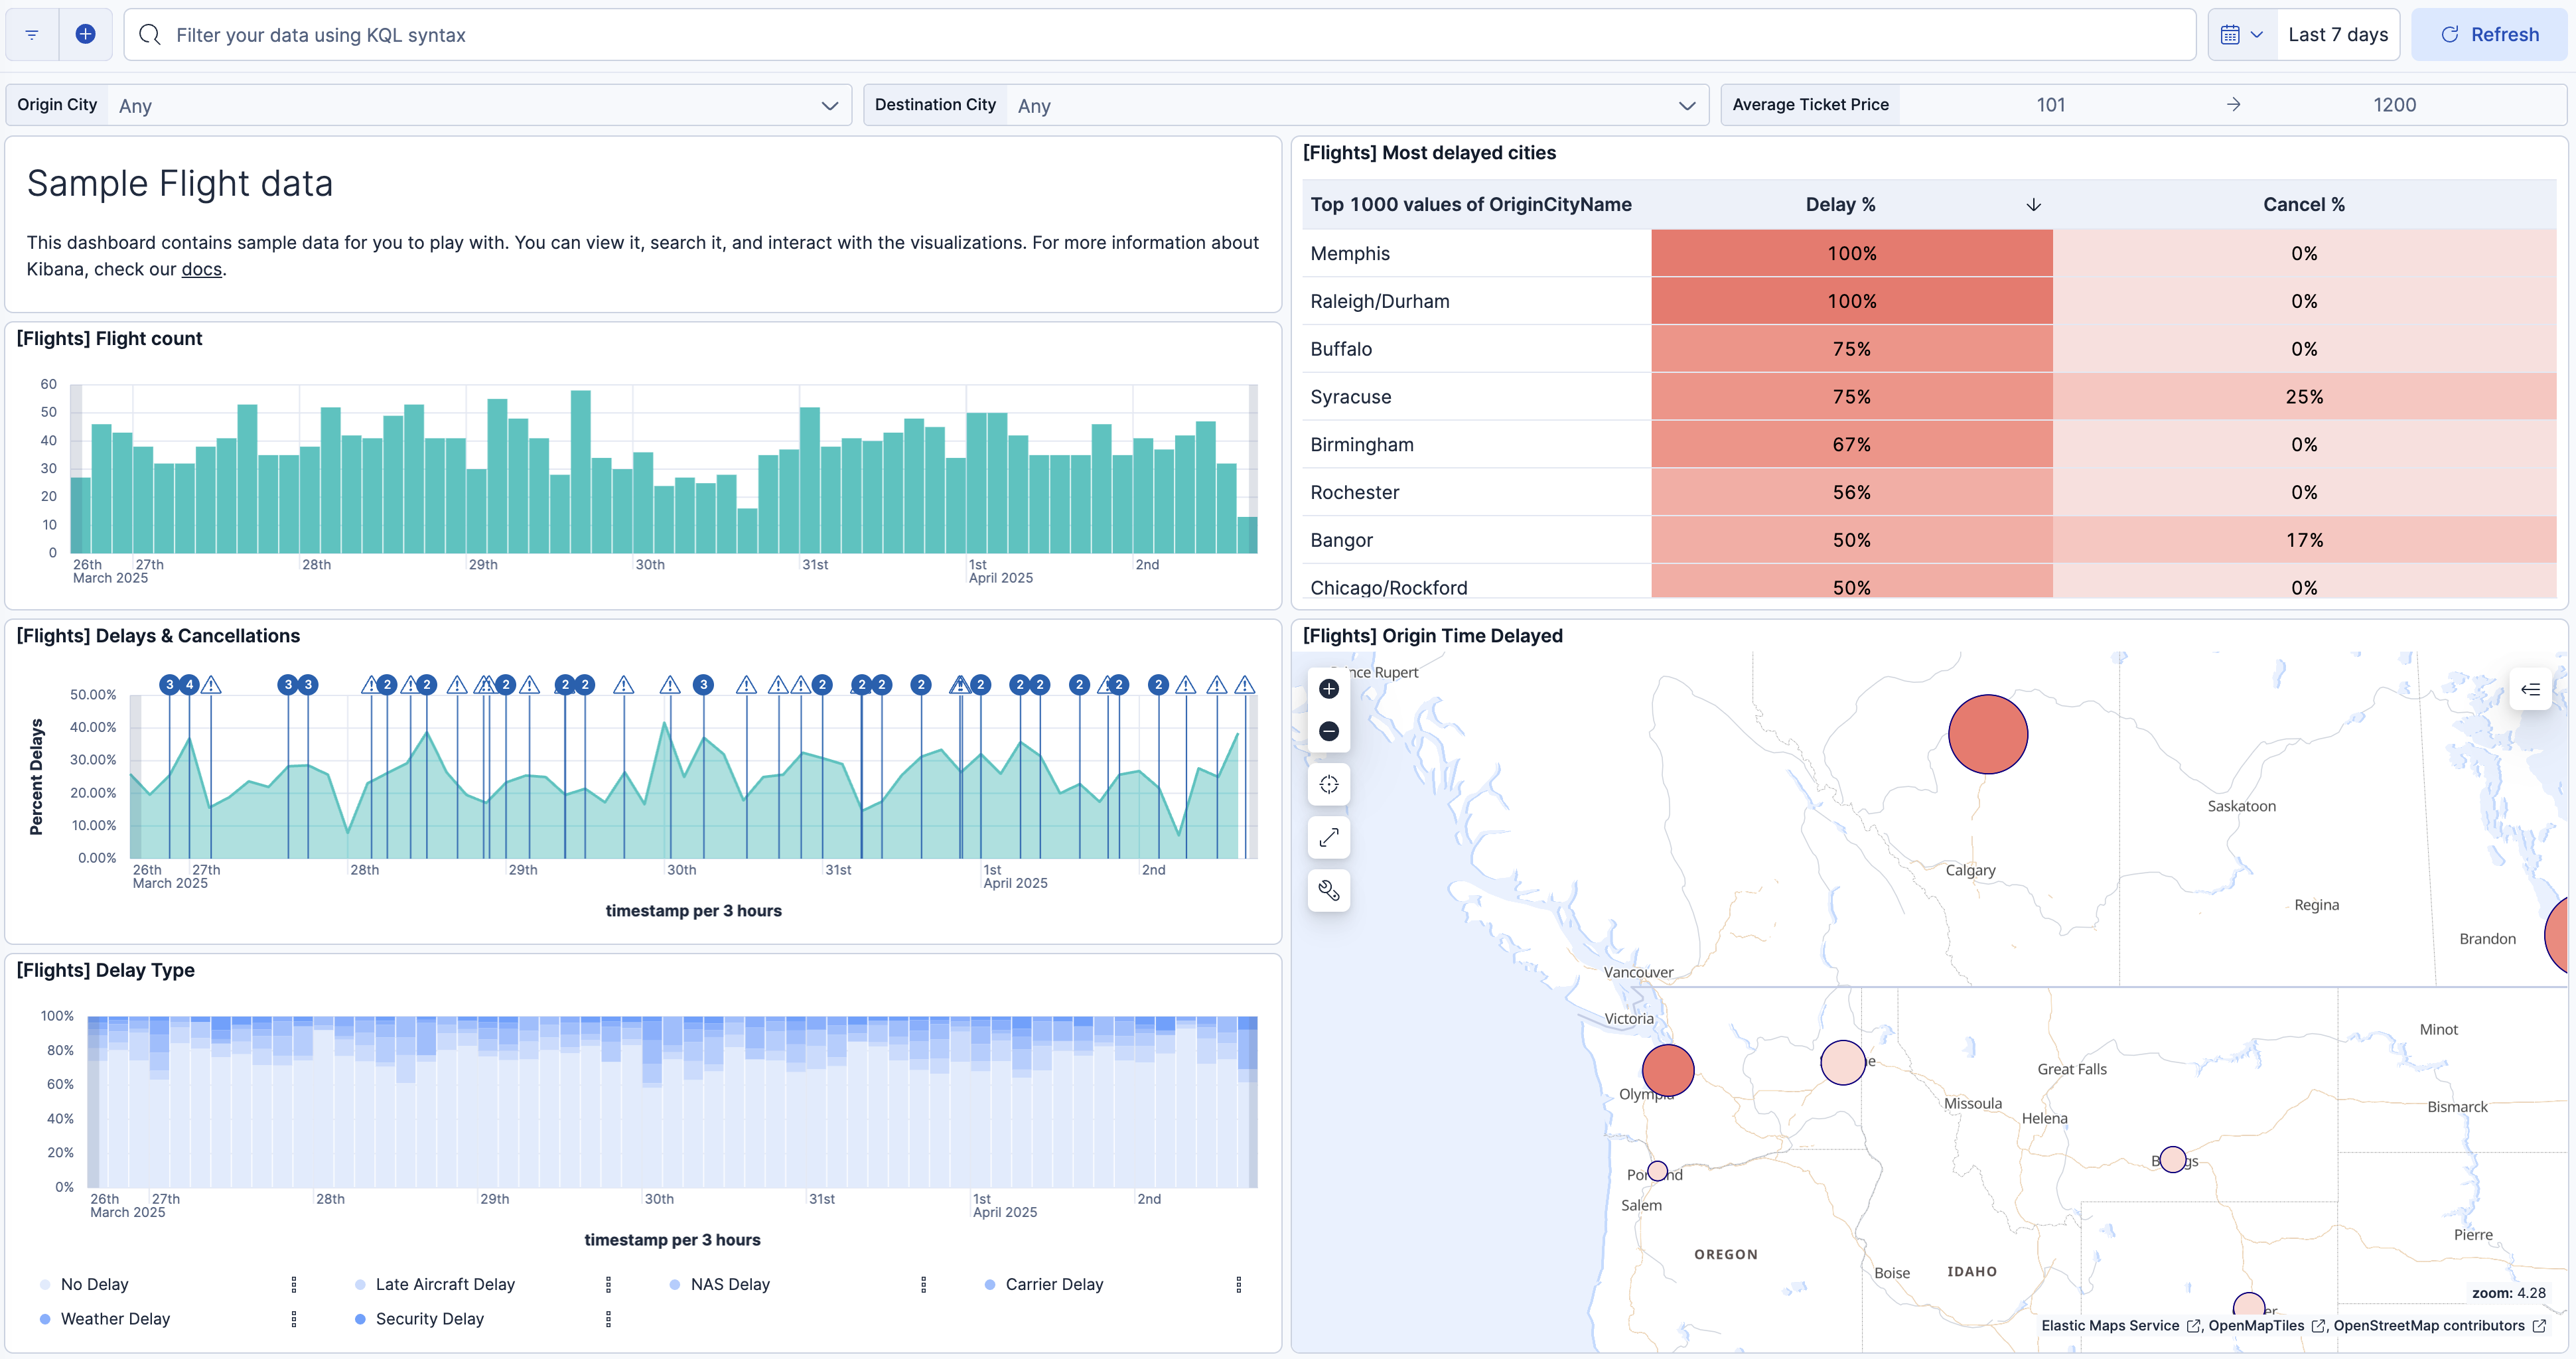
Dashboards serve as centralized hubs for visualizing and monitoring data insights. With dashboards, you can:
- Combine multiple visualizations into a single, unified view
- Display data from multiple indices or datasets for comprehensive analysis
- Customize layouts to suit specific workflows and preferences
Dashboards provide an interactive and cohesive environment with filtering capabilities and controls to explore trends and metrics at a glance.

Panels and visualizations are the core elements that populate your dashboards, enabling dynamic data representation. They support diverse chart types, Interactive filtering, and drill-down capabilities to explore data further. These building blocks transform raw data into clear, actionable visuals, allowing users to analyze and interpret results effectively.

You can share your work and findings with colleagues and stakeholders or generate reports. Report generation can be scheduled or on-demand. You can choose from multiple formats (for example, PDF, CSV). These tools ensure that actionable insights reach the right people at the right time. Alerting You can set up alerts to monitor your data continuously. Alerts notify you when specific conditions are met. This ensures timely action on critical issues.
Elasticsearch's features integrate seamlessly, offering an end-to-end solution for exploring, analyzing, and acting on data. If you want to explore any of the listed features in greater depth, refer to their respective documentation pages and check the provided hands-on examples and tutorials.
If you'd like to explore some features but don't have data ready yet, some sample data sets are available in Kibana for you to install and play with.
Sample data sets come with sample visualizations, dashboards, and more to help you explore Kibana before you ingest or add your own data.
- Open the Integrations page from the navigation menu or using the global search field.
- In the list of integrations, select Sample Data.
- On the page that opens, select Other sample data sets.
- Install the sample data sets that you want.
Once installed, you can access the sample data in the various Kibana apps available to you.