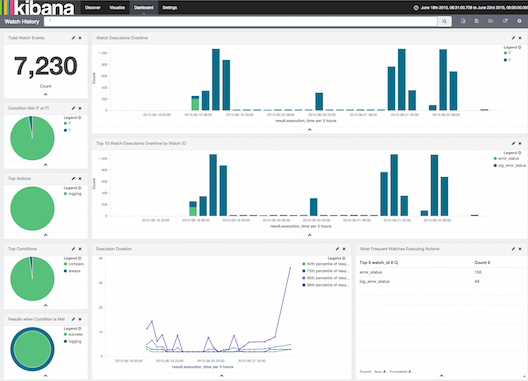
Monitoring Watch Execution
editMonitoring Watch Execution
editWhenever a watch is triggered, a watch_record document is created and added to the watch history
index. A new history index is created daily with a name of the form .watch_history-YYYY.MM.dd.
You can search the watch history like any other Elasticsearch index or use Kibana to monitor and
visualize watch execution.
A watch record’s _source field contains all of the information about the watch execution:
-
watch_id - The name of the watch that was triggered.
-
trigger_event -
How the watch was triggered (
manualorschedule) and the watch’s scheduled time and actual trigger time. -
input -
The input type (
http,search, orsimple) and definition. -
condition -
The
conditiontype (always,never, orscript) and definition. -
state -
The state of the watch execution (
execution_not_needed,executed,throttled). -
result - The results of each phase of the watch execution. Shows the input payload, condition status, transform status (if defined), and actions status.
While you can perform read operations on the watch history and manage the daily indices as needed, you should never perform write operations on a watch history index. If you have Shield installed, we recommend only allowing users read access to the watch history index.
Monitoring Watches with Kibana
editYou can use Kibana to monitor the watch history and create visualizations of the watches that have executed over time.
To monitor watches with Kibana:
-
Go to the Kibana Settings > Indices tab. For example,
http://localhost:5601/#/settings/indices. -
Enter
.watch_history*in the Index name or pattern field. -
Click in the Time field name field and select
trigger_event.triggered_time. - Go to the Discover tab to see the most recently executed watches.
You can create visualizations and add them to a Kibana dashboard to track what watches are being triggered and identify trends.
For example you could create a dashboard to:
- Track triggered watches over time, broken down by top watch.
- Identify top senders, priorities, and keywords for email actions.
- Identify top webhook targets and status codes.

Searching the Watch History
editTo get the watch history for a particular day, search that day’s watch history index:
GET .watch_history-2015.05.11/_search
{
  "query" : { "match_all" : {}}
}
To get all of the watch records that reference a particular watch, search the
watch_id field:
GET .watch_history*/_search
{
  "query" : { "match" : { "watch_id": "rss_watch" }}
}
To get all of the watch records for watches that were throttled, search the
state field.
GET .watch_history*/_search
{
  "query" : { "match" : { "state": "throttled" }}
}
To get a date histogram over all triggered watches within a particular time range.
GET .watch_history*/_search?size=0
{
  "query": {
    "filtered": {
      "query": {
        "match_all": {}
      },
      "filter": {
        "range": {
          "trigger_event.triggered_time": {
            "gte": 1430438400000,
            "lte": 1431820800000
          }
        }
      }
    }
  },
  "aggs": {
    "records_per_minute": {
      "date_histogram": {
        "field": "trigger_event.triggered_time",
        "interval": "1m",
        "min_doc_count": 0,
        "extended_bounds": {
          "min": 1430438400000,
          "max": 1431820800000
        }
      }
    }
  }
}
Managing Watch History Indexes
editYou should establish a policy for how long you need to keep your watch history indexes. For example, you might simply delete the daily history indexes after 30 days. If you need to preserve the history but don’t need to maintain immediate access to it, you can close the index or take a snapshot and then delete it.
Elasticsearch Curator provides a convenient CLI for managing time-series indices.
You can also set up a watch to manage your watch history indexes. For example, the following watch that runs daily and uses a webhook action to delete history indexes older than seven days.
PUT _watcher/watch/manage_history
{
  "metadata": {
    "keep_history_days": 7
  },
  "trigger": {
    "schedule": { "daily": { "at" : "00:01" }}
  },
  "input": {
    "simple": {}
  },
  "condition": {
    "always": {}
  },
  "transform": {
    "script" : "return [ indexToDelete : '/.watch_history-' + ctx.execution_time.minusDays(ctx.metadata.keep_history_days + 1).toString('yyyy.MM.dd') ]"
  },
  "actions": {
    "delete_old_index": {
      "webhook": {
        "method": "DELETE",
        "host": "localhost",
        "port": 9200,
        "path": "{{ctx.payload.indexToDelete}}"
      }
    }
  }
}