- Legacy APM Overview:
- What is APM?
- Quick start guide
- Data Model
- Features
- Agent and Server compatibility
- Troubleshooting
- Breaking changes
- 7.15.0 APM Breaking changes
- 7.14.0 APM Breaking changes
- 7.13.0 APM Breaking changes
- 7.12.0 APM Breaking changes
- 7.11.0 APM Breaking changes
- 7.10.0 APM Breaking changes
- 7.9.0 APM Breaking changes
- 7.8.0 APM Breaking changes
- 7.7.0 APM Breaking changes
- 7.6.0 APM Breaking changes
- 7.5.0 APM Breaking changes
- 7.4.0 APM Breaking changes
- 7.3.0 APM Breaking changes
- 7.2.0 APM Breaking changes
- 7.1.0 APM Breaking changes
- 7.0.0 APM Breaking changes
- 6.8.0 APM Breaking changes
- 6.7.0 APM Breaking changes
- 6.6.0 APM Breaking changes
- 6.5.0 APM Breaking changes
- 6.4.0 APM Breaking changes
Transaction sampling
editTransaction sampling
editElastic APM supports head-based, probability sampling. Head-based means the sampling decision for each trace is made when that trace is initiated. Probability sampling means that each trace has a defined and equal probability of being sampled.
For example, a sampling value of .2 indicates a transaction sample rate of 20%.
This means that only 20% of traces will send and retain all of their associated information.
The remaining traces will drop contextual information to reduce the transfer and storage size of the trace.
Why sample?
editDistributed tracing can generate a substantial amount of data,
and storage can be a concern for users running 100% sampling — especially as they scale.
The goal of probability sampling is to provide you with a representative set of data that allows
you to make statistical inferences about the entire group of data.
In other words, in most cases, you can still find anomalous patterns in your applications, detect outages, track errors,
and lower MTTR, even when sampling at less than 100%.
What data is sampled?
editA sampled trace retains all data associated with it.
Non-sampled traces drop span data.
Spans contain more granular information about what is happening within a transaction,
like external requests or database calls.
Spans also contain contextual information and labels.
Regardless of the sampling decision, all traces retain transaction and error data. This means the following data will always accurately reflect all of your application’s requests, regardless of the configured sampling rate:
- Transaction duration and transactions per minute
- Transaction breakdown metrics
- Errors, error occurrence, and error rate
Sample rates
editWhat’s the best sampling rate? Unfortunately, there isn’t one.
Sampling is dependent on your data, the throughput of your application, data retainment policies, and other factors.
A sampling rate from .1% to 100% would all be considered normal.
You may even decide to have a unique sample rate per service — for example, if a certain service
experiences considerably more or less traffic than another.
Sampling with distributed tracing
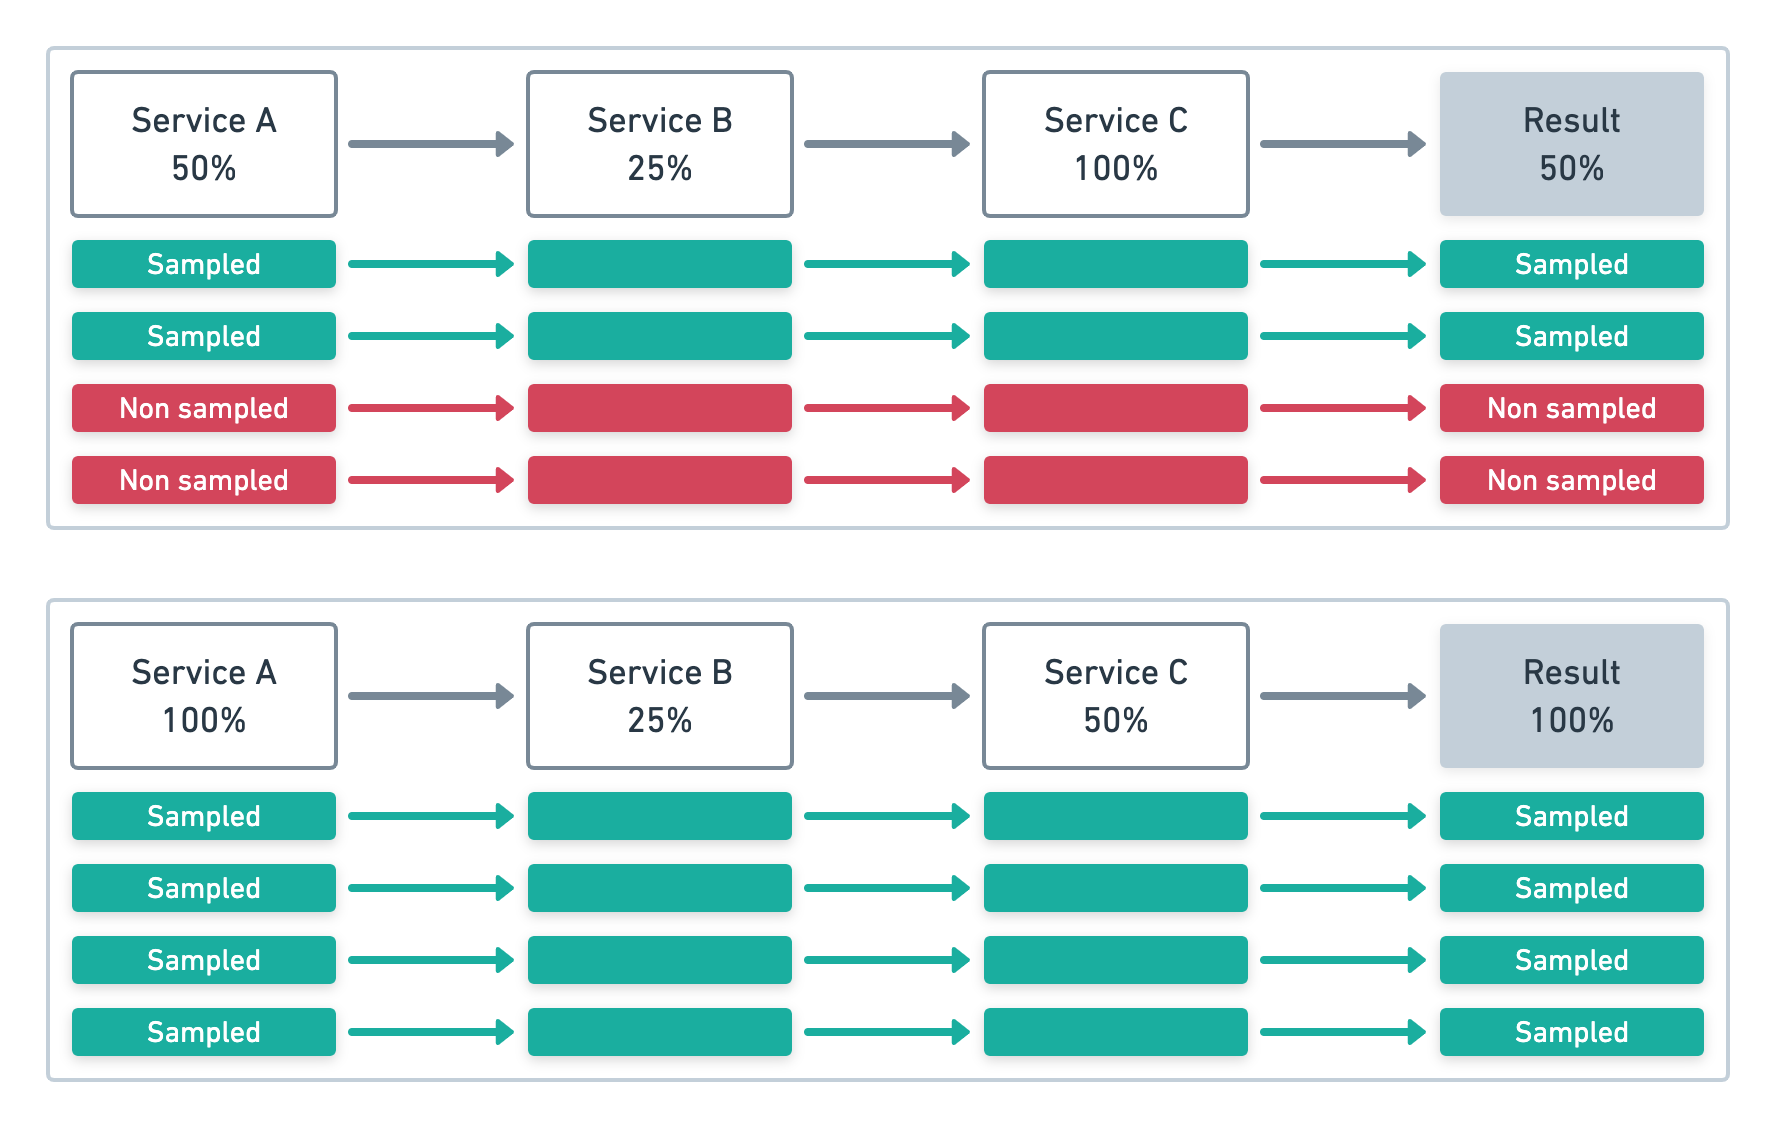
editThe initiating service makes the sampling decision in a distributed trace, and all downstream services respect that decision.
In each example below, Service A initiates four transactions.
In the first example, Service A samples at .5 (50%). In the second, Service A samples at 1 (100%).
Each subsequent service respects the initial sampling decision, regardless of their configured sample rate.
The result is a sampling percentage that matches the initiating service:

APM app implications
editBecause the transaction sample rate is respected by downstream services, the APM app always knows which transactions have and haven’t been sampled. This prevents the app from showing broken traces. In addition, because transaction and error data is never sampled, you can always expect metrics and errors to be accurately reflected in the APM app.
Service maps
Service maps rely on distributed traces to draw connections between services. A minimum required version of APM agents is required for Service maps to work. See Service maps for more information.
Adjust the sample rate
editThere are three ways to adjust the transaction sample rate of your APM agents:
- Dynamic
- The transaction sample rate can be changed dynamically (no redeployment necessary) on a per-service and per-environment basis with APM Agent Configuration in Kibana.
- Kibana API
- APM Agent configuration exposes an API that can be used to programmatically change your agents' sampling rate. An example is provided in the Agent configuration API reference.
- Configuration
-
Each agent provides a configuration value used to set the transaction sample rate. See the relevant agent’s documentation for more details:
-
Go:
ELASTIC_APM_TRANSACTION_SAMPLE_RATE -
Java:
transaction_sample_rate -
.NET:
TransactionSampleRate -
Node.js:
transactionSampleRate -
PHP:
transaction_sample_rate -
Python:
transaction_sample_rate -
Ruby:
transaction_sample_rate
-
Go:
On this page