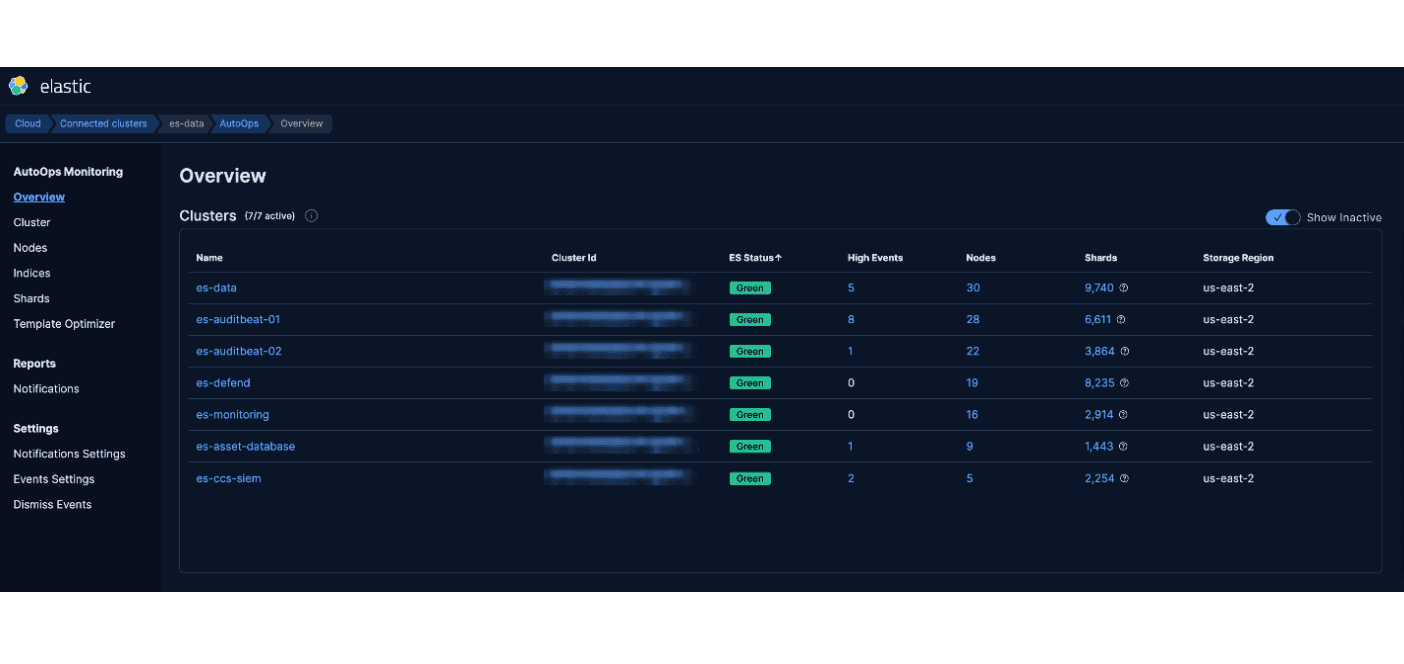
Simplify your Elasticsearch operations with real-time issue detection and actionable recommendations to optimize performance and reduce costs. AutoOps is available for cloud and self-managed deployments. Learn more about AutoOps.
While Elasticsearch is a powerful and scalable search engine that offers a vast selection of capabilities, many users find it challenging due to its sometimes complex administration and management experience. We hear you, and we're excited to share some big news! The Opster team has been hard at work making AutoOps even better, and a seamless part of the Elastic platform. AutoOps is available in select Elastic Cloud regions, and coverage is rapidly expanding!
AutoOps makes Elastic Cloud easy to operate
AutoOps for Elasticsearch significantly simplifies cluster management with performance recommendations, resource utilization and cost insights, real-time issue detection and resolution paths. With AutoOps, you will be able to:
- Minimize administration time with insights tailored to your Elasticsearch utilization and configuration
- Analyze hundreds of Elasticsearch metrics in real-time with pre-configured alerts to detect and flag issues before they become critical
- Get root cause analysis with drill-downs to point-in-time of issue occurrence, and resolution suggestions including in-context Elasticsearch commands
- Improve resource utilization by providing optimization suggestions
In each of the scenarios below, let’s see examples of issues that users may come across, and how AutoOps insights (screenshots) can help right away!
Real scenarios: how AutoOps makes Elasticsearch easy to operate
The scenarios below provide real-world issues and how AutoOps provide root cause analysis, with drill-downs to point-in-time of issue occurrence, and recommendations on how to resolve the issue.
Scenario #1: Finding a query causing severe search latency
Issue:
Users complain that their dashboards are slow and take a long time to load…
AutoOps insight:
AutoOps reports a “Long running search task” event, identifying a search running for 4 minutes with 4 nested aggregations and suggesting ways to optimize the query causing the latency.
Resolution
AutoOps provides a cURL command to cancel the query. By identifying and canceling the long running search task, the administrator was able to block this specific query.
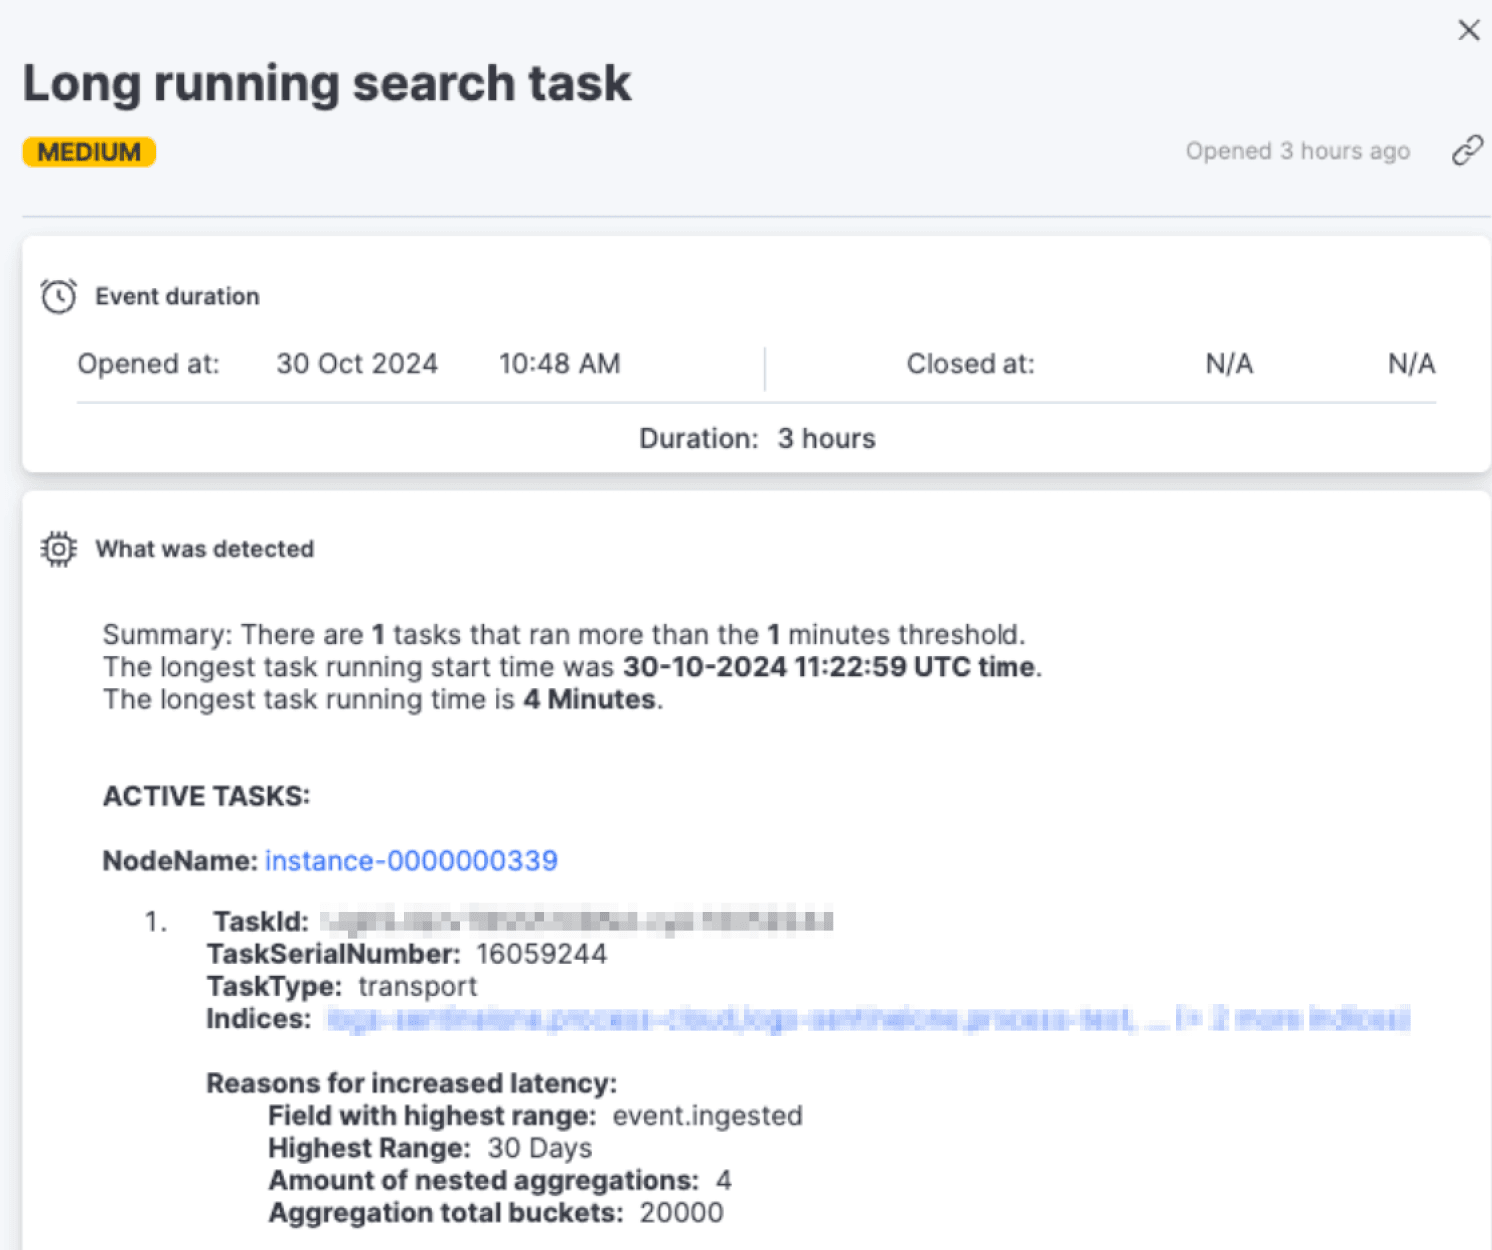
AutoOps monitors the Task Management API and flags long running search tasks providing an easy way to detect long running search queries and optimize them.

AutoOps provides in-context Elasticsearch commands to resolve the issues, such as canceling the long running search task
Scenario #2: Ineffective use of data tiering, leading to slow search and indexing
Issue:
Users report slow search performance and indexing.
AutoOps insight:
AutoOps detects multiple issues stemming from increased load due to indexing activities on warm nodes, resulting in a high indexing queue and slow searches on one of these nodes.
AutoOps detects that indexing activities are occurring in warm nodes, there is a high indexing queue and slow searches were detected on one of those warm nodes.
Resolution:
The team updated their ILM policy to ensure that indices only move off the hot tier once no further indexing activities are expected.
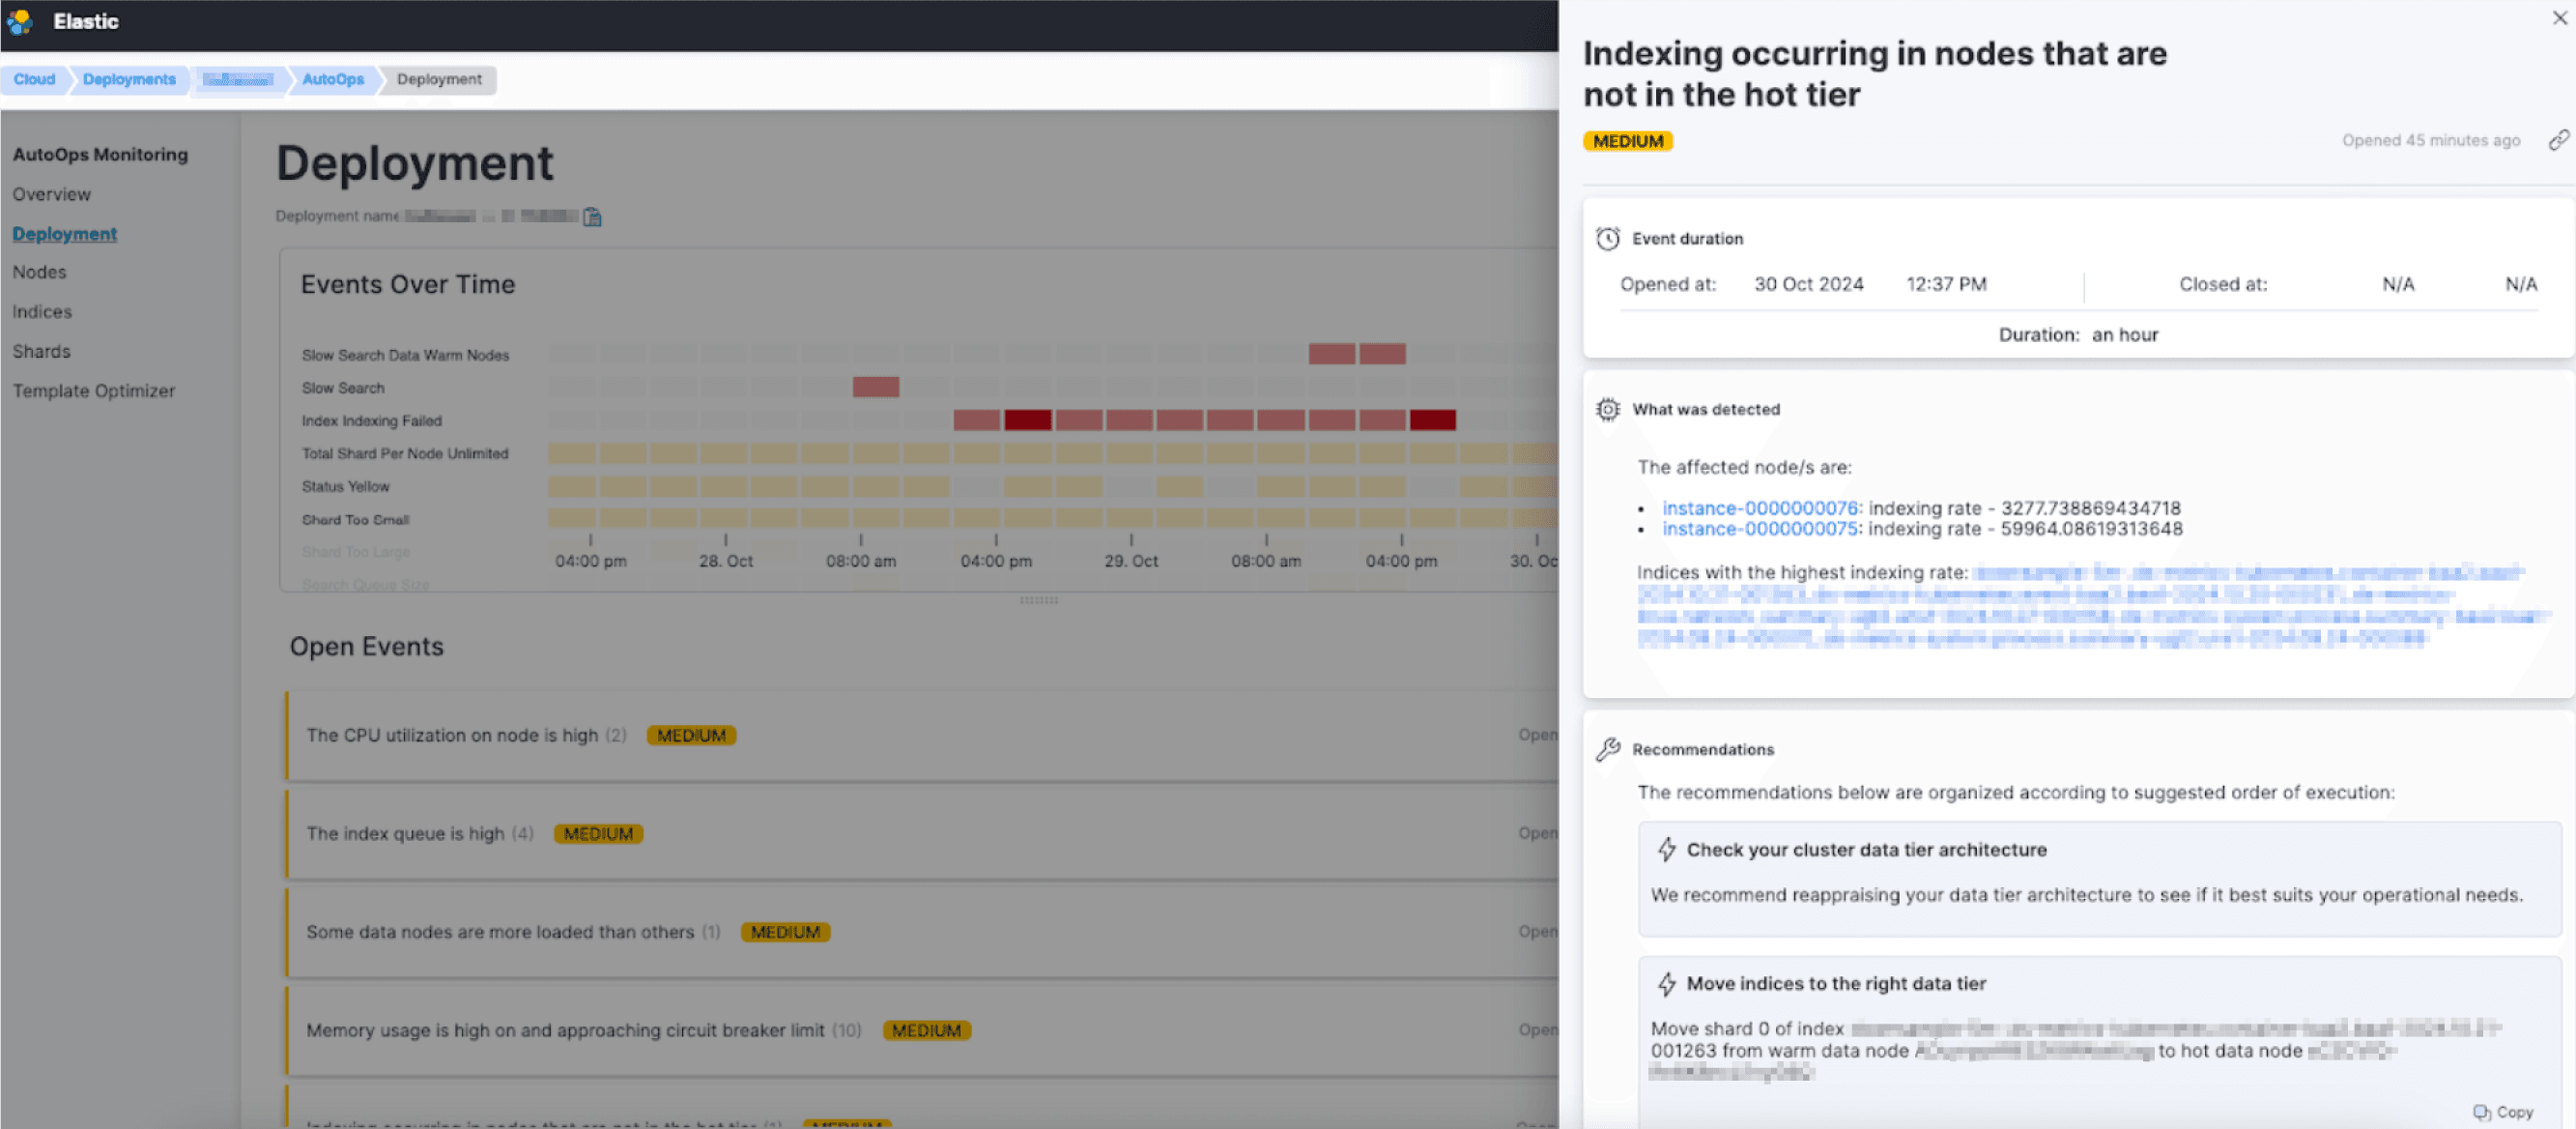
AutoOps detects that indexing occurred in the hot tier

AutoOps detects that the Index queue is high and provides a list of recommendations for resolution
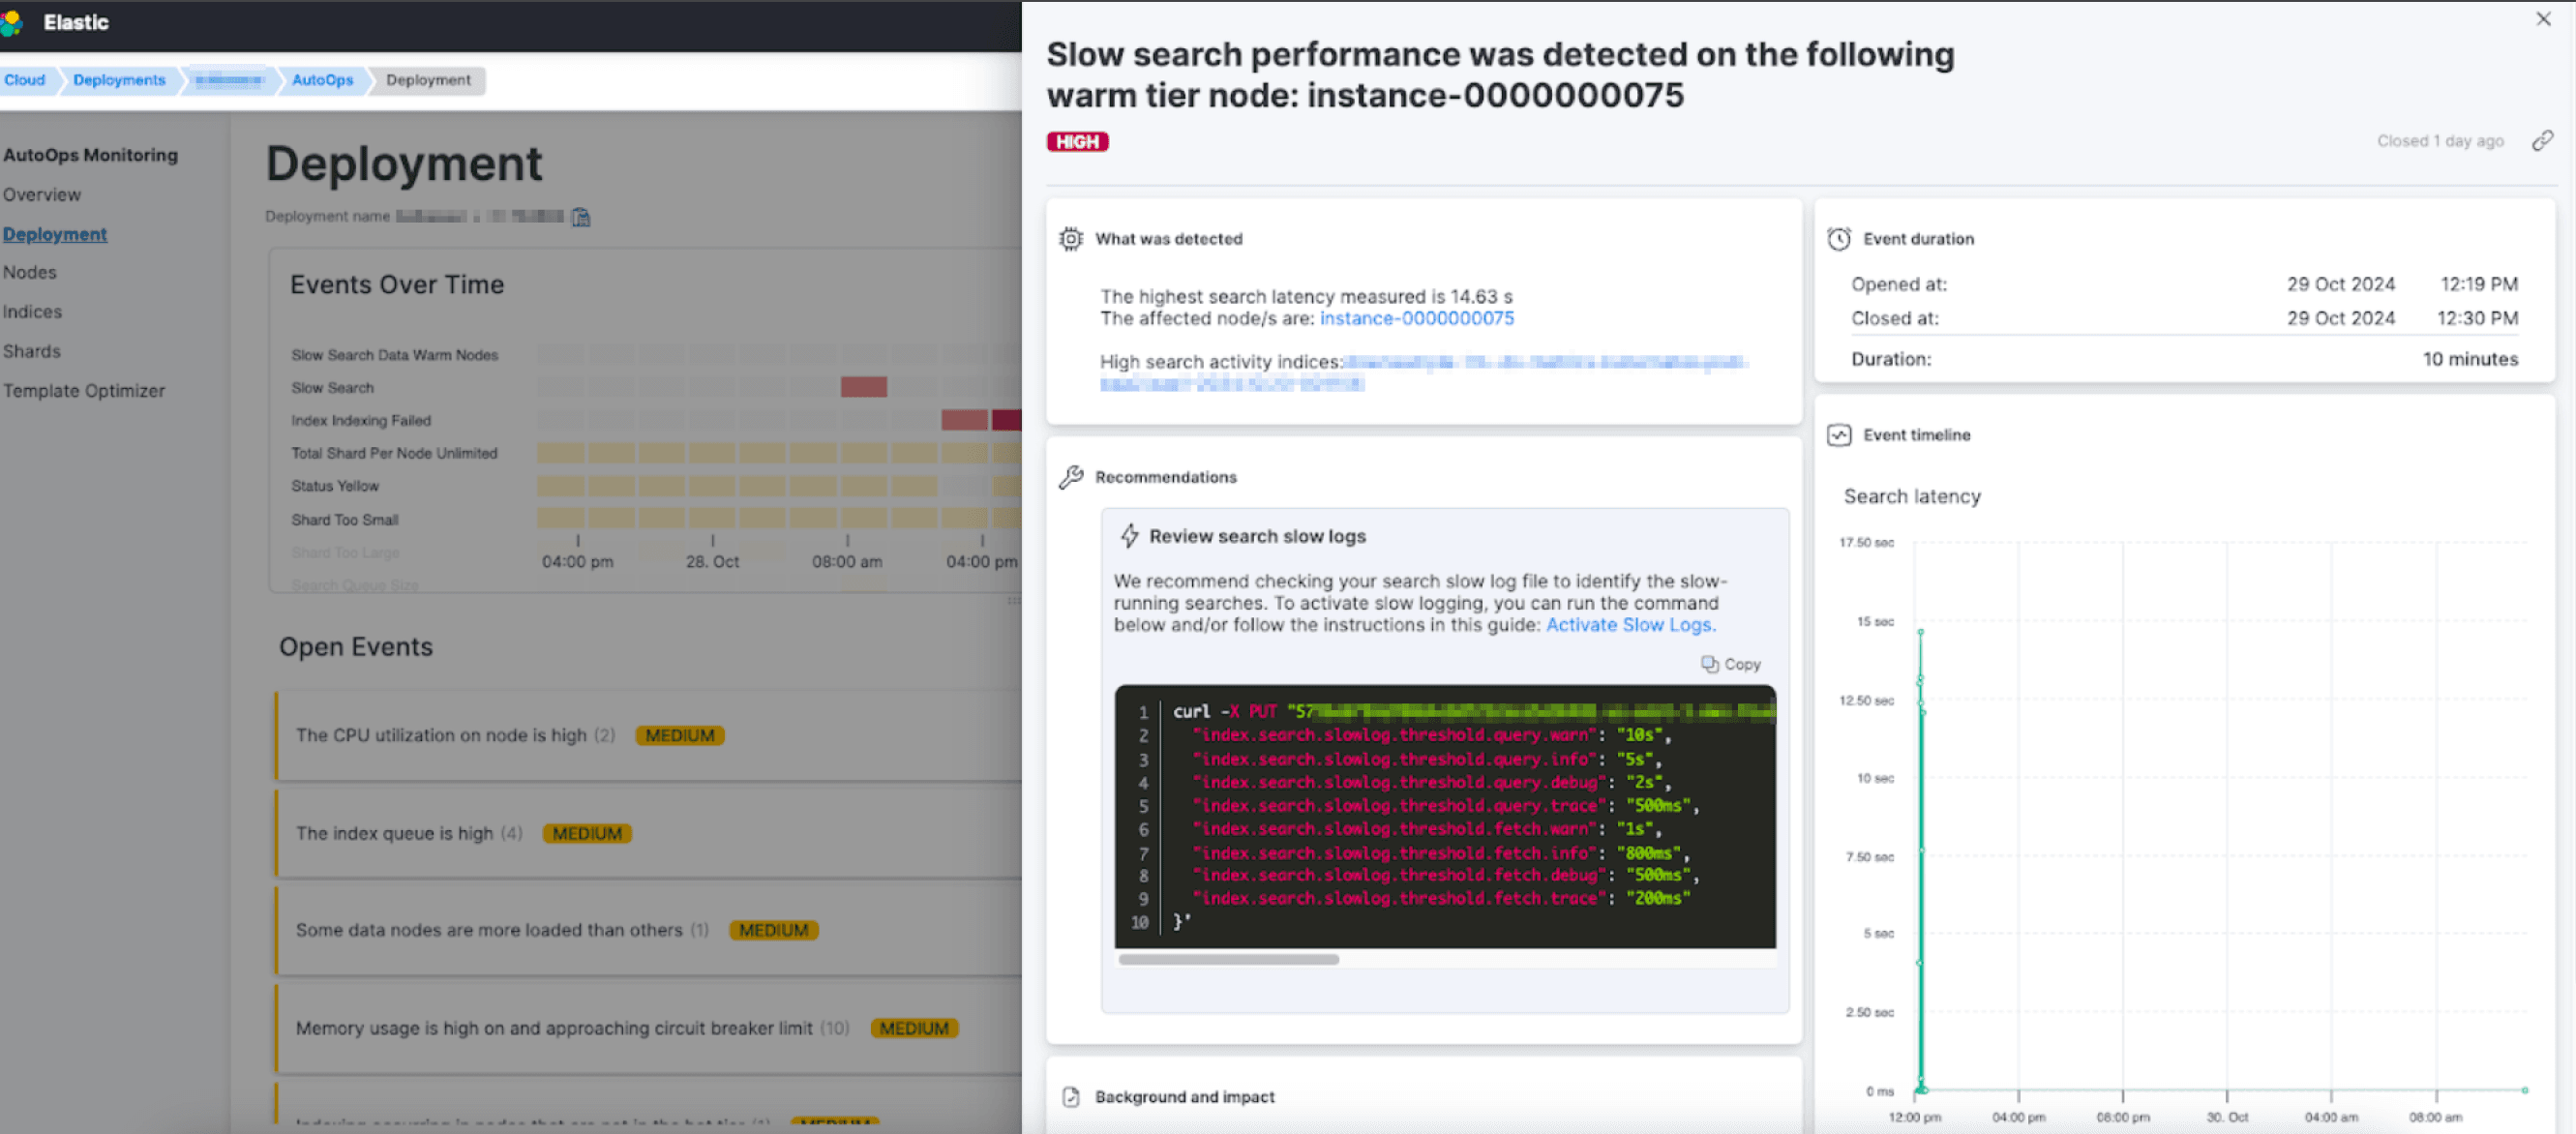
AutoOps Slow search performance event - detects slow search performance on the loaded node
Scenario #3: Investigating production down time
Issue:
An outage is reported, and CPU usage on the cluster is high momentarily
AutoOps insight:
AutoOps identifies the time window during which CPU utilization was high, and provides a drill-down into the point of time of the issue with a recommendation to check slow logs. Drilling down further into the node view reveals that the CPU is high every day, at about 7am.
Resolution
SRE finds a script scheduled to run daily at 7 am, by amending the script they are able to fix the issue and stabilize the cluster.
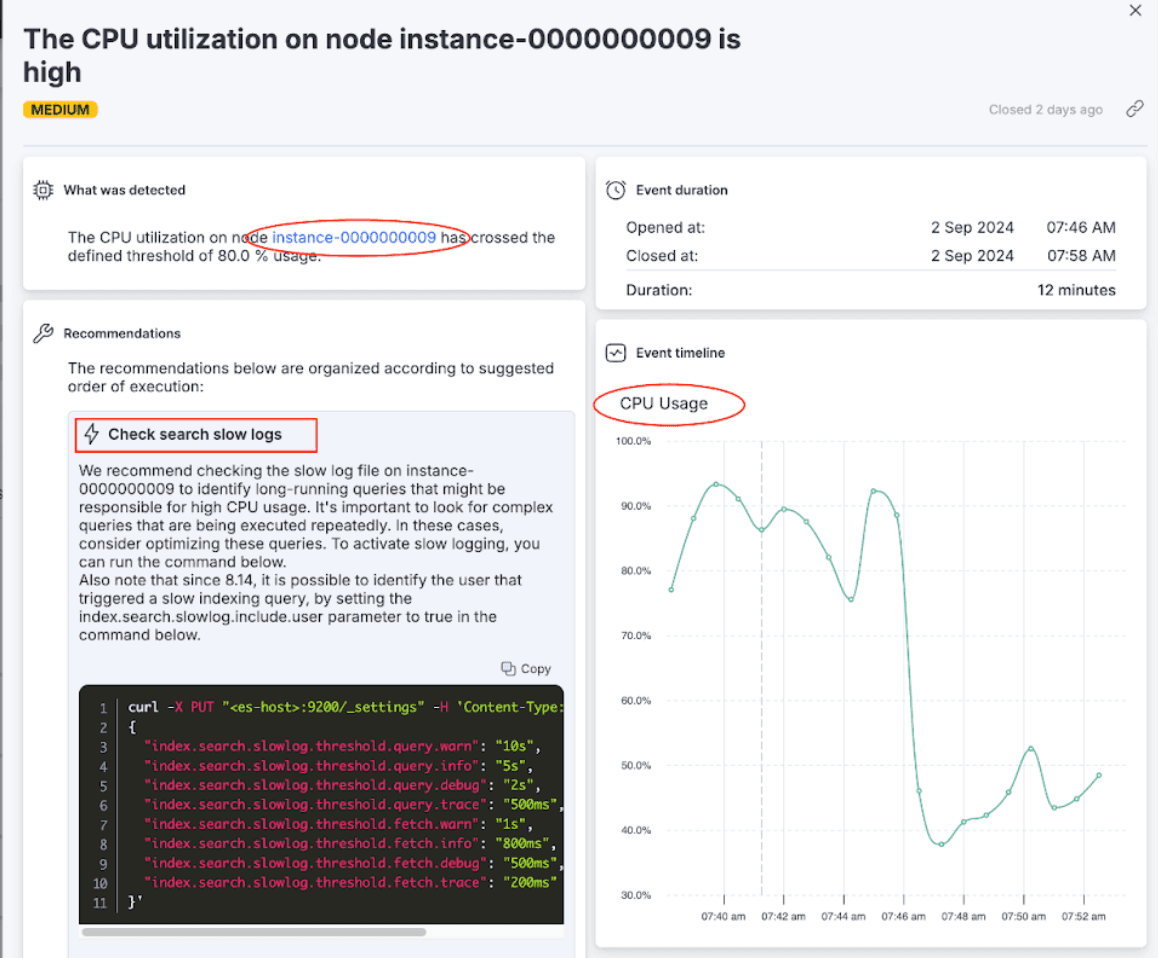
AutoOps provides hyperlinks for quick drill-downs into detected issues
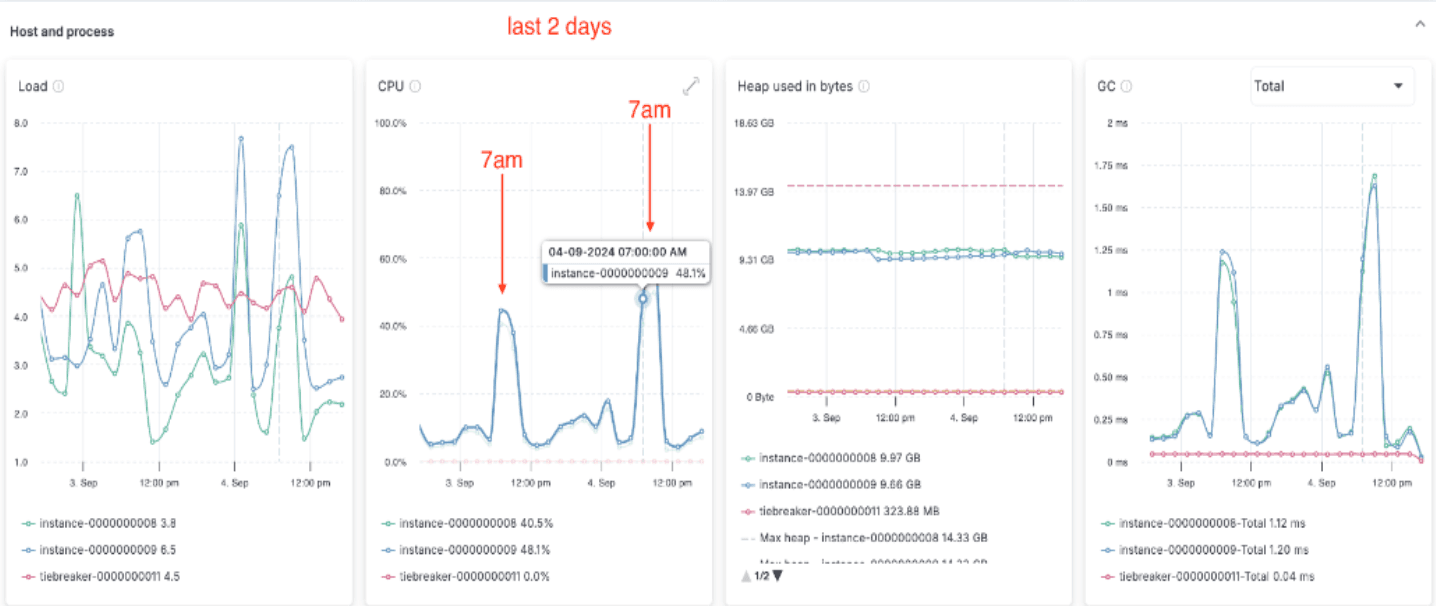
Drill down screens provide extra context with metrics on nodes, indices and shards and templates optimizations
Scenario #4: Customer Kibana dashboards are slow
Issue
Customers complain that Kibana dashboards are at times slower than usual
AutoOps insight
AutoOps detects large shards that could lead to slow search performance and recommends reindexing into smaller indices and reviewing the ILM policy.
Resolution
The team follows AutoOps’ recommendation to change the shards sizes, improving the dashboard’s responsiveness and cluster stability.
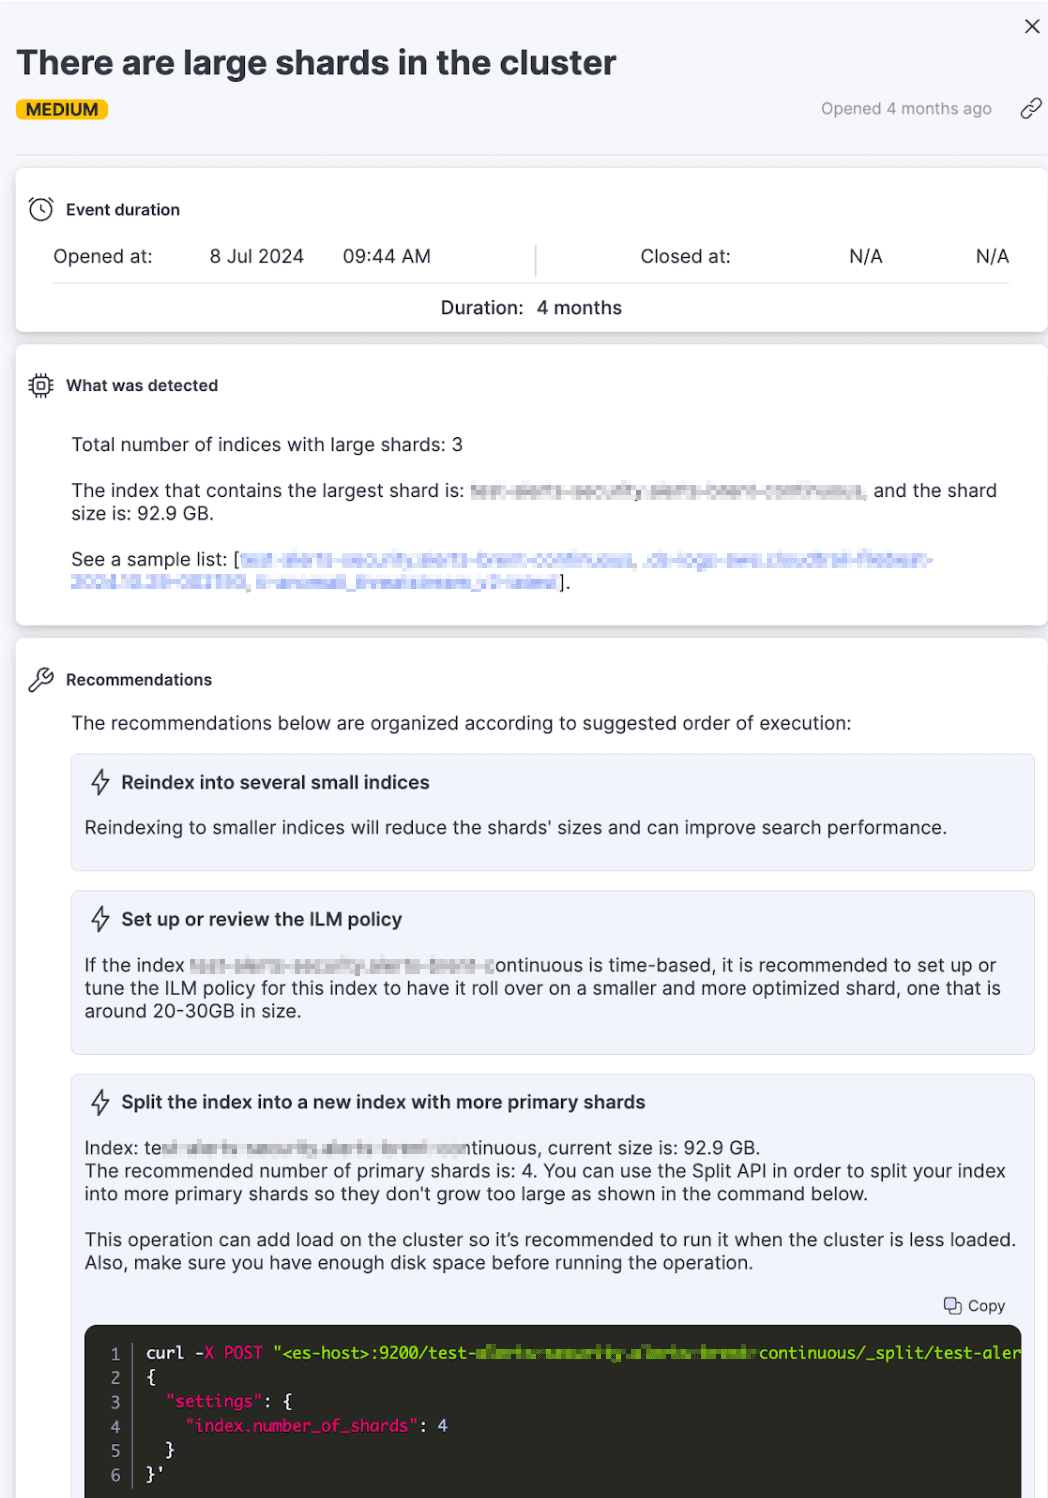
AutoOps monitors shards sizes and alerts when and how to optimize shards
AutoOps and Elastic: name a more iconic duo!
By analyzing hundreds of Elasticsearch metrics, your configuration, and usage patterns, AutoOps recommends operational and monitoring insights that deliver real savings in administration time and hardware costs.
Elasticsearch Performance optimizations: AutoOps tells you exactly how to keep your Elasticsearch clusters running smoothly. It offers tailored insights based on your specific usage and configuration, helping you maintain high performance.
Real-time Issue Detection for Elasticsearch specific issues: AutoOps continuously analyzes hundreds of Elasticsearch metrics and provides pre-configured alerts to catch issues like ingestion bottlenecks, data structure misconfigurations, unbalanced loads, slow queries, and more - before they become bigger issues.
Easy Troubleshooting: Troubleshooting can be complex, especially in larger environments. AutoOps performs root cause analysis and provides drill-downs to the exact point in time when an issue occured, and resolution paths including in-context Elasticsearch commands and best practices.
Cost visibility and optimization for Elasticsearch deployments : AutoOps identifies underutilized nodes, small or large indices and shards, and suggests data tier optimizations. This can help with better resource utilization and potential hardware cost savings.
Seamless Integration: AutoOps isn't just a standalone tool; it's built into Elastic Cloud and integrates with alerting and messaging frameworks (MS Teams and Slack), incident management systems (PagerDuty and OpsGenie) and other tools. You can customize AutoOps alerts and notifications for your use case.
Query Optimization, Template Optimization, and lots more! Built into AutoOps is our expertise in running and managing lots of types of Elastic environments. AutoOps identifies and alerts you on expensive queries, data types that exist and if/when they should (or should not) be used, for example storing numbers as integers/longs so they are optimized for range queries. There are many other types of suggestions built in, that we hope you will find useful!
When will AutoOps be available for me?
We’re rolling out AutoOps in phases, starting with select Elastic Cloud Hosted regions and coverage is expanding rapidly. Next up, we’ll focus on our Elastic Cloud Serverless users. While Elastic Cloud Serverless is already making Elasticsearch easier to use, AutoOps will take it to the next level by offering advanced monitoring and optimization capabilities. And for our self-managed customers, we haven’t forgotten you. Plans are in the works to bring AutoOps your way, too!
Try AutoOps: the easy way to operate Elasticsearch
Elasticsearch is powerful, but should also be as simple and efficient as possible for your use. With AutoOps, we’re delivering on that promise in a big way. Whether you’re striving for optimal performance or looking to cut costs, AutoOps offers insights and tools to help you.
Got questions or eager to dive into AutoOps? Here are some ways to start, and happy optimizing!
- AutoOps home page - watch three minute video
- Try AutoOps using an Elastic Cloud trial account
- AutoOps product documentation
Frequently Asked Questions
What is AutoOps for Elasticsearch?
AutoOps makes Elastic Cloud easy to operate. It simplifies cluster management with performance recommendations, resource utilization and cost insights, real-time issue detection and resolution paths.


