Elasticsearch allows you to index data quickly and in a flexible manner. Try it free in the cloud or run it locally to see how easy indexing can be.
How to sync data from MongoDB to Elasticsearch using Elastic Connectors via the Connector API
- Set up Elasticsearch and MongoDB:
- Create an Elasticsearch Serverless project on Elastic Cloud.
- Ensure you have
ES_URLandAPI_KEYexported as environment variables. - (Optional) Use Docker to spin up a local MongoDB instance with sample data.
- Create and configure the connector:
- Create a connector using the Connector API, specifying the
mongodbservice type and the targetindex_name. - Configure the connector with MongoDB connection details (host, database, collection) using the update configuration endpoint.
- Create a connector using the Connector API, specifying the
- Start the connector service:
- Create a
config.ymlfile for the connector service. - Run the connector service using Docker.
- Create a
- Trigger a sync and verify data:
- Trigger an on-demand sync job.
- Verify the data has been synced by searching the Elasticsearch index.
- Configure sync rules and scheduling (optional):
- Set up advanced sync rules to filter data (e.g., only index products in stock).
- Enable sync scheduling to keep the Elasticsearch index up-to-date.
Background
Elasticsearch supports a range of ingestion methods. One of these is Elastic Connectors, which sync external data sources like SQL databases or SharePoint Online with your Elasticsearch index. Connectors are especially useful for building powerful search experiences on top of your existing data. For instance, if you manage an e-commerce website and want to enhance the customer experience with semantic search across your product catalog, Elastic Connectors make it easy. If your product catalog is stored in a database included in Elastic's supported connector sources, you're just a few clicks away from ingesting this data into your index. If your source isn’t currently supported, the connector framework enables you to implement custom connectors and modify existing ones. For more details, you can read How to create customized connectors for Elasticsearch.
With the Connector API now in beta, you can fully manage Elastic connectors directly from your command-line interface. This is especially useful for specific workflows, as it can automate connector management, monitoring and testing, removing the need to go back and forth between a terminal and the Kibana UI.
In this blog post, we will look into syncing a product catalog from MongoDB and indexing it into Elasticsearch to allow for building a search experience. Let’s get started!
Note: We will primarily use terminal commands to execute all steps. However, you can also manage your connectors via the Kibana UI by navigating to the Search -> Connectors section, or by using the Kibana dev console to execute the requests there. Additionally, all API calls are compatible with both Elasticsearch Serverless and any standard ES deployment, whether hosted on Elastic Cloud or your own infrastructure.
Prerequisites
- Docker installed on your machine
curlandjqavailable in your terminal- Elasticsearch Serverless or Elasticsearch version
>=8.14.0
Elasticsearch Serverless
We will ingest the data to Elasticsearch Serverless as it allows you to deploy and use Elastic for your use cases without managing the underlying Elastic cluster, such as nodes, data tiers, and scaling. Serverless instances are fully managed, autoscaled, and automatically upgraded by Elastic so you can focus more on gaining value and insight from your data.
You can create your serverless project by navigating to Elastic Cloud deployment overview and clicking Create project in the serverless section.
The next step is to select the right deployment type. Since we are interested in powering a search experience, let’s select Elasticsearch. Your new deployment should be ready within a few minutes.
To securely connect to the Elasticsearch cluster, ensure you have the ES_URL and API_KEY exported as environment variables in your shell console. You can locate their values and export them by following the steps outlined below.
Open your Elasticsearch deployment, and let’s select cURL as our client.

Generate an API key for your deployment, you can call it e.g connector-api-key.

Export the ES_URL and API_KEY to your shell console.

Great! That’s about it with the UI, now feel free to close your ES browser and let’s ingest some data.
Our product catalog
For this example, we assume the product catalog is stored in MongoDB. However, the product catalog could be hosted in any data source supported by Elastic connectors. For any data sources that are not yet supported, the framework allows for the definition of custom connectors.
If you need to set up a local MongoDB instance with example data, you can find a quick guide in the Appendix: Spin up MongoDB instance with Docker, or you can use any other existing MongoDB instances. Keep in mind, using a different instance might require adjustments to the connector configuration described below.
In the following steps, we assume our MongoDB instance includes a product_catalog database with a products collection that contains the following items:
Create a MongoDB connector
Now that we have our Elasticsearch running and our example product catalog ready to be synced, we can focus on indexing the data into Elasticsearch.
Let’s start by creating the connector. Our connector will sync the data from MongoDB to the product-catalog ES index. This index will be created with the appropriate mappings during the first data sync, we will get back to this later. Additionally, you can modify the connector index at any time using the update index name API call.
The connector should be created. Let’s define our working directory:
Let’s configure and start the self-managed connector service as described in the connectors documentation: Running from a Docker container:
Start the local connector service. Check the available versions in the official Docker repository and select the most recently published version.
Upon starting the connector service you should a log line looking like this:
Verify your connector is connected by using the get connector endpoint and inspect its status (should be needs_configuration) and last_seen field (note that time is reported in UTC). The last_seen field indicates that the connector successfully connected to Elasticsearch.
Note: we are using the jq, a lightweight command-line JSON processor to handle the raw response.
Now we have to configure the connector to authenticate against MongoDB with our product catalog. For guidance about connector configuration you can always use MongoDB connector reference docs. You can also inspect the registered schema in the connector’s configuration property returned as a part of the get request:
We can set the connector configuration values using the update configuration endpoint. Since connectors are stateless services that communicate with Elasticsearch via the Connector Protocol, you might need to wait a bit after the Connector service starts for the configuration schema to be registered. For our test setup, it should be sufficient to provide the required MongoDB host, database, and collection from which we want to sync the data. I’m intentionally skipping authentication with username and password as we are running MongoDB locally with security disabled to make our toy example simpler.
Triggering an on-demand sync
Now that we have the connector created and configured and the connector service is running locally we can sync the data to see if everything works end to end.
Upon the first sync the product-catalog index will be created.
It might take up to 30 seconds for the sync to start, you can check when the sync started by inspecting connector service logs, you should see something like:
Alternatively, you can check the status of your last sync job by listing the connector's sync jobs. Reviewing the status, error (if any), and indexed_document_count properties can help you understand the current job's state.
Once the sync job is created, its status will be set to pending, then the connector service will start execution of the sync and the status will change to in_progress.
Eventually the sync job will finish and its status will be set to completed (as in the response above). We can check additional sync stats such as indexed_document_count that is equal to 3 and it matches our dummy dataset count. Yay!
We can inspect the connector index to which the data was indexed, and we should see 3 items as well!
Keeping your ES index in sync with source
In a real life scenario the catalog would be changing. For example there can be changes in the stock count for existing items, or you might introduce more products to your catalog. In that case we can configure our connector to sync the data periodically to stay up-to-date with the source of truth in MongoDB.
Let’s enable sync scheduling and set it to run every 15 mins. We can use update scheduling endpoint for it:
As long as your connector service would keep running in the background it would take care of scheduling and starting sync jobs at the set time interval. Connector service is lightweight and won’t consume much resources when idle so it should be fine to have it running in the background.
Of course, at any point you can open Kibana and navigate to the Connectors tab to, for example, check their status, job history, or change their scheduling in the UI.

Sync Rules - Index only what you want
While your product catalog may feature thousands of items, perhaps only a handful are currently in stock (see stock_count in our example).
In the context of our product catalog, let's say we aim to index only those products that are in stock. Consequently, the product “Widget” which is out of stock, should be excluded from our search index.
There are two approaches supported by connector service to accomplish this:
- Basic Sync Rules: These rules enable you to filter content at the connector level before it is indexed to Elasticsearch (ES). Essentially, all data is retrieved from your source, but you can control which data to forward using basic filtering rules. This functionality is available for all connectors.
- Advanced Sync Rules: This method allows you to filter data directly at the source. Consider an SQL statement like:
SELECT * WHERE stock_count > 0;, it enables you to fetch only the data you need from your source. Advanced sync rules can significantly improve sync times, especially when indexing only a fraction of your complete dataset. Note that advanced filtering is available for a select group of connectors.
In our case, see MongoDB connector documentation about supported sync rules. We can set the advanced filtering rule to index only in-stock products with the update filtering endpoint that allows you to draft sync rules:
Now the connector will validate the draft of sync rules. The initial draft validation state wil be edited. If the provided sync rule draft is valid its validation state will be marked as valid and the draft sync rules will be activated by the running connector service.
You can always check the validation status of your sync rule draft by inspecting the output of GET _connector/product-catalog-connector request. If your draft has been validated you should see:
- its filtering draft validation status marked as
valid - it should be listed as an
activefiltering (since your draft was activated)
In case the advanced filtering rule is not syntactically correct, e.g. the filter keyword in MongoDB query would have a typo filterrr, you should see appropriate error in the draft’s validation section, example:
The next sync should only index items that are in stock, so now you should find 2 products in your search index that have stock_count bigger than 0.
Generate vector embeddings at ingest time
To enable semantic search, generate vector embeddings of your data during ingestion. You'll need to adjust your index mappings and create an ingest pipeline. For detailed instructions, check out this section from: Using Elasticsearch as a vector database or refer to Tutorial: semantic search with ELSER.
Once your pipeline is created and configured, and assuming it's named e5-small-product-catalog, you can add the custom ingest pipeline to your connector using the following command:
This would automate vector embeddings generation for your data every time it syncs from the source.
Monitoring your connectors
There are two endpoints that are particularly useful for connectors monitoring:
For example, you could set up a periodic connector health check that would:
- Retrieve IDs of all connectors
- For each connector ID, retrieve associate sync jobs
- Record a sync job type (
full,incremental,access_control) - Track its status, e.g.
pending,in_progress,error,canceledorcompleted - Track the average sync duration
- Track any errors
- Record a sync job type (
The API calls would look as follows, starting with retrieving your connector ID:
For each connector from the above call, let’s list its sync job history, note jobs are listed in the most-recent order:
If your connector handles sync jobs of various types, you can set the job_type URL parameter to full, incremental, or access_control. If this parameter is not provided, the response will not be filtered by job type.
You could use the status field to monitor your system's health. Consider these scenarios:
- If the percentage of failed jobs (
status == error) is increasing, it might indicate issues with your data source or Elasticsearch cluster. In such cases, examine the populated error field to identify the specific problem. - If the number of pending jobs (
status == pending) is rising, it could suggest that your connector service is unable to maintain the desired schedule. For instance, syncing a large data source with a schedule set to run every minute might lead to backpressure in the framework. New pending jobs will continue to be scheduled, but we may not start and complete them before the next scheduled jobs are due to begin.
Additionally, you can use started_at and completed_at to track the average duration of a sync. A sudden change in average sync duration might be a good condition to raise an automated alert.
Tips on automation
The Connector API can be a powerful tool for supporting automation. Here are a few tips for automating your workflows.
- When using version control for connector configurations, be careful not to expose configuration values. Utilize dedicated solutions like GitHub environment variables or integrations with services such as Vault.
- The same caution applies to any credentials (username, password, and API key) used to connect to Elasticsearch.
- Any change applied to connector service
config.yml(e.g. adding a new connector) requires a service restart.
Next steps
Now, the connector service will continuously sync your database with the Elasticsearch index, allowing you to shift your focus to refining the search experience built on top of our data.
If you wish to incorporate more data from additional sources, you can set up and configure more connectors. Refer to Elastic’s connector catalog for supported data sources. If your source is not currently supported, the connector framework allows you to develop custom connectors and modify existing ones. For more details, see the guide on creating customized connectors for Elasticsearch.
Using Elasticsearch Serverless offers significant benefits for any developer. It is fully managed, autoscales, and is automatically upgraded by Elastic, granting you access to new features and capabilities as soon as they are released. This allows you to focus more on gaining value and insights from your data without the need to manage the underlying cluster.
For the next steps for building a search experience, I recommend reading the following articles:
- Semantic Search documentation
- Tutorial: semantic search with ELSER
- Adding Document Level Security (DLS) to your Internal Knowledge Search
- RBAC and RAG - Best Friends
Also, explore our Elasticsearch client libraries, which can help accelerate the development of your search experience.
Appendix
Spin up MongoDB instance with Docker
Let’s use Docker to spin up a database with some example data for the purpose of this blog post.
Once the instance starts you can prepare and copy the script to insert dummy data to your product catalog.
Here is the insert-data.js
Copy the script to container and insert data into MongoDB:
You can verify your data is present by querying for entries from product_catalog db, this command should return your 3 entries:
Now you should have your MongoDB instance running with the product catalog data ready to be used with this example.
Frequently Asked Questions
What is the Elastic Connector API used for?
The Elastic Connector API is used to fully manage Elastic connectors directly from your command-line interface. This is especially useful for specific workflows, as it can automate connector management, monitoring and testing, removing the need to go back and forth between a terminal and the Kibana UI.
Related Content
December 16, 2025
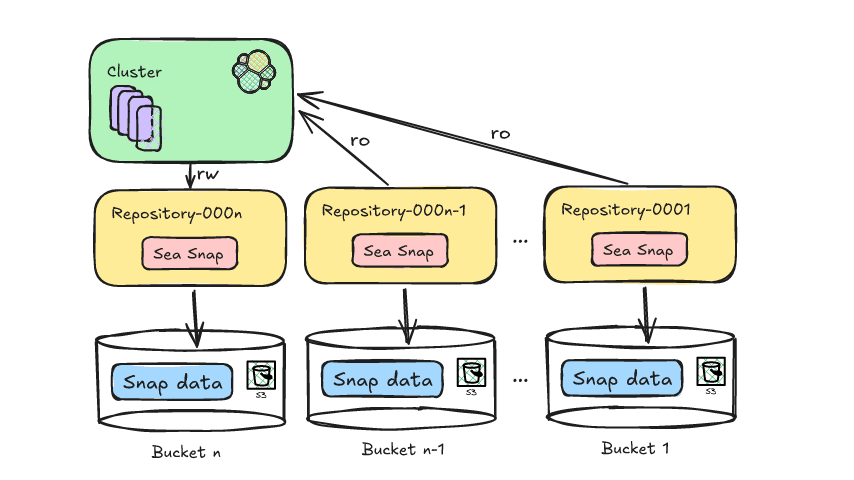
Reducing Elasticsearch frozen tier costs with Deepfreeze S3 Glacier archival
Learn how to leverage Deepfreeze in Elasticsearch to automate searchable snapshot repository rotation, retaining historical data and aging it into lower cost S3 Glacier tiers after index deletion.

September 22, 2025
Elastic Open Web Crawler as a code
Learn how to use GitHub Actions to manage Elastic Open Crawler configurations, so every time we push changes to the repository, the changes are automatically applied to the deployed instance of the crawler.

August 6, 2025
How to display fields of an Elasticsearch index
Learn how to display fields of an Elasticsearch index using the _mapping and _search APIs, sub-fields, synthetic _source, and runtime fields.

July 14, 2025
Run Elastic Open Crawler in Windows with Docker
Learn how to use Docker to get Open Crawler working in a Windows environment.

June 24, 2025
Ruby scripting in Logstash
Learn about the Logstash Ruby filter plugin for advanced data transformation in your Logstash pipeline.