New to Elasticsearch? Join our getting started with Elasticsearch webinar. You can also start a free cloud trial or try Elastic on your machine now.
I am probably not the only one who was a little disapointed by the Spotify Wrapped this year (and the internet seems to agree). Looking back at our yearly musical history has become a highly anticipated moment of the year for heavy Spotify users. However, at the end of the day all "Wrapped" is, is a data analytics problem, with a great PR team. So perhaps the mantle must fall on fellow data analysts to attempt to solve this problem in a more satisfying way.
With the back-to-work and brand-new-year motivation fueling us - let's see if we can do any better. (Spoiler alert: we definitely can!)
Getting started with your custom Spotify Wrapped
The best part about this exercise is that it's fully replicable. Spotify allows users to download their own historical streaming data via this link, which you can request out of your account settings. If you want to generate your own version of this dashboard - request your own data to run this example through! Please note, that this could take a few days to a few weeks but should take no longer than 30 days. You will need to confirm that you would like this data and a copy will be sent to your email directly.
Alternatively, you can try it out first on the sample data I've provided with a reduced sub-section from my own data.
Once this has been generated we can dive into years worth of data and start building our own fun dashboards. Check out this notebook for the code examples. These were built and run using Elasticsearch 8.15 and Python 3.11.
To get started with this notebook be sure to first clone the repository and download the required packages:
Historical data will be generated as a list of JSON documents pre-formatted and chunked by Spotify, where each json represents an action. In most cases such an action means a song that you've listened to with some additional metadata such as length of time in milliseconds, artist information, as well as device properties. Naturally, if you have any experience with Elastic, the first thought looking at this data would be that this data practically screams "add me to an index and search me!". So we will do just that.
Building an Elasticsearch Index
As you can see in the same notebook once you've connected to your preferred Elasticsearch client (in my case Python, but any language client could be used), it takes a few simple lines of code to send the json documents into a new index:
Even the mapping is handled automatically by Elastic due to the high quality and consistency of the data as prepared by Spotify, so you do not need to define it when indexing. One key element to pay attention to is noticing fields like "Artist Name" are seen as keywords which will allow us to run more complex aggregations for our dashboards.
Wrapping queries to explore your listening habits
With the index fully populated you can explore the data through code to run a few simple test queries. For example, my top artist has been Hozier for quite a few years now, so I start with the simplest possible term query to check my data:
This gives me back 5653 hits - which means I've played more than five thousand Hozier songs since 2015 (as far as my data goes back). Seems pretty accurate. You can run the same test, or query any of the other fields like album name or song title with a simple text match query.
The next steps in the notebook are to build more complex queries, like the most anticipated question - is my top artist list in Wrapped accurate?
You can calculate this by either number of hits (how many times songs have been played) or perhaps more accurately, by summing up the total number of milliseconds of playtime by artist bucket.
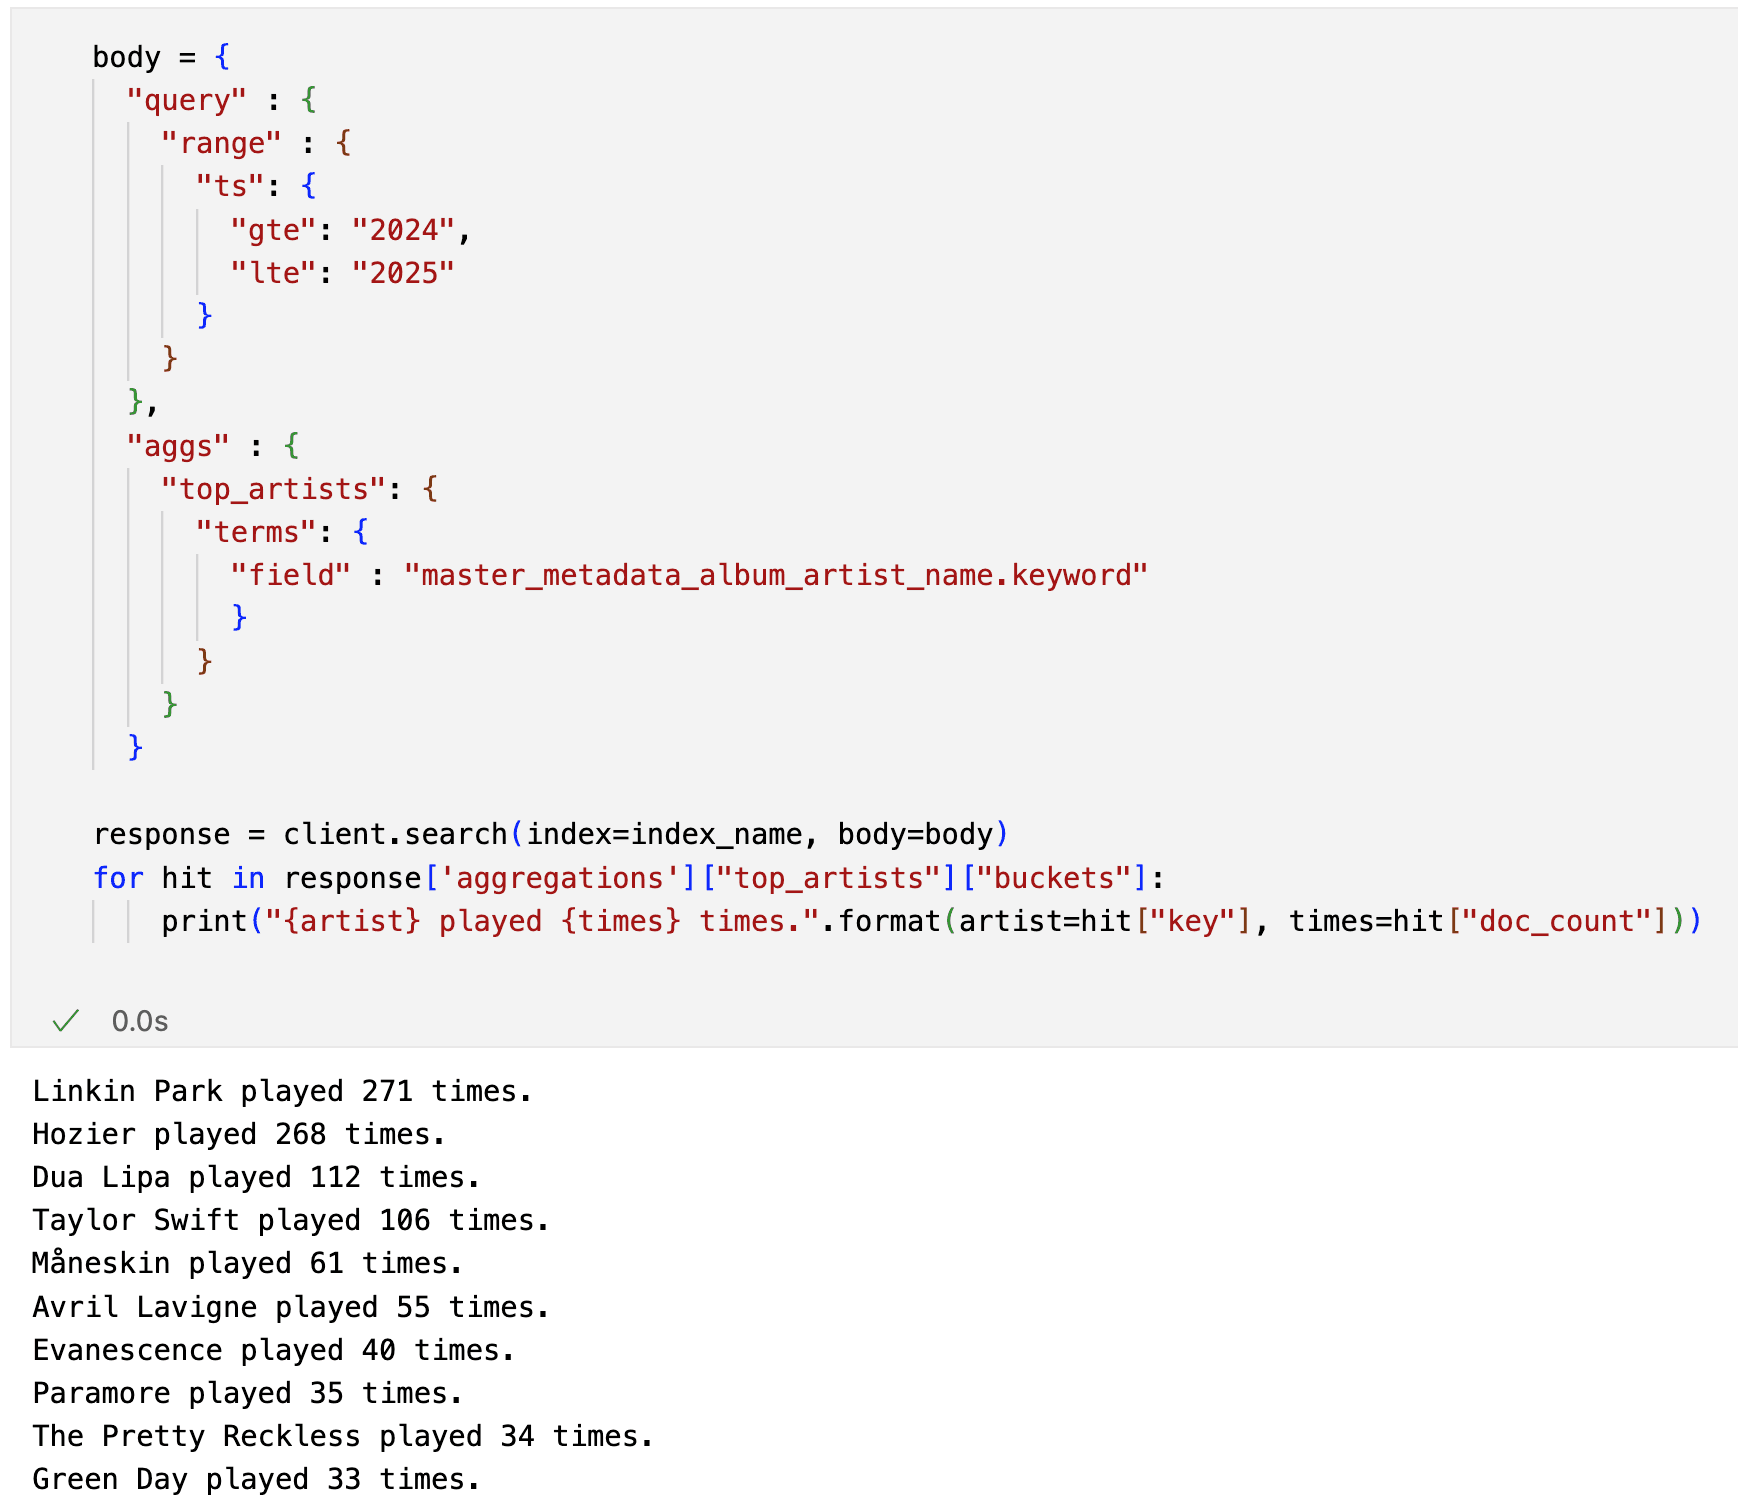
You can read more about aggregations in Elasticsearch here.
Building Spotify Wrapped dashboards
After these few examples you should have a good understanding of the Elasticsearch mechanics you can use to drill into this data. However, to both save time and make the insights more consumable (and pretty) you can also build a lot of these insights directly in a Kibana dashboard.
In my case, I've run these in my cloud Elastic cluster but this can also be run locally. You first need to build a data view from the index and then you can directly build visualizations by dragging the data fields and choosing view types. The best part is - you can really make it your own by choosing the visualization type, date range you want to explore, which fields to showcase, etc. Just pick a visual and drag the needed fields into the graph. For most examples we will use ts (the time field) as a horizontal axis, and a combination of record counts or aggregations over the song_name or artist_name fields on the vertical axis.
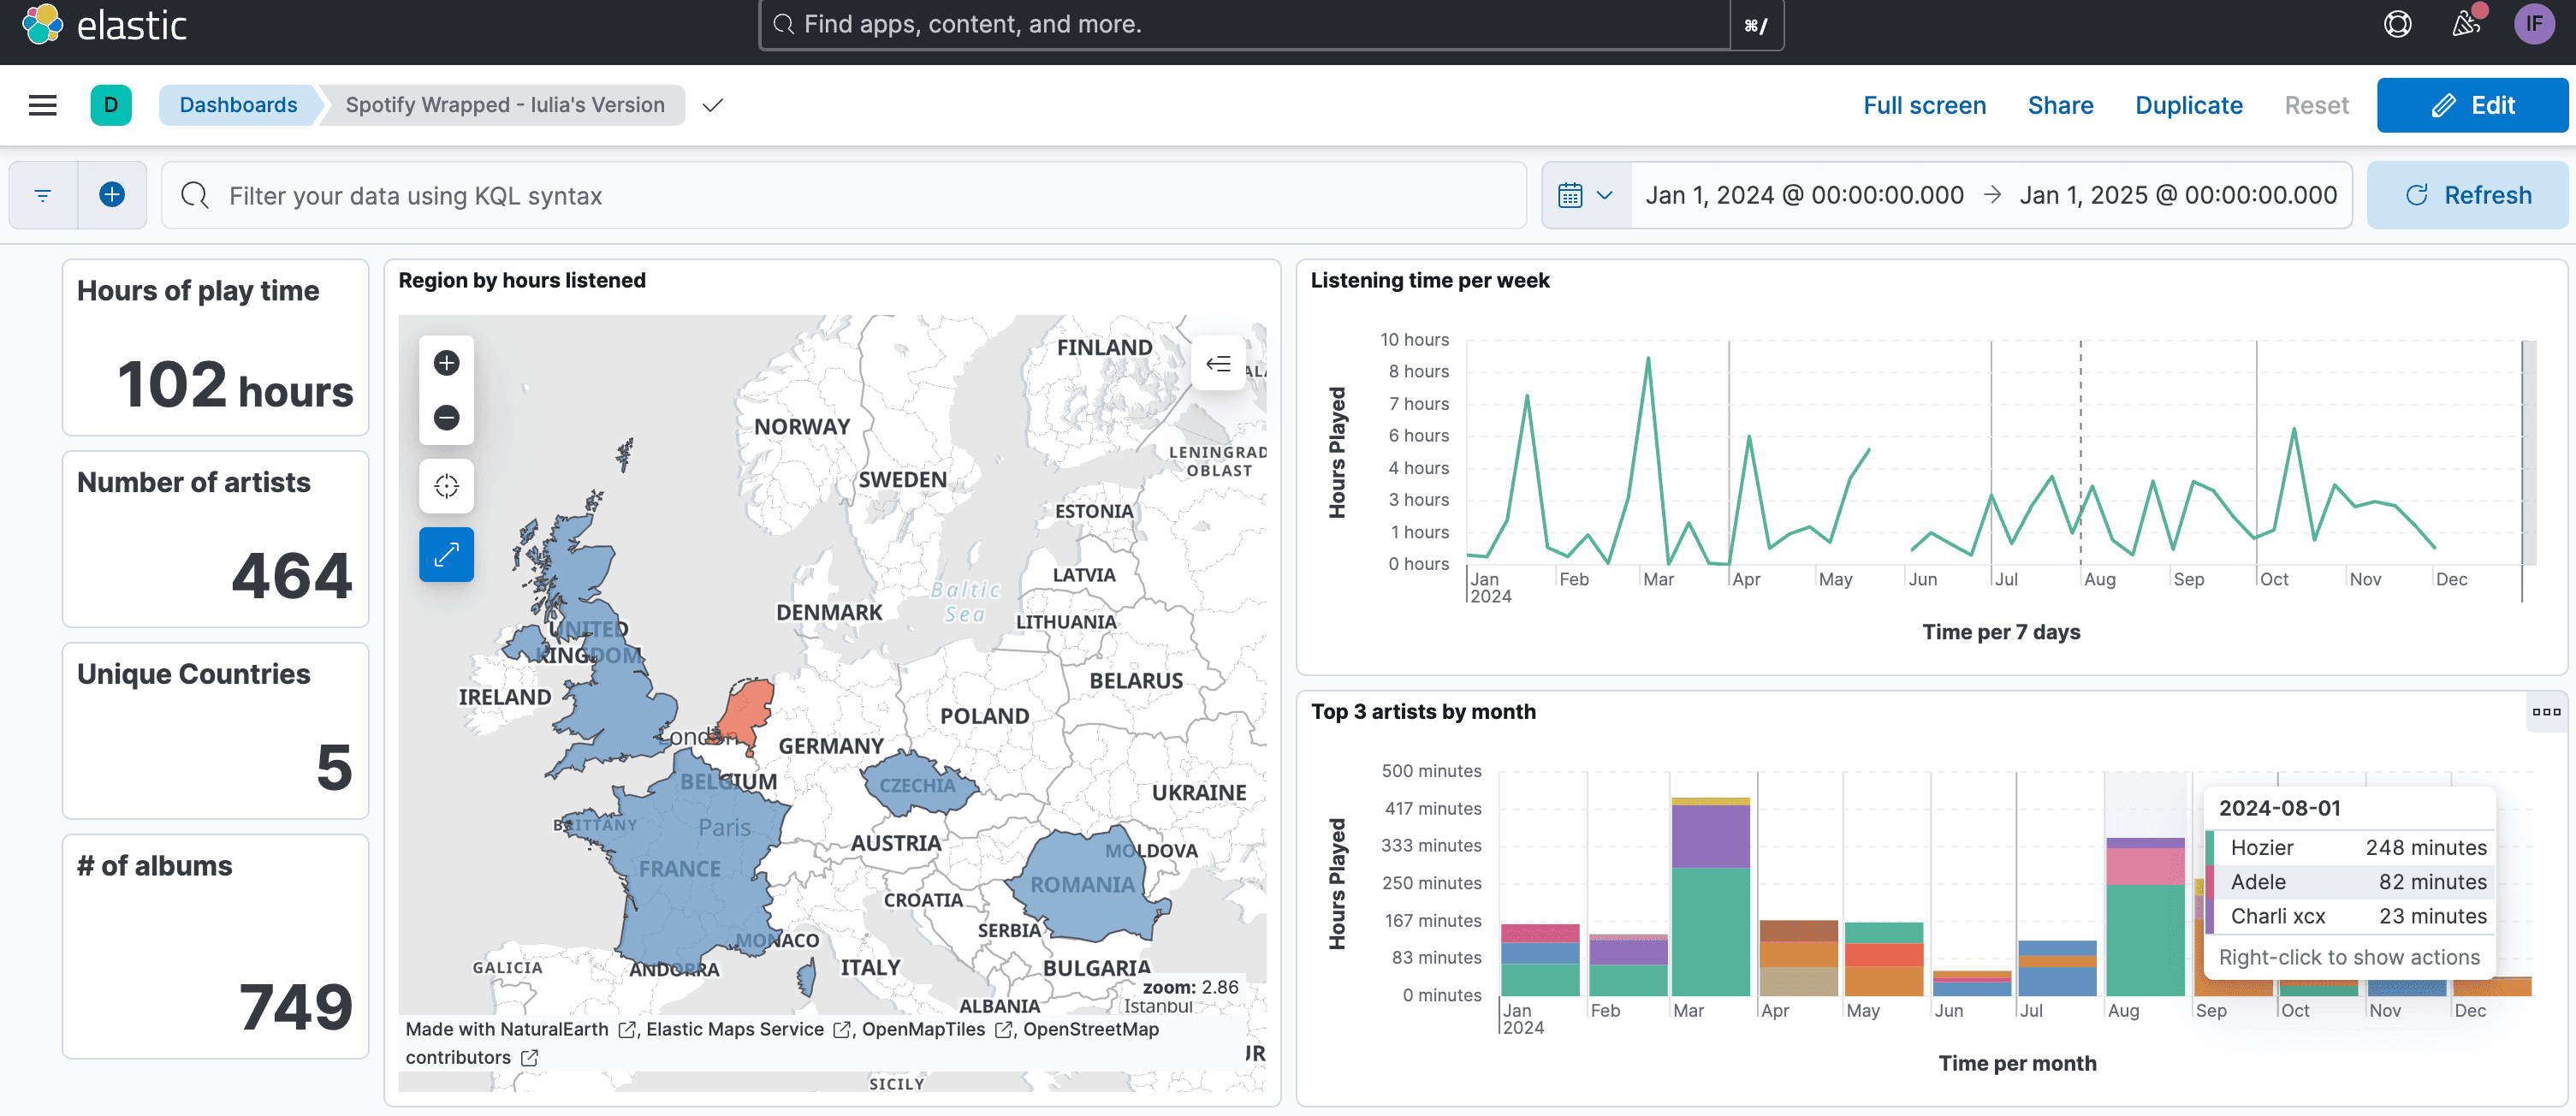
Within a few hours I built my own Spotify Wrapped - Iulia's Version, going deeper than ever before. Let's take a look.
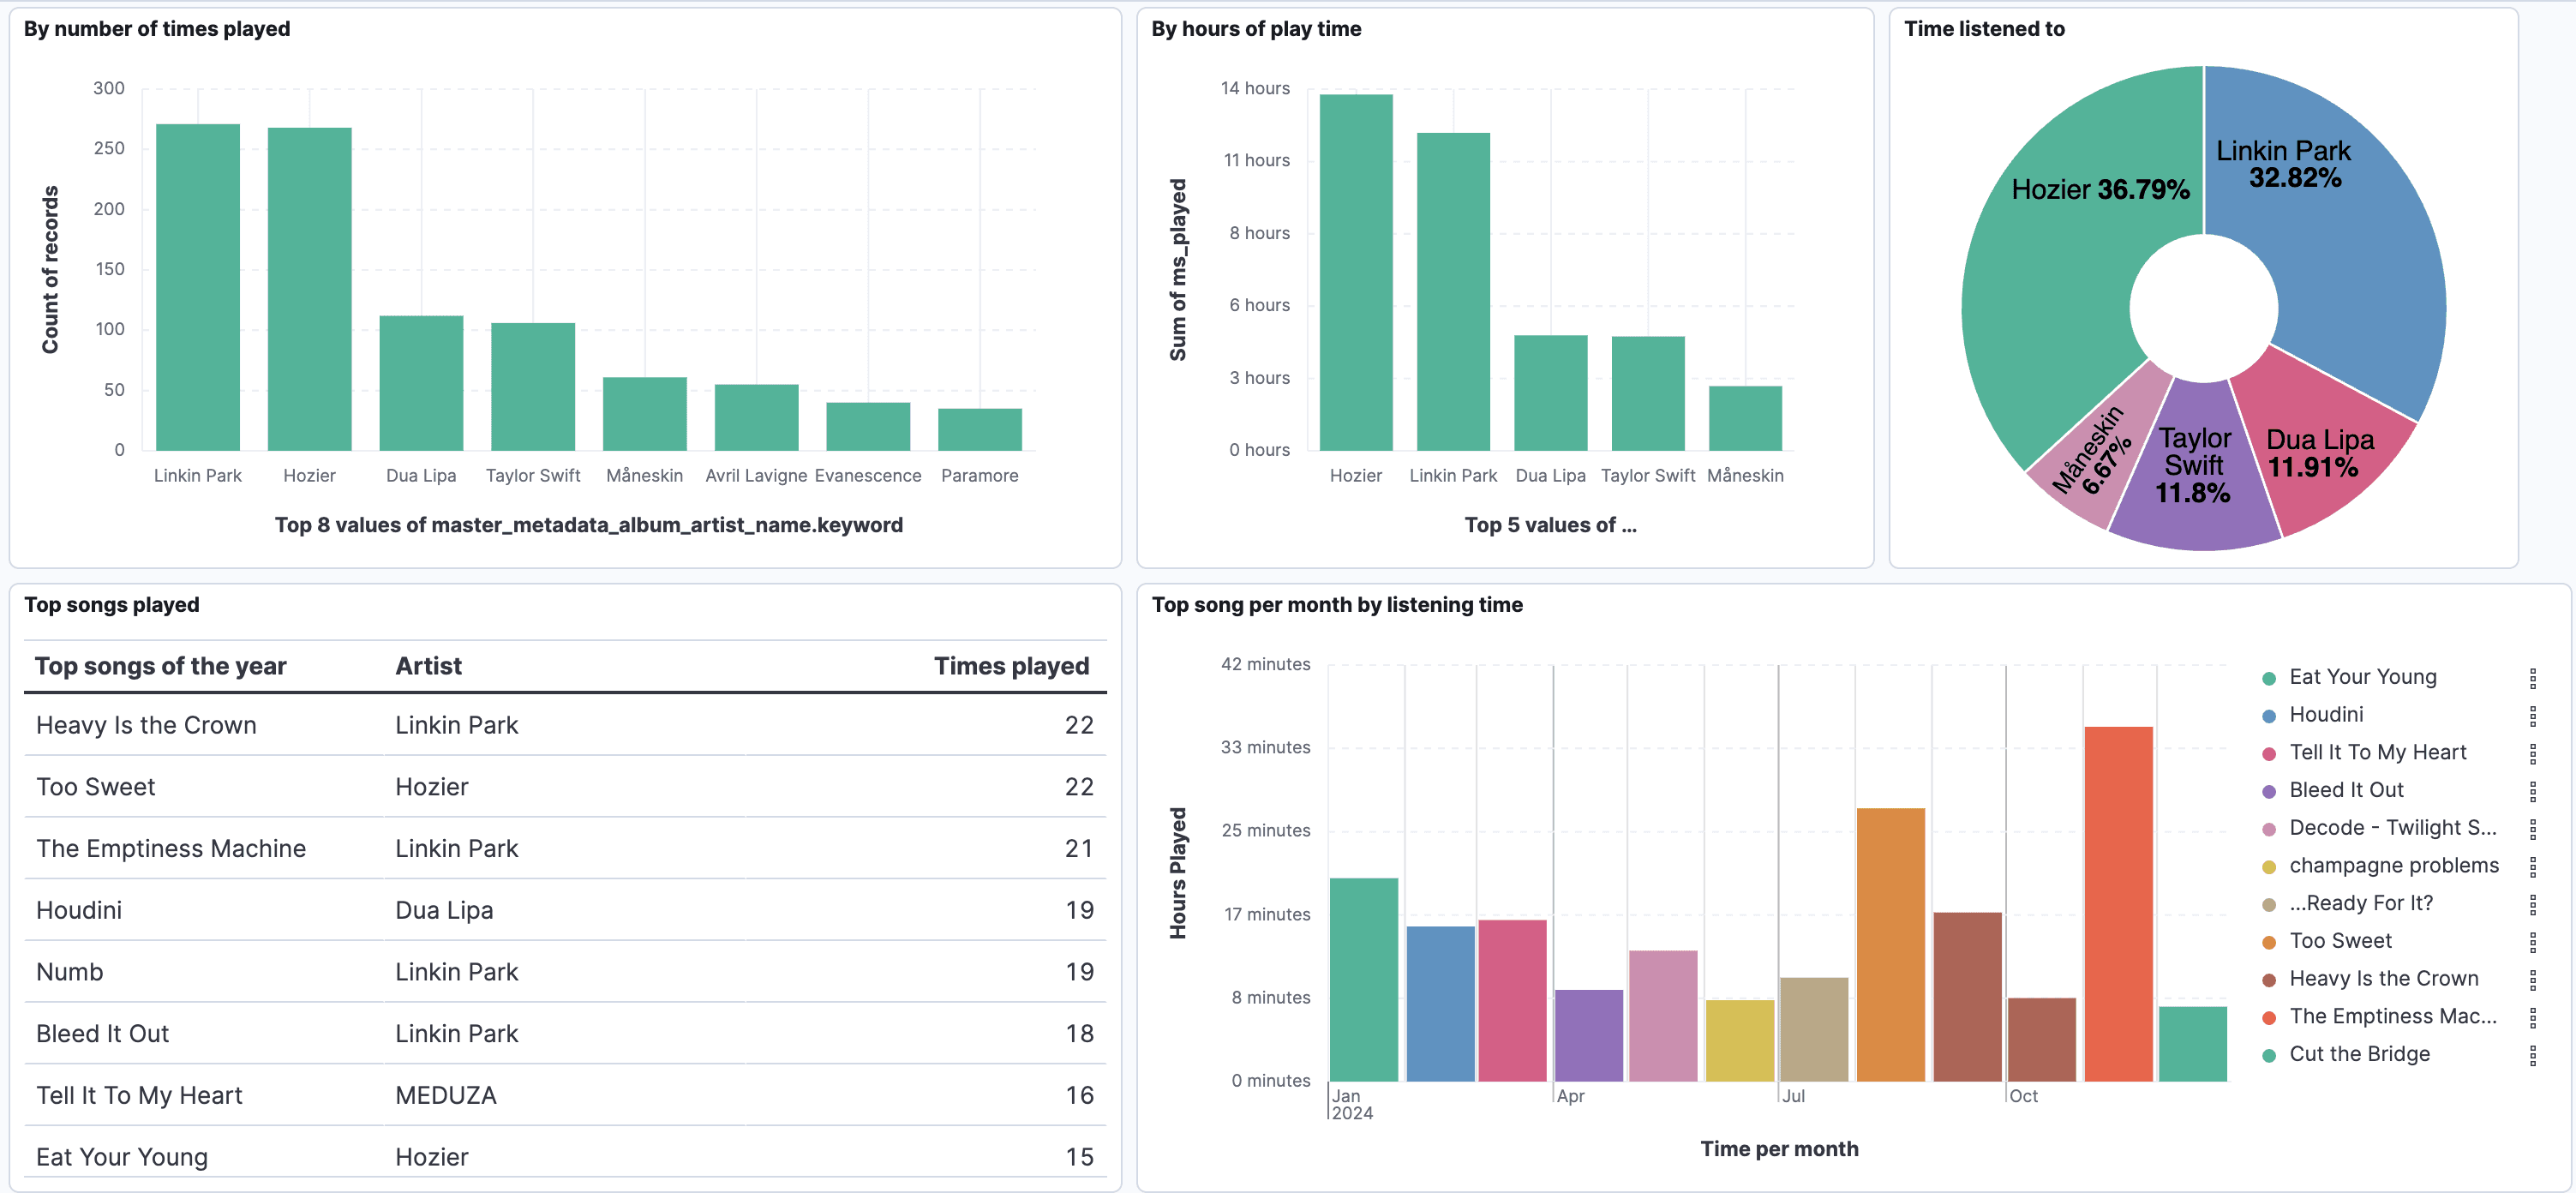
Starting with the "classic" wrapped insights - I've first built the top artist and song rank.
Here's an example of how one of these graphs is built:
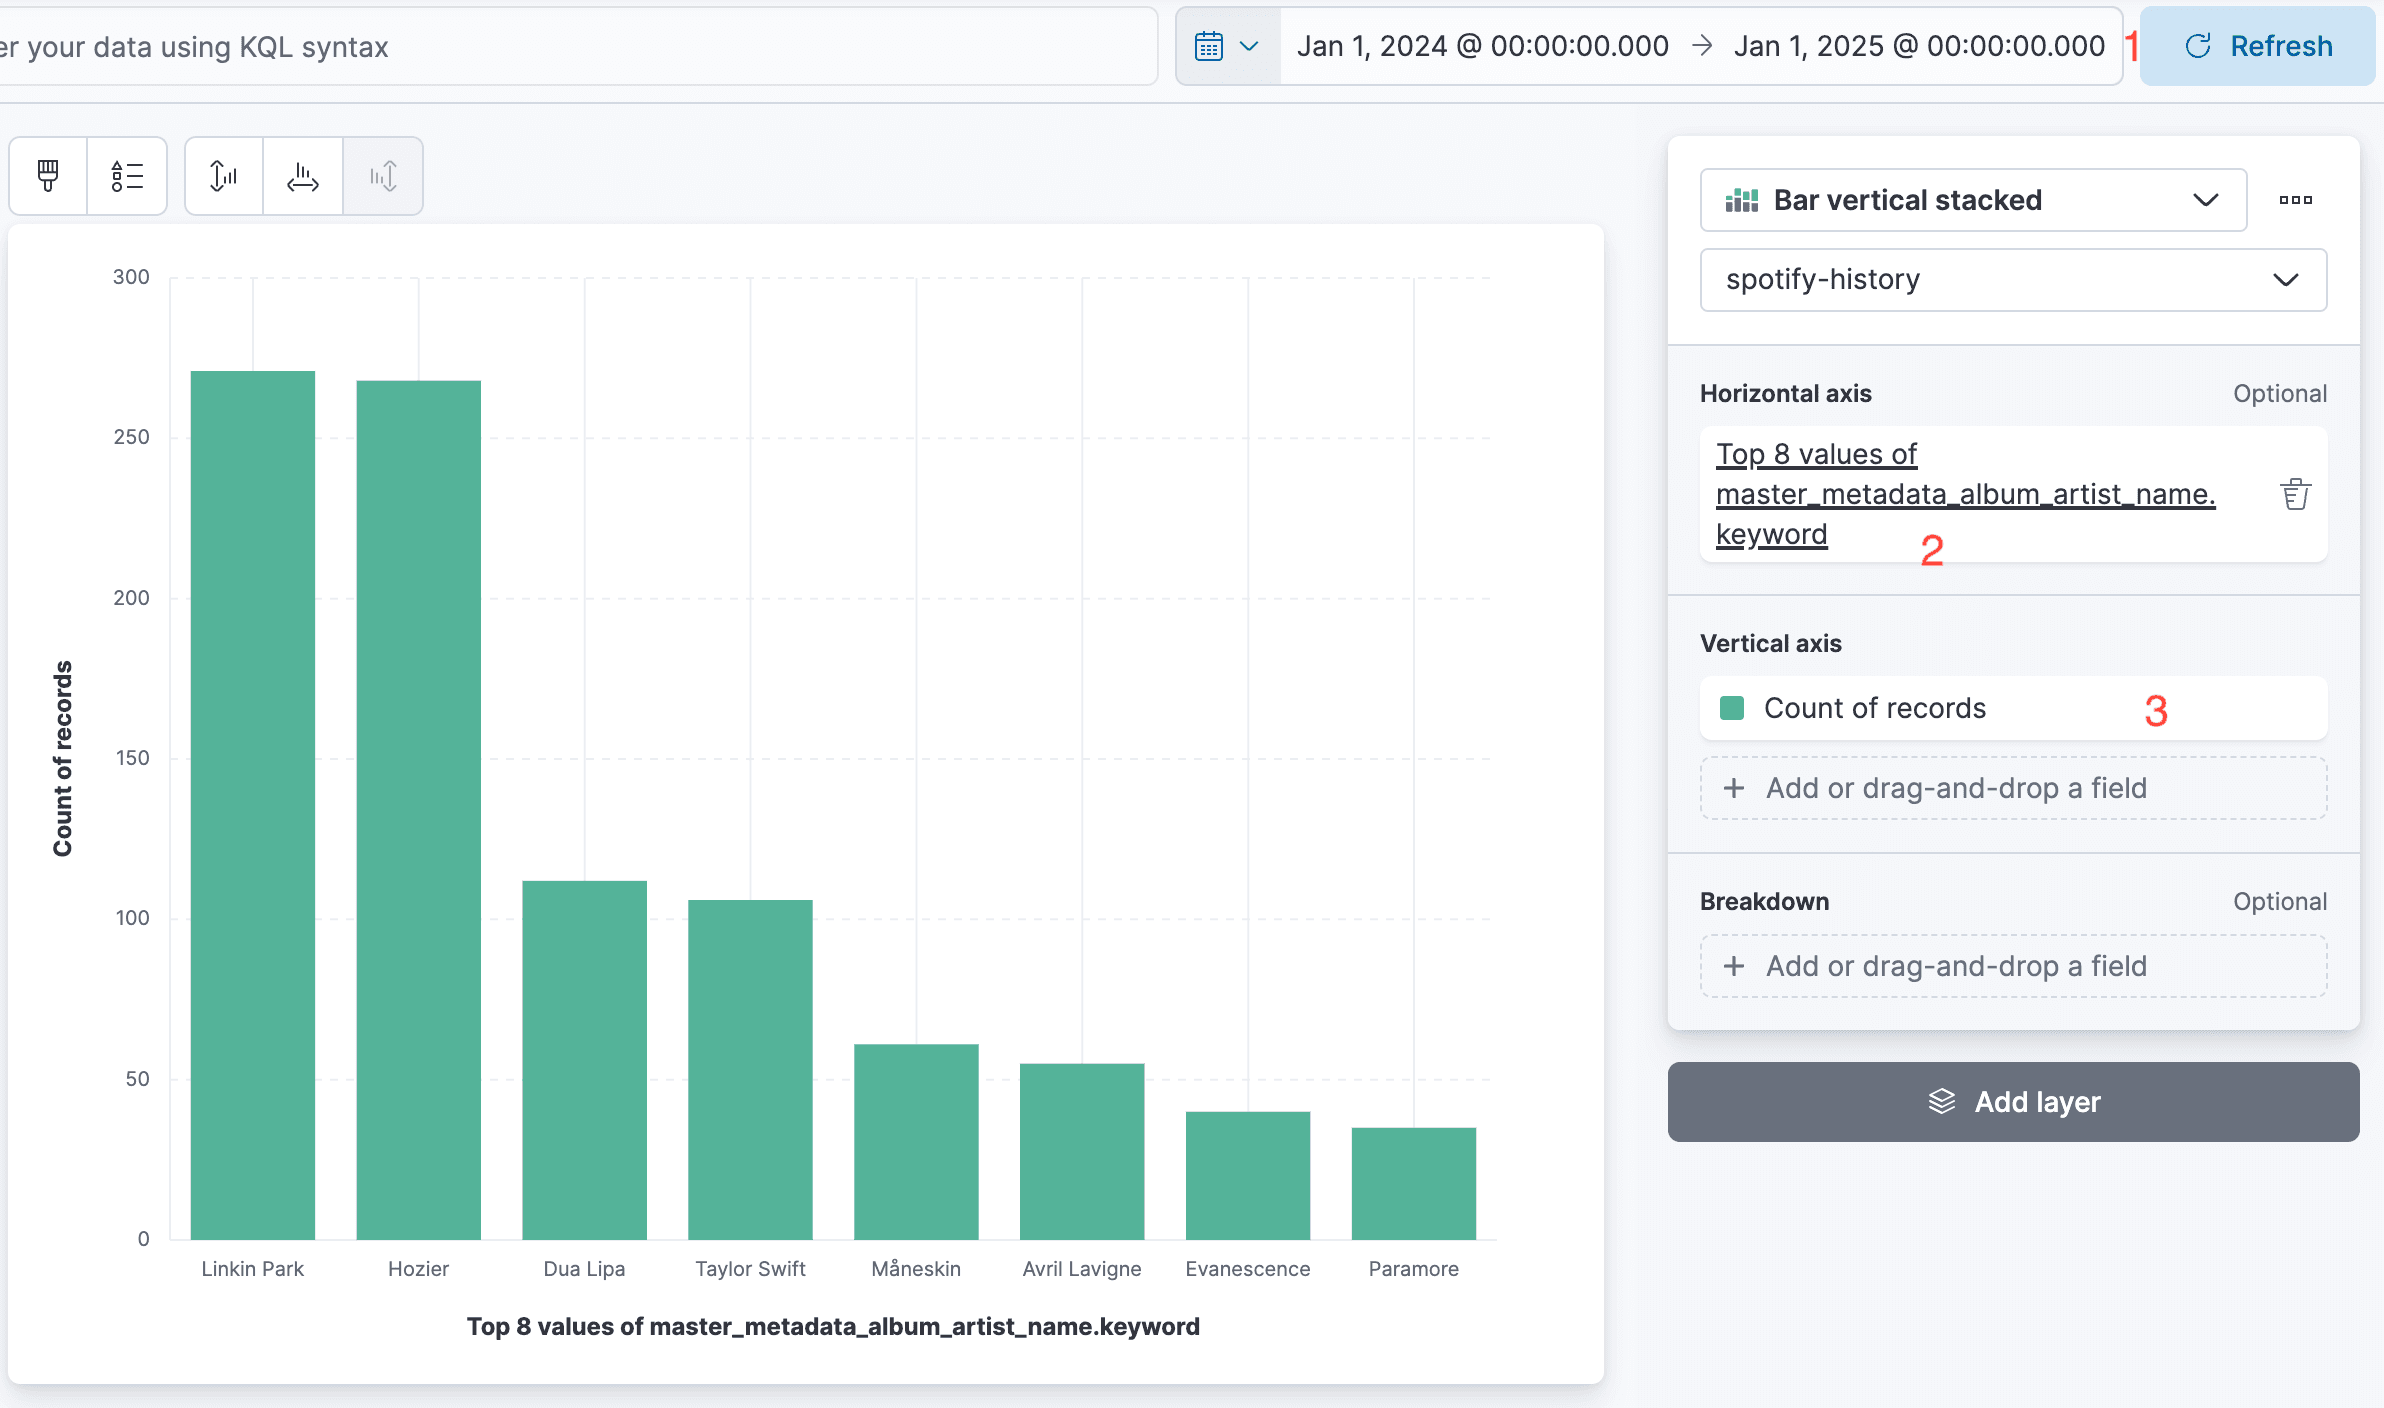
Looking at the points of interest in this graph if you want to recreate it:
- make sure to select the correct time interval for your data to cover 2024 in
1 - choose to show the
top valuesof the artist name field, and exclude theotherbucket to make your visualization neat in2 - map this against the count of records to rank the artists based on how many times they appear in the data (equivalent to time the songs were played) in
3
From here, I've gone even further by adding more metadata like time or location and looking at how these trends have changed throughout the year. Here you can see the listening time over the year (in weekly buckets), the locations I've been listening from while traveling, and how my top artists have varied month by month (including a sighting of brat summer).
Some more tricks worth noting for these graphs:
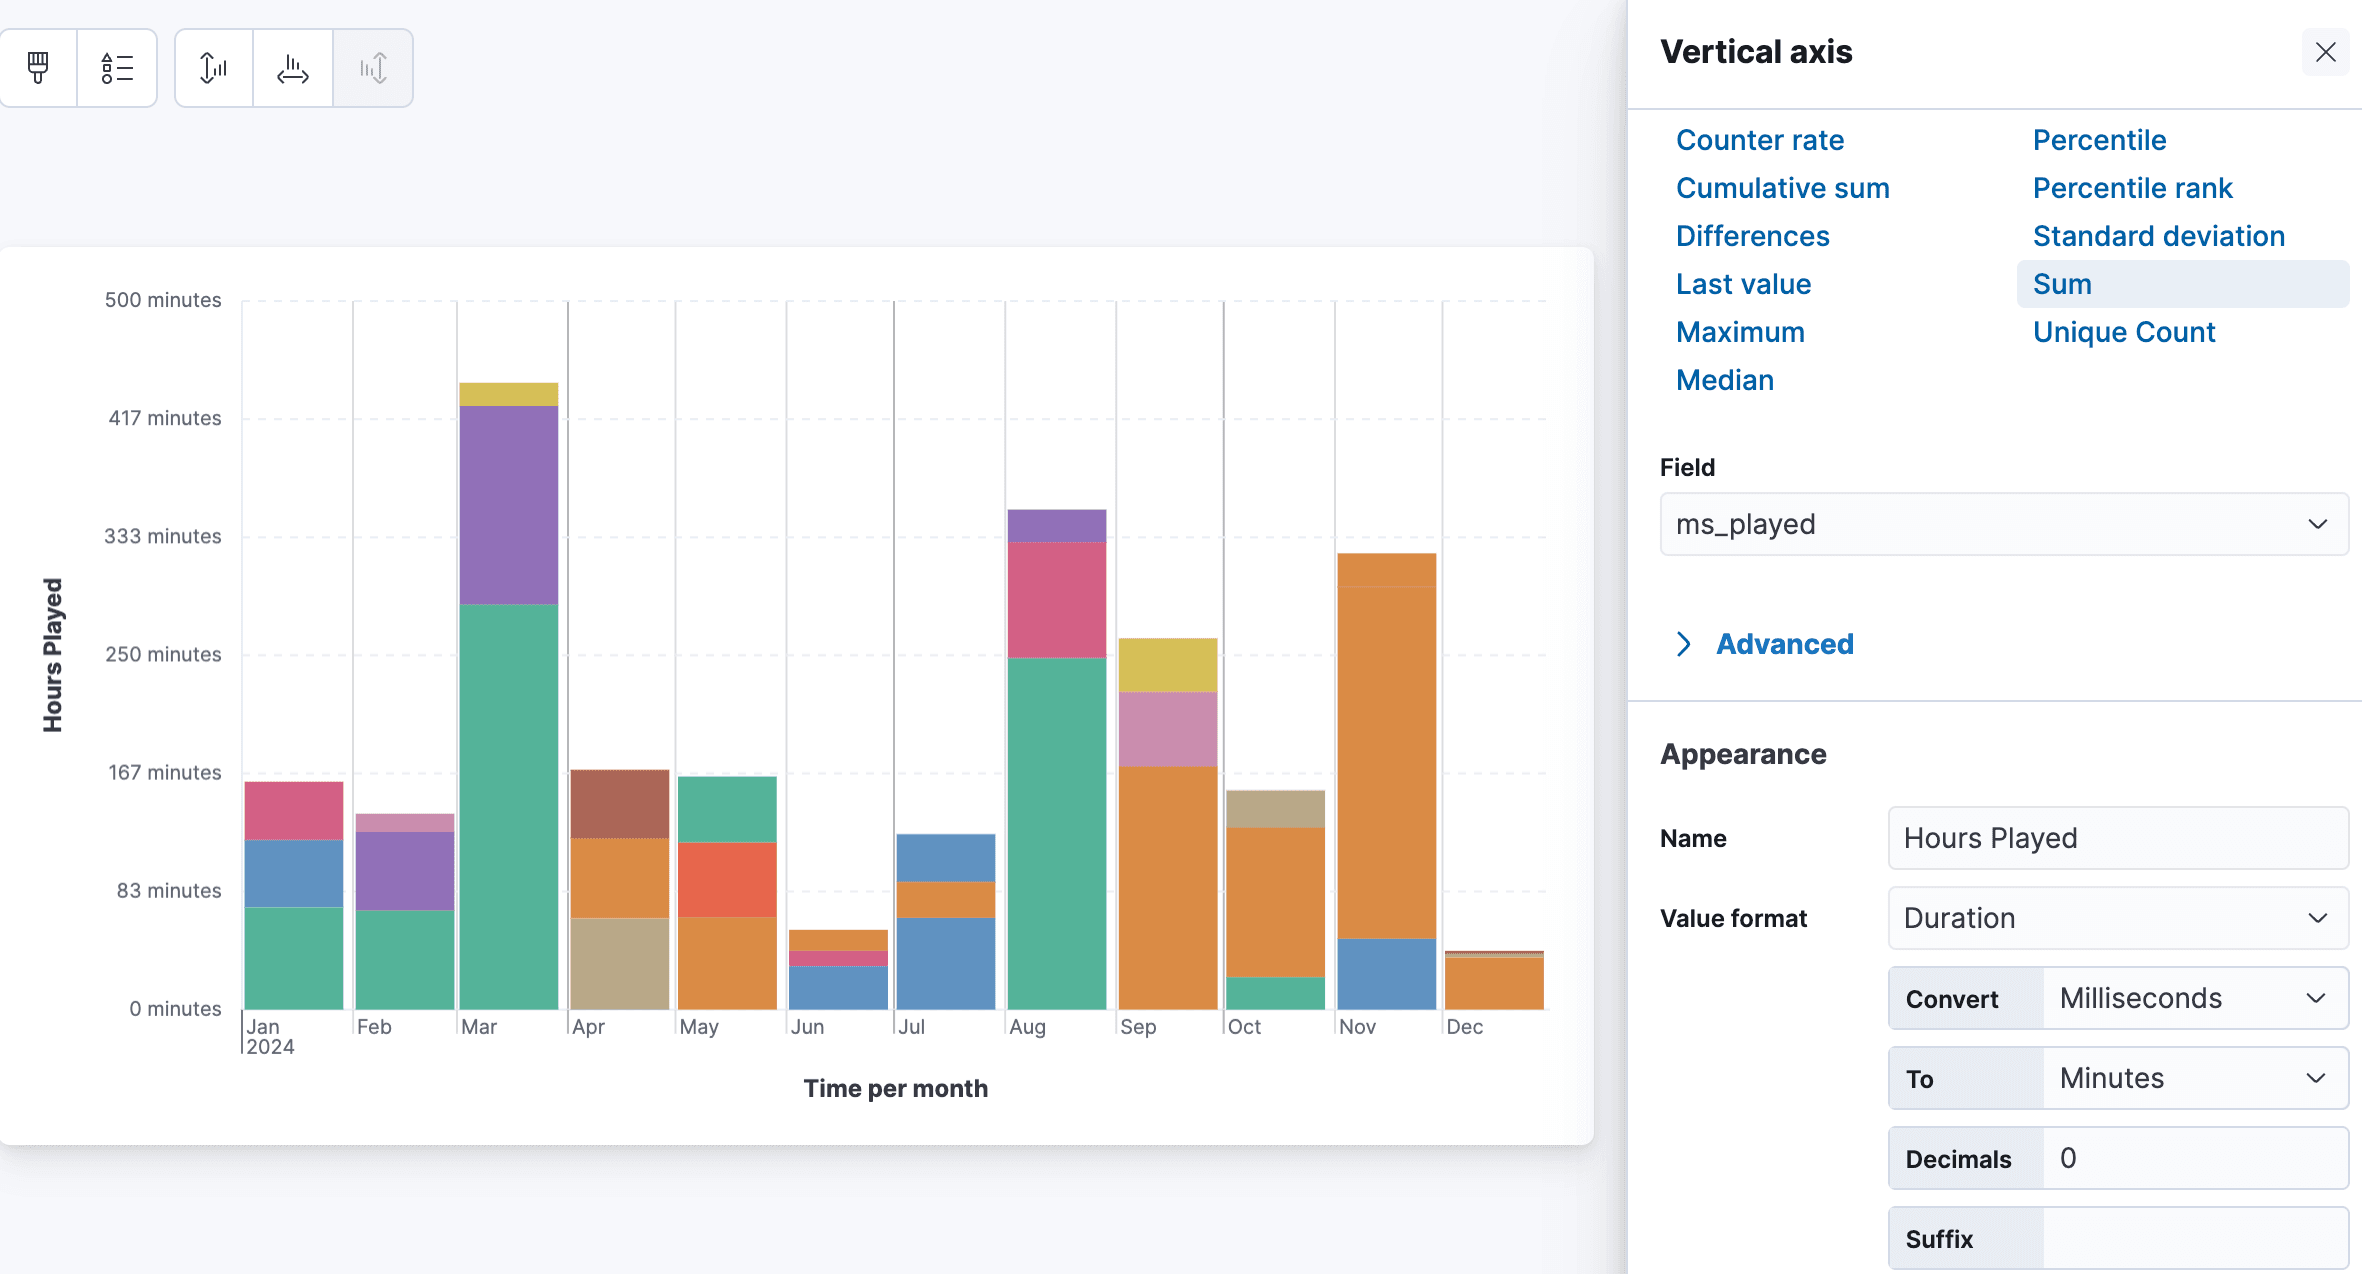
- when you work with the playing time instead of just count of records, you should choose to aggregate all the instances of a song or artist being played by using the
sumfunction. This is the kibana equivalent to theaggsoperator we were using in the code in the first notebook examples. - you can additionally convert the milliseconds into minutes or hours for neater visualisation *you can layer as many field breakdowns as you want, like for example adding the
top 3 artists nameon top of the monthly aggregations.
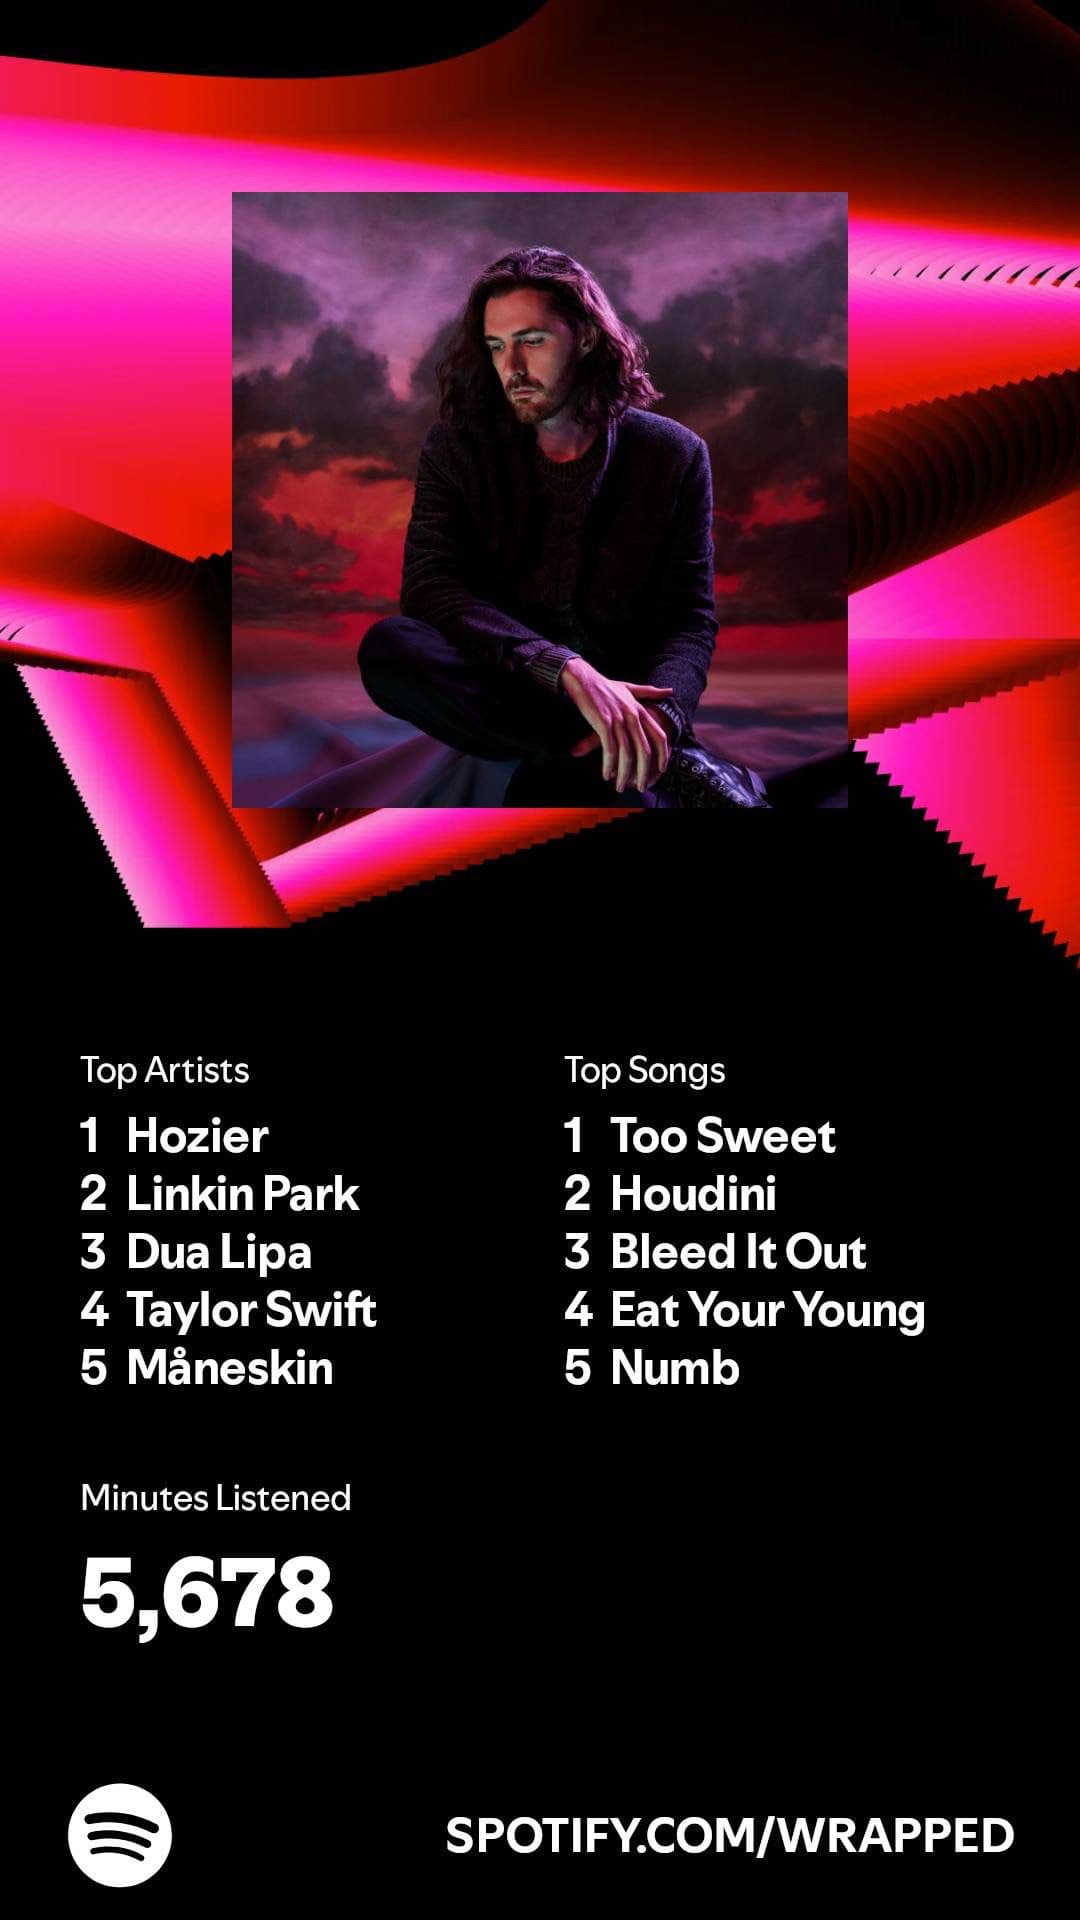
Comparing my final dashboard to my actual Wrapped - it seems the results were close enough, but maybe not entirely accurate. It seems this year the top song choices are a little off from the way I calculate my ranking in this example. It could be that Spotify used a different formula to build this ranking, which makes it a bit harder to interpret. That's one of the benefits of building this dashboard from scratch - you have full transparency on the type of aggregations and scoring used for your insights.
Finally, to really drive the point of the full customization benefit - I've had my colleague Elisheva also send me her own 2024 data. Here's another dashboard example, this time with a few more swifty insights:
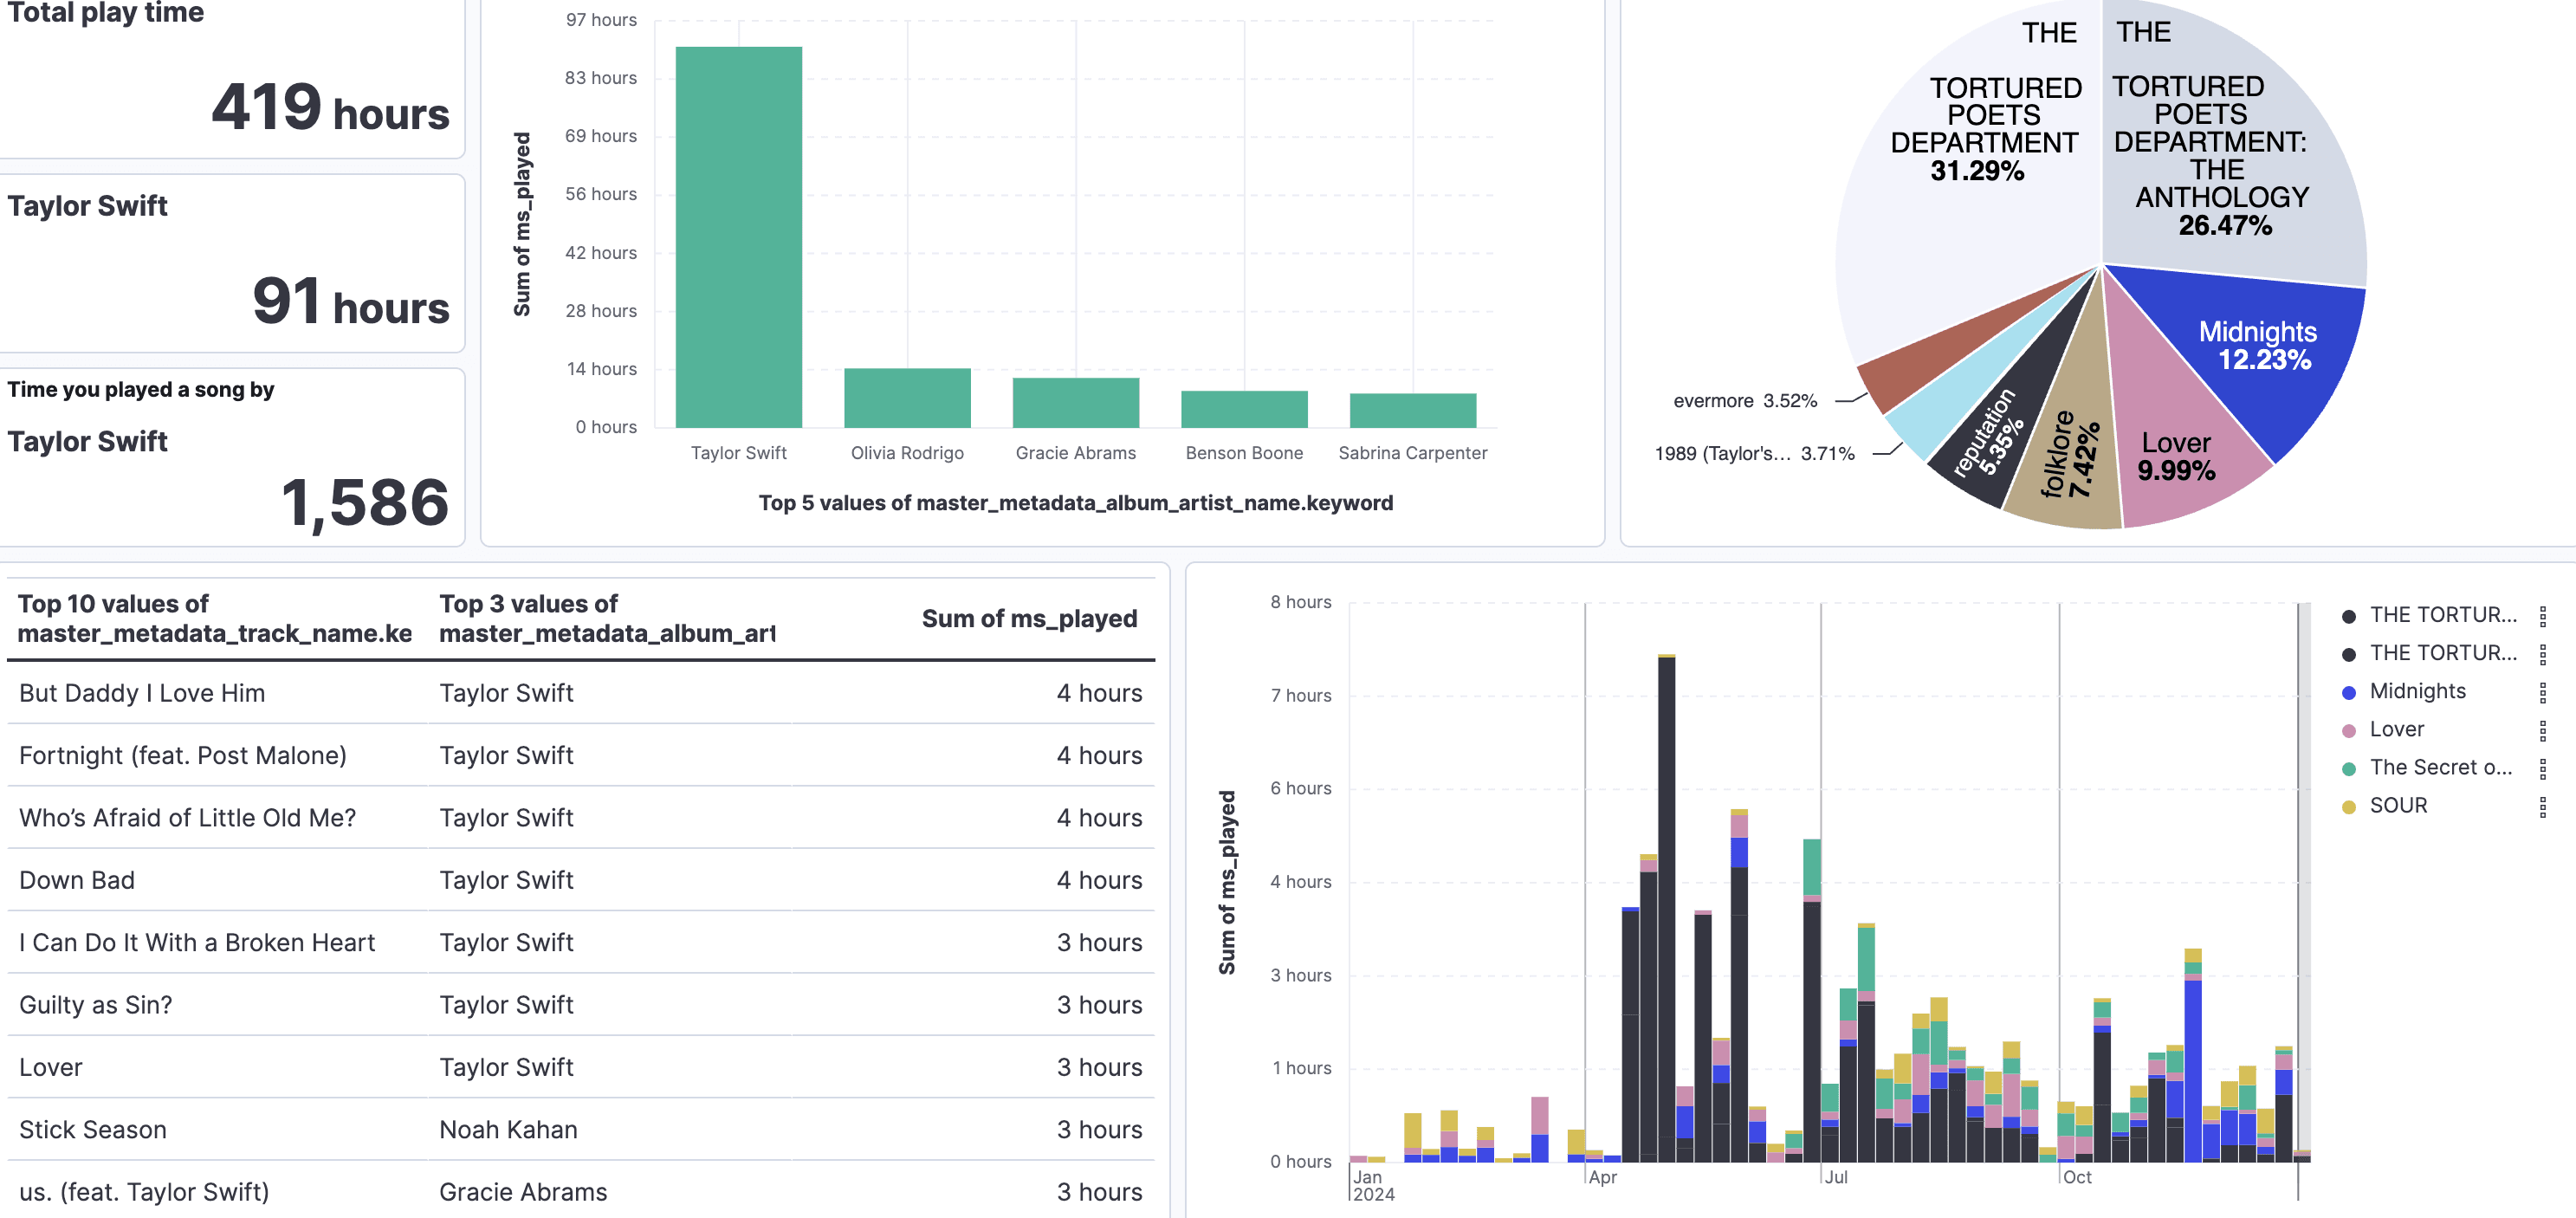
This time I've highlighted the albums breakdown since it gives some cool "Eras" insights' and added the "hours of playtime per album per month" - from which you can really pinpoint when Tortured Poets came out as an extra fun treat.
Make your own Spotify Wrapped
Just having the data stored in an index makes this a really fun and simple Elasticsearch use case, really showcasing some of the coolest features like aggregations or custom visualizations - and I hope to inspire you to try out your very own search engine and personal dashboard!
Explore other parts of this series:
Frequently Asked Questions
How can I make my own Spotify Wrapped?
You can make your own Spotify Wrapped by downloading your Spotify personal history, indexing it in Elasticsearch, and building dashboards in Kibana to visualize your top songs, artists, and listening habits.
What tools do I need to make a custom Spotify Wrapped?
In order to make a custom Spotify Wrapped, you'll need your Spotify personal history, Elasticsearch, and Kibana.

