Get visibility into AWS Lambda serverless functions with Elastic Observability

Adoption of AWS Lambda functions in cloud-native applications has increased exponentially over the past few years. Serverless functions, such as the AWS Lambda service, provide a high level of abstraction from the underlying infrastructure and orchestration, given these tasks are managed by the cloud provider. Software development teams can then focus on the implementation of business and application logic.
Some additional benefits include billing for serverless functions based on the actual compute and memory resources consumed, along with automatic on-demand scaling. One difficulty in using serverless functions, however, is making them observable in the wider end-to-end microservices architecture context.
“Reliability is critical for us when it comes to monitoring our production applications. As such, we were eager to make the switch from the OpenTelemetry AWS Lambda Agent to the Elastic AWS Lambda APM Agent. We are very pleased that Elastic has released a fully supported and a properly tested product for delivering crucial end-to-end visibility into applications that employ serverless functions.”
- Tech Lead, Multi-brand online retailer in the UK and Ireland
Elastic APM for AWS Lambda: The architecture
In a previous blog post, we showed how to trace AWS Lambdas with OpenTelemetry and Elastic Observability.
The Elastic APM (application performance monitoring) solution for AWS Lambda functions provides performance monitoring, error monitoring, and topology views showing dependencies within the distributed microservices architecture. Additionally, the APM agent provides auto-instrumentation of traces, transactions, and spans out of the box.
The key components of the solution for monitoring AWS Lambda are the Elastic APM agent for the relevant language, the Elastic APM AWS Lambda extension, and the APM server. Each of these components is available as open-source code in GitHub repositories, and the solution can be trialed free of charge.
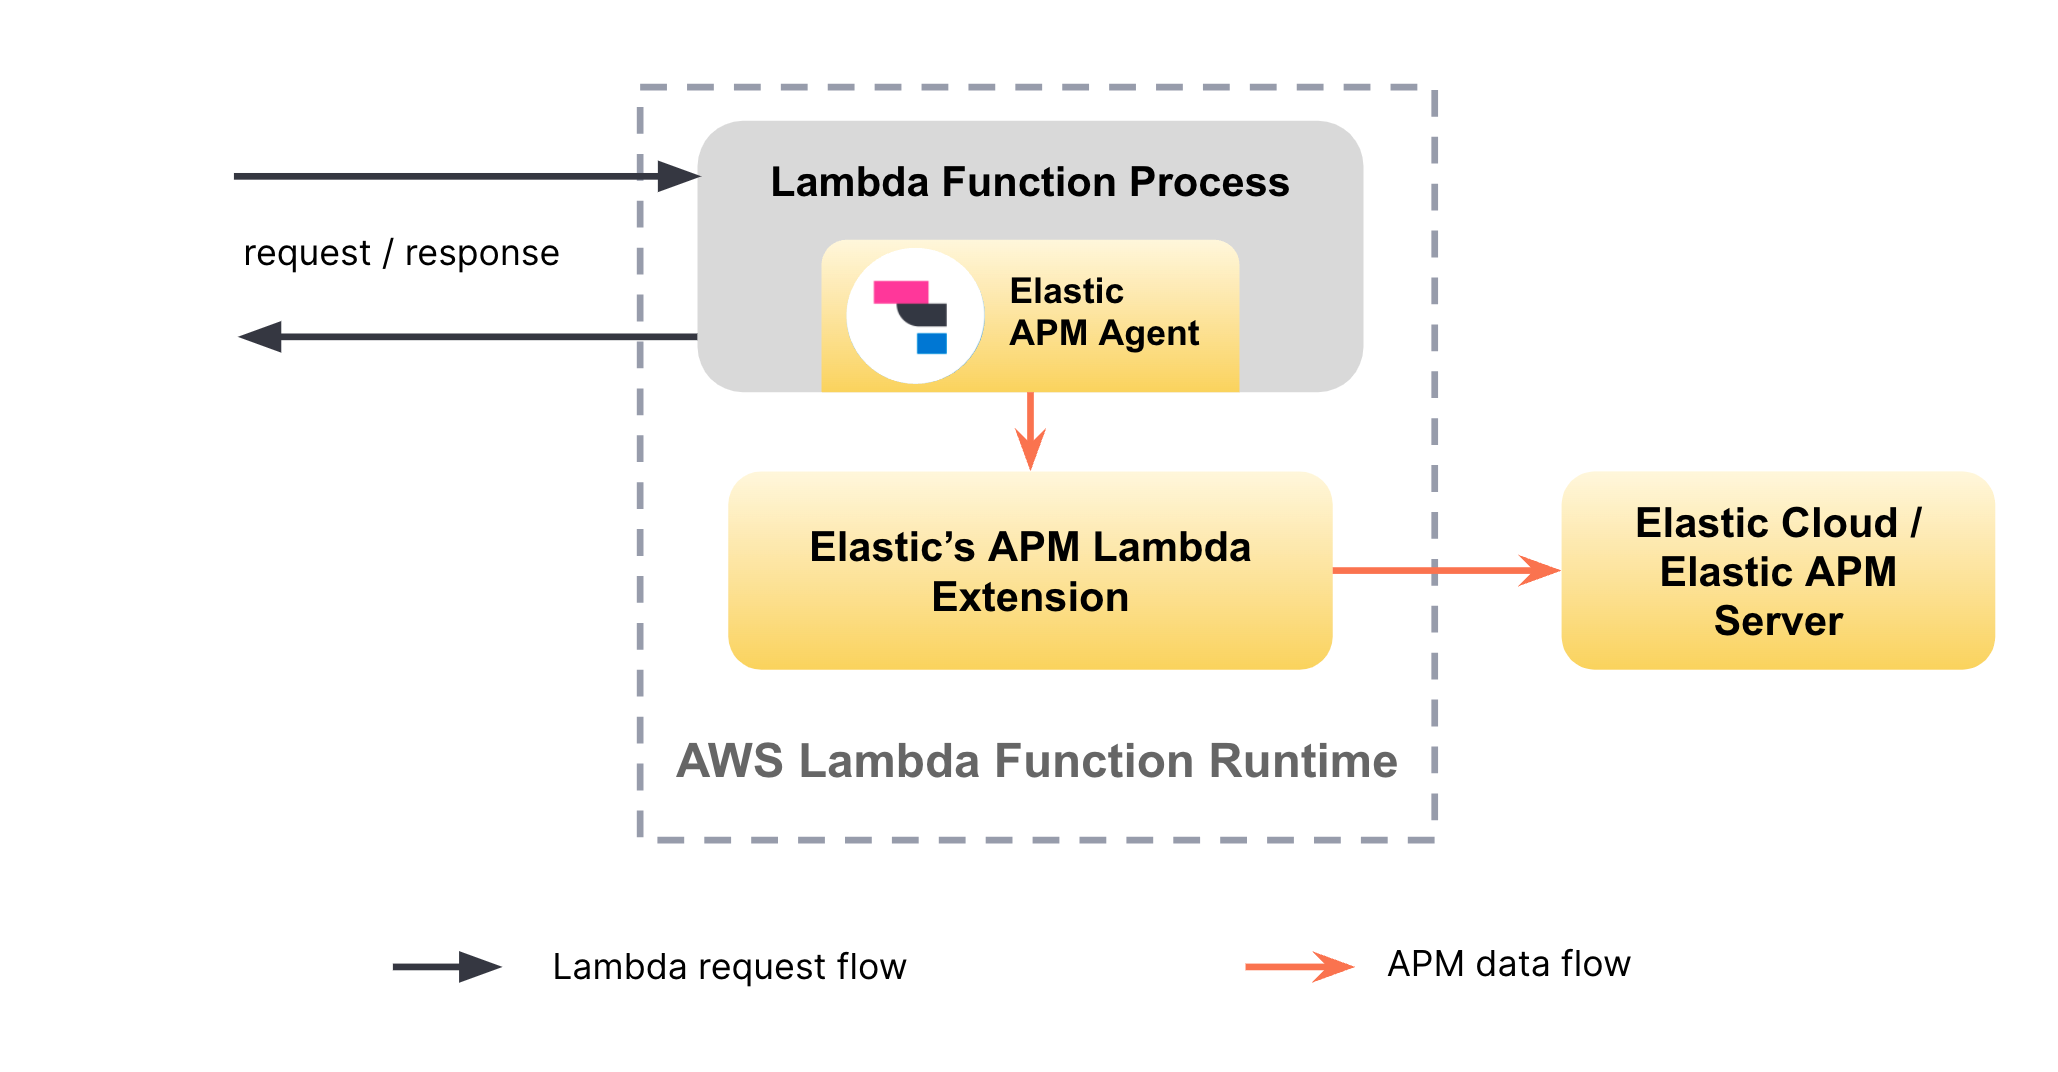
The APM server validates and processes incoming events from individual APM agents and transforms them into Elasticsearch documents. The APM agent provides auto-instrumentation capabilities for the application being observed. The APM AWS Lambda extension is responsible for the transmission of data to the APM server and for the collection of Lambda-specific logs and metrics. The APM AWS Lambda extension ensures that any potential latency between the Lambda function and the APM Server instance will not cause latency in the request flow of the Lambda function itself.
Currently, the solution supports auto-instrumentation of AWS Lambda functions written in Node.js, Java, and Python. In addition to traces, the APM agent identifies cold starts of AWS Lambda functions and collects trigger-specific information for each Lambda invocation, as well as metadata associated with the AWS Lambda runtime.
Setting up Elastic APM for AWS Lambdas
In general, there are two different ways of deploying and using AWS Lambda functions:
Deploying code as a .zip archive and using Lambda Layers for additional resources
Deploying all resources through Docker images
Though Elastic primarily supports and documents the use of Elastic APM with the first option at this time, you can also use our APM agents and APM AWS Lambda extension artifacts to build your custom Docker image for the second deployment option.
Setting up Elastic APM for your Node.js, Python, or Java-based AWS Lambda functions is easy and involves the following three steps:
Install the Elastic APM agent for the language you are using in your AWS Lambda function.
Add the Elastic APM AWS Lambda extension as a layer to your Lambda function.
Configure the APM agent and the APM AWS Lambda extension through the Lambda function’s environment variables.
The additional Elastic artifacts added to your Lambda function (APM agent and APM AWS Lambda extension) are in total less than 20MB, which is less than 10% of AWS’s 250MB limit when deploying Lambda functions through the first option mentioned above.
The Quick Start guides provide language-specific setup instructions for different deployment frameworks and approaches, such as AWS Web console, Terraform, AWS CLI, SAM, and the Serverless monitoring framework.
The Node.js sample application
To demonstrate the setup and usage of Elastic APM for an AWS Lambda-based Node.js application, we prepared a sample application. It uses the Serverless framework to manage the deployment of the AWS resources.
The sample application explained
The sample application includes two AWS Lambda functions, producer and consumer, that are made accessible through an AWS API Gateway. Whenever the producer is invoked, it calls the consumer Lambda function through the API Gateway. In addition, the sample project provides a simple, APM-instrumented load generator that periodically invokes the producer.
The project contains two sub-directories: one for the target serverless application (lambda-application), and one for the Node.js-based client that is used for generating load to the target application (load-generator).
The Lambda application includes the following relevant files:
- handler.js
- serverless.yml
The handler.js file contains the two Node.js functions (producer and consumer) that encapsulate the handler logic for two different AWS Lambda functions. In short, the producer function invokes the consumer function through an API Gateway using HTTP. The serverless.yml file defines the deployment of AWS resources through the Serverless framework.
…
provider:
 …
 layers:
   arn:aws:lambda:${aws:region}:267093732750:layer:elastic-apm-extension-ver-1-0-0-x86_64:1
   arn:aws:lambda:${aws:region}:267093732750:layer:elastic-apm-node-ver-3-31-0:1
 environment:
   NODE_OPTIONS: -r elastic-apm-node/start
   ELASTIC_APM_LAMBDA_APM_SERVER: ${file(../env.json):apm-server-url}
   ELASTIC_APM_SECRET_TOKEN: ${file(../env.json):apm-server-token}
…It defines the two AWS Lambda functions that point to the corresponding Node.js handler functions. Both AWS Lambda functions are made accessible through an API Gateway using the events section. The provider section in the serverless.yml file contains configurations that are applied to all the AWS Lambda functions defined in this document.
To enable Elastic APM for the AWS Lambda functions, the only two sections that are relevant are the layers and environment sections. With the former, we instruct the AWS Lambda functions to import the public, ready-to-use Lambda layers for the Elastic APM AWS Lambda extension and the Elastic Node.js APM agent. Note that the AWS region and the architecture (for example, x86_64 vs. arm64) of the layers must match the region and architecture of the target AWS Lambda functions. The AWS region is configured centrally in the top-level env.json file. In the environment section, the NODE_OPTIONS environment variable ensures that the APM Node.js agent is hooked into the Node.js process when the Lambda function is loaded. Finally, ELASTIC_APM_LAMBDA_APM_SERVER points to the APM server endpoint secured by the ELASTIC_APM_SECRET_TOKEN.
That’s all you need to set up Elastic APM for AWS Lambda.
If you look into the handler.js and package.json files, you won’t find any references or mentions of the Elastic APM Node.js agent. That’s because the instrumentation of the AWS Lambda functions happens completely transparently without any need to change the source code of the target application.
Running the sample application
To try the sample application yourself, you will need to install npm, Node.js, and the Serverless framework.
Step 1: Clone the sample application repo and install dependencies
git clone https://github.com/elastic/aws-lambda-apm-sample-app.git

cd aws-lambda-apm-sample-app/lambda-application
npm install --save-dev

cd ../load-generator
npm install --save-devStep 2: Configure Elastic APM
To try out Elastic APM with AWS Lambda, you will need an Elastic Stack, including an APM server that will receive the APM data. The simplest way to get started with Elastic APM is through Elastic Cloud. To get started, sign up for a trial of Elastic Cloud.
You need to provide the corresponding connection details to the APM server in the env.json file. In addition, you can provide the AWS region to deploy the sample application to.
   "aws-region": "eu-central-1",
   "apm-server-url": "https://THIS_IS_YOUR_APM_SERVER_URL",
"apm-server-token": "THIS_IS_YOUR_APM_SECRET_TOKEN"Step 3: Deploy the sample application
To deploy to AWS, you will need an AWS access key with the following permissions:
- AmazonS3FullAccess
- CloudWatchLogsFullAccess
- AmazonAPIGatewayAdministrator
- AWSCloudFormationFullAccess
- AWSLambda_FullAccess
Follow the instructions for setting up AWS credentials in AWS and using them with your system.
Once your AWS credentials are set up, execute the following command in the lambda-application directory to deploy the sample application:
serverless deployCopy the base URL of the API Gateway from the output in the console (r7ckl4adme.execute-api.eu-central-1.amazonaws.com in the following example):
…
endpoints:
  GET - https://r7ckl4adme.execute-api.eu-central-1.amazonaws.com/dev/ping
  POST - https://r7ckl4adme.execute-api.eu-central-1.amazonaws.com/dev/produce
…Step 4: Generate load
Change to the load-generator directory and execute the following command with the previously copied base URL of the API Gateway to start load generation.
sh ./load.sh <PASTE_THE_API_GATEWAY_BASE_URL_HERE> Analyzing APM data in the context of AWS Lambda
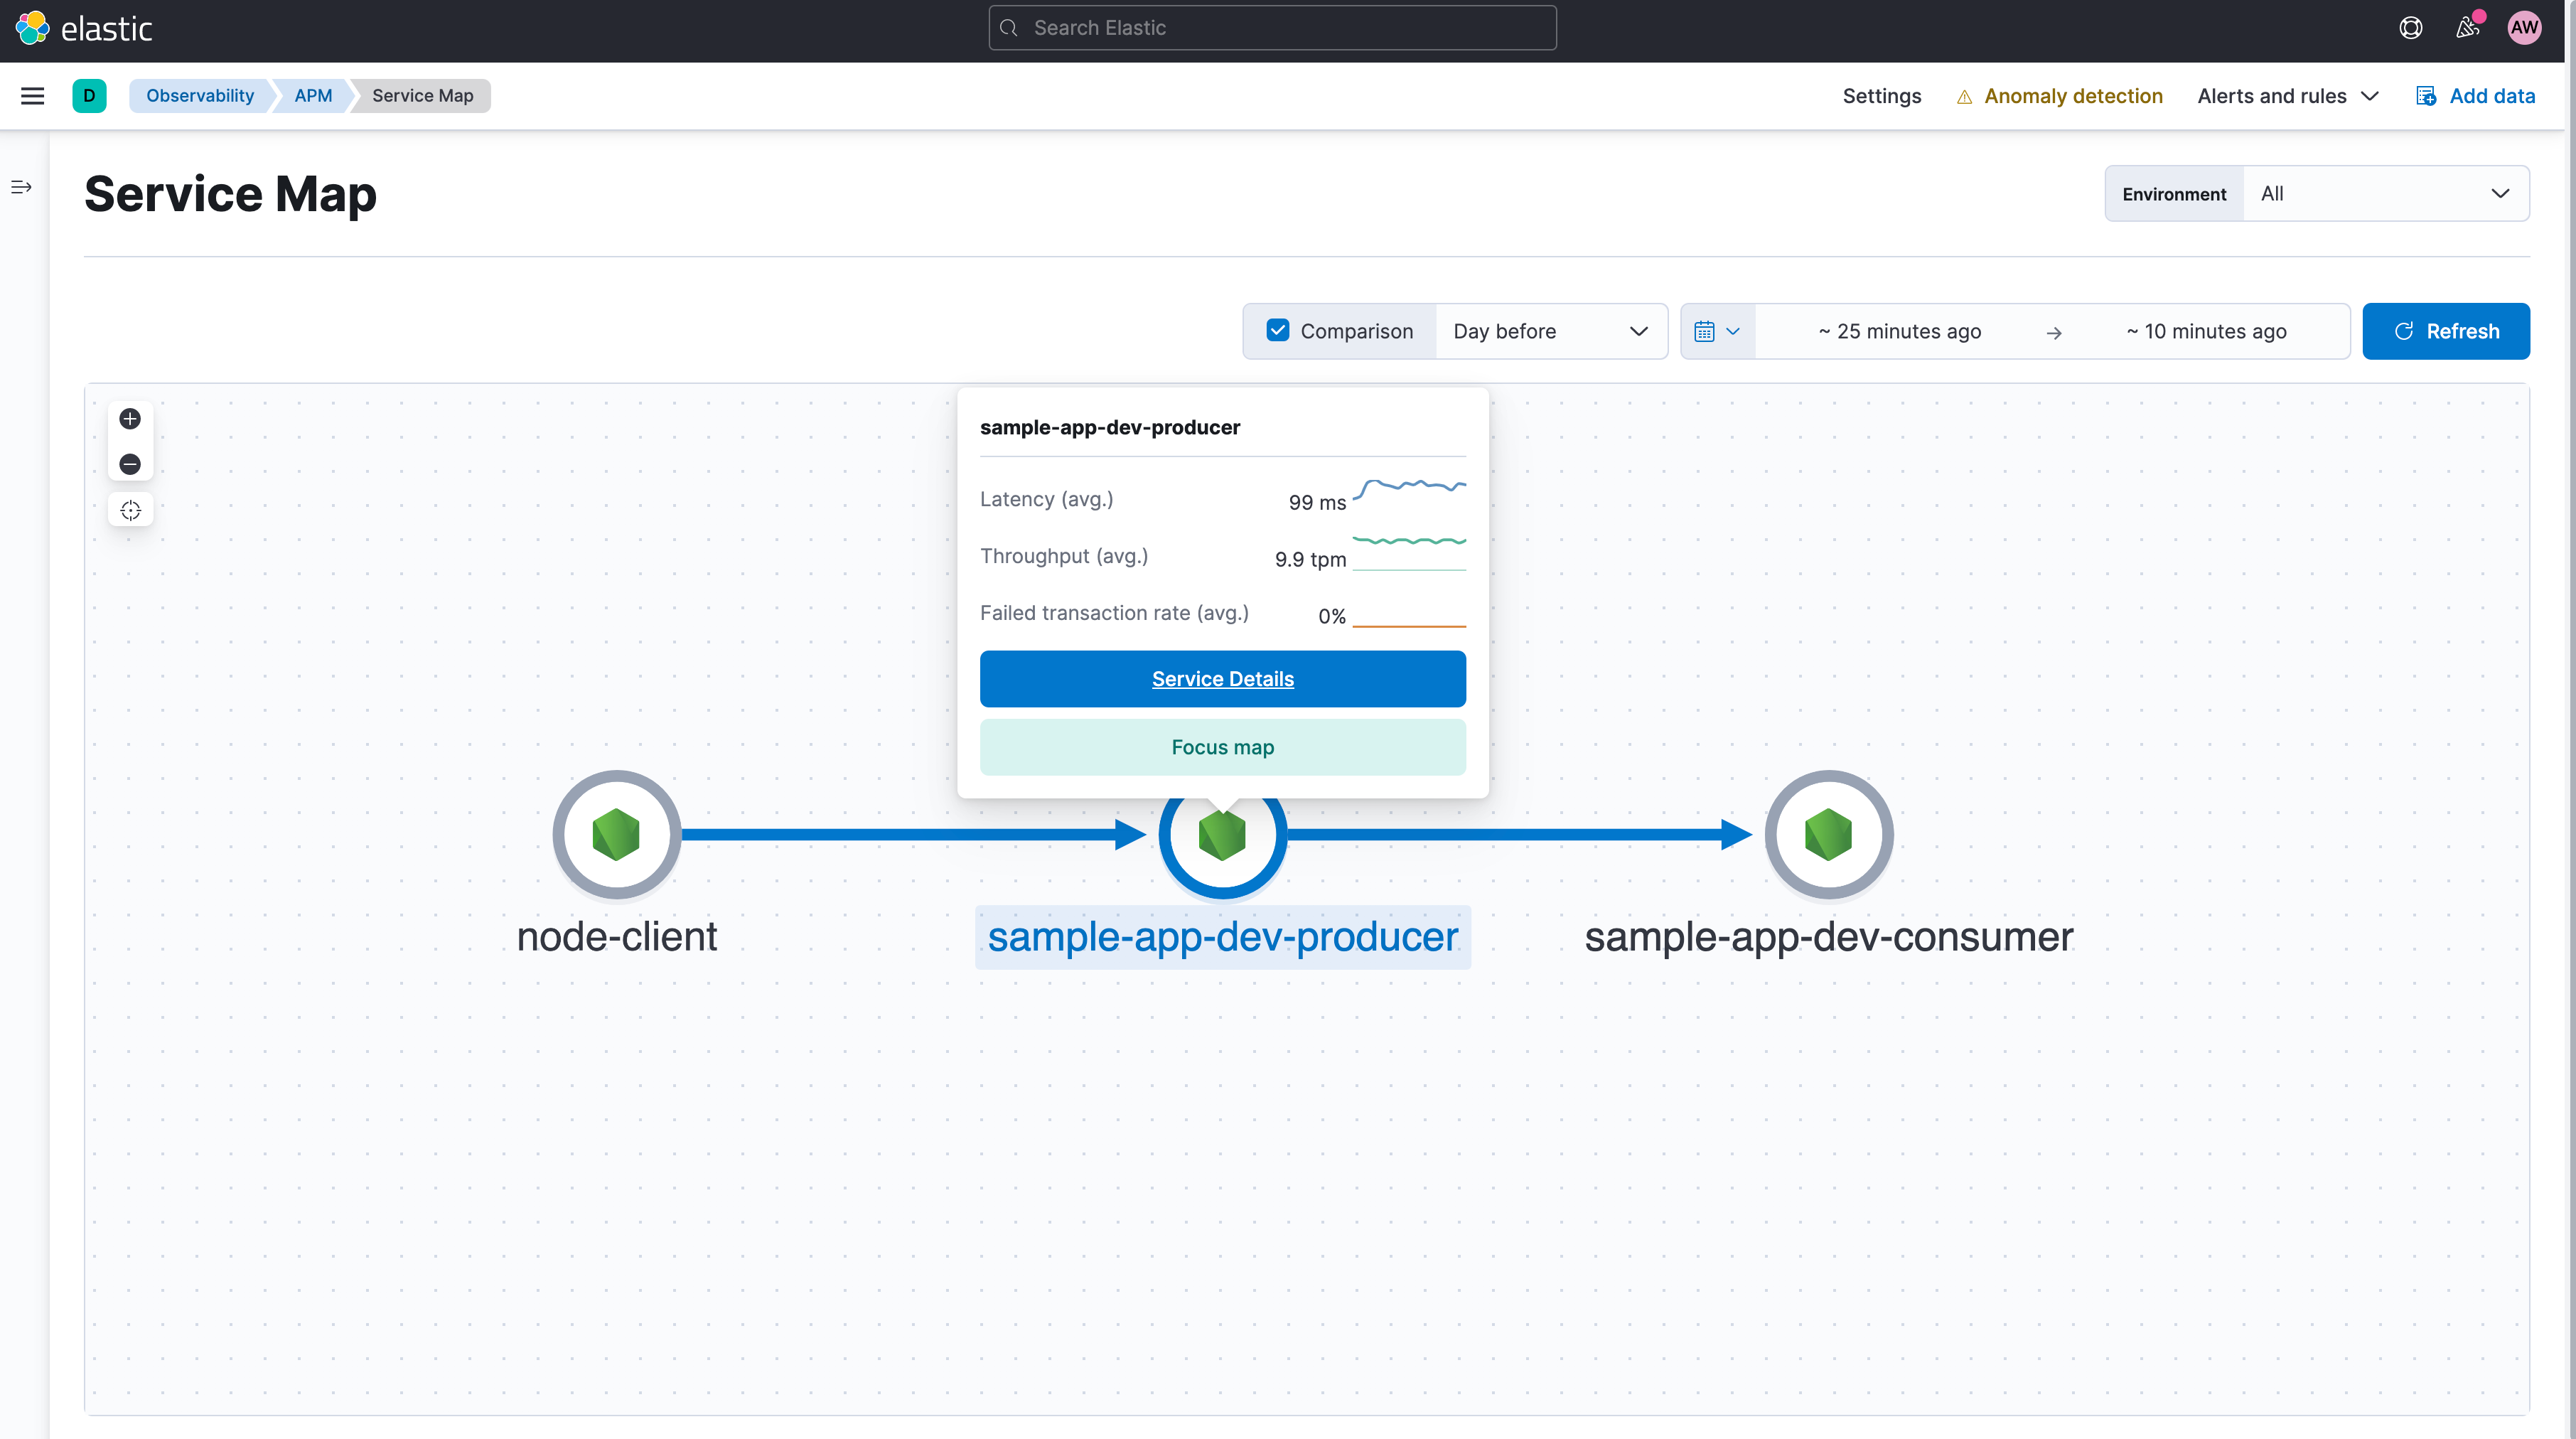
Once you have successfully set up the sample application and started generating load, you should see APM data appearing in the APM app in Kibana. With the default setup, you will see three services in the APM interface. The service called node-client represents the load generator. The other two services are for the producer and consumer AWS Lambda services. You can view the dependencies between these services in the Service Map view.
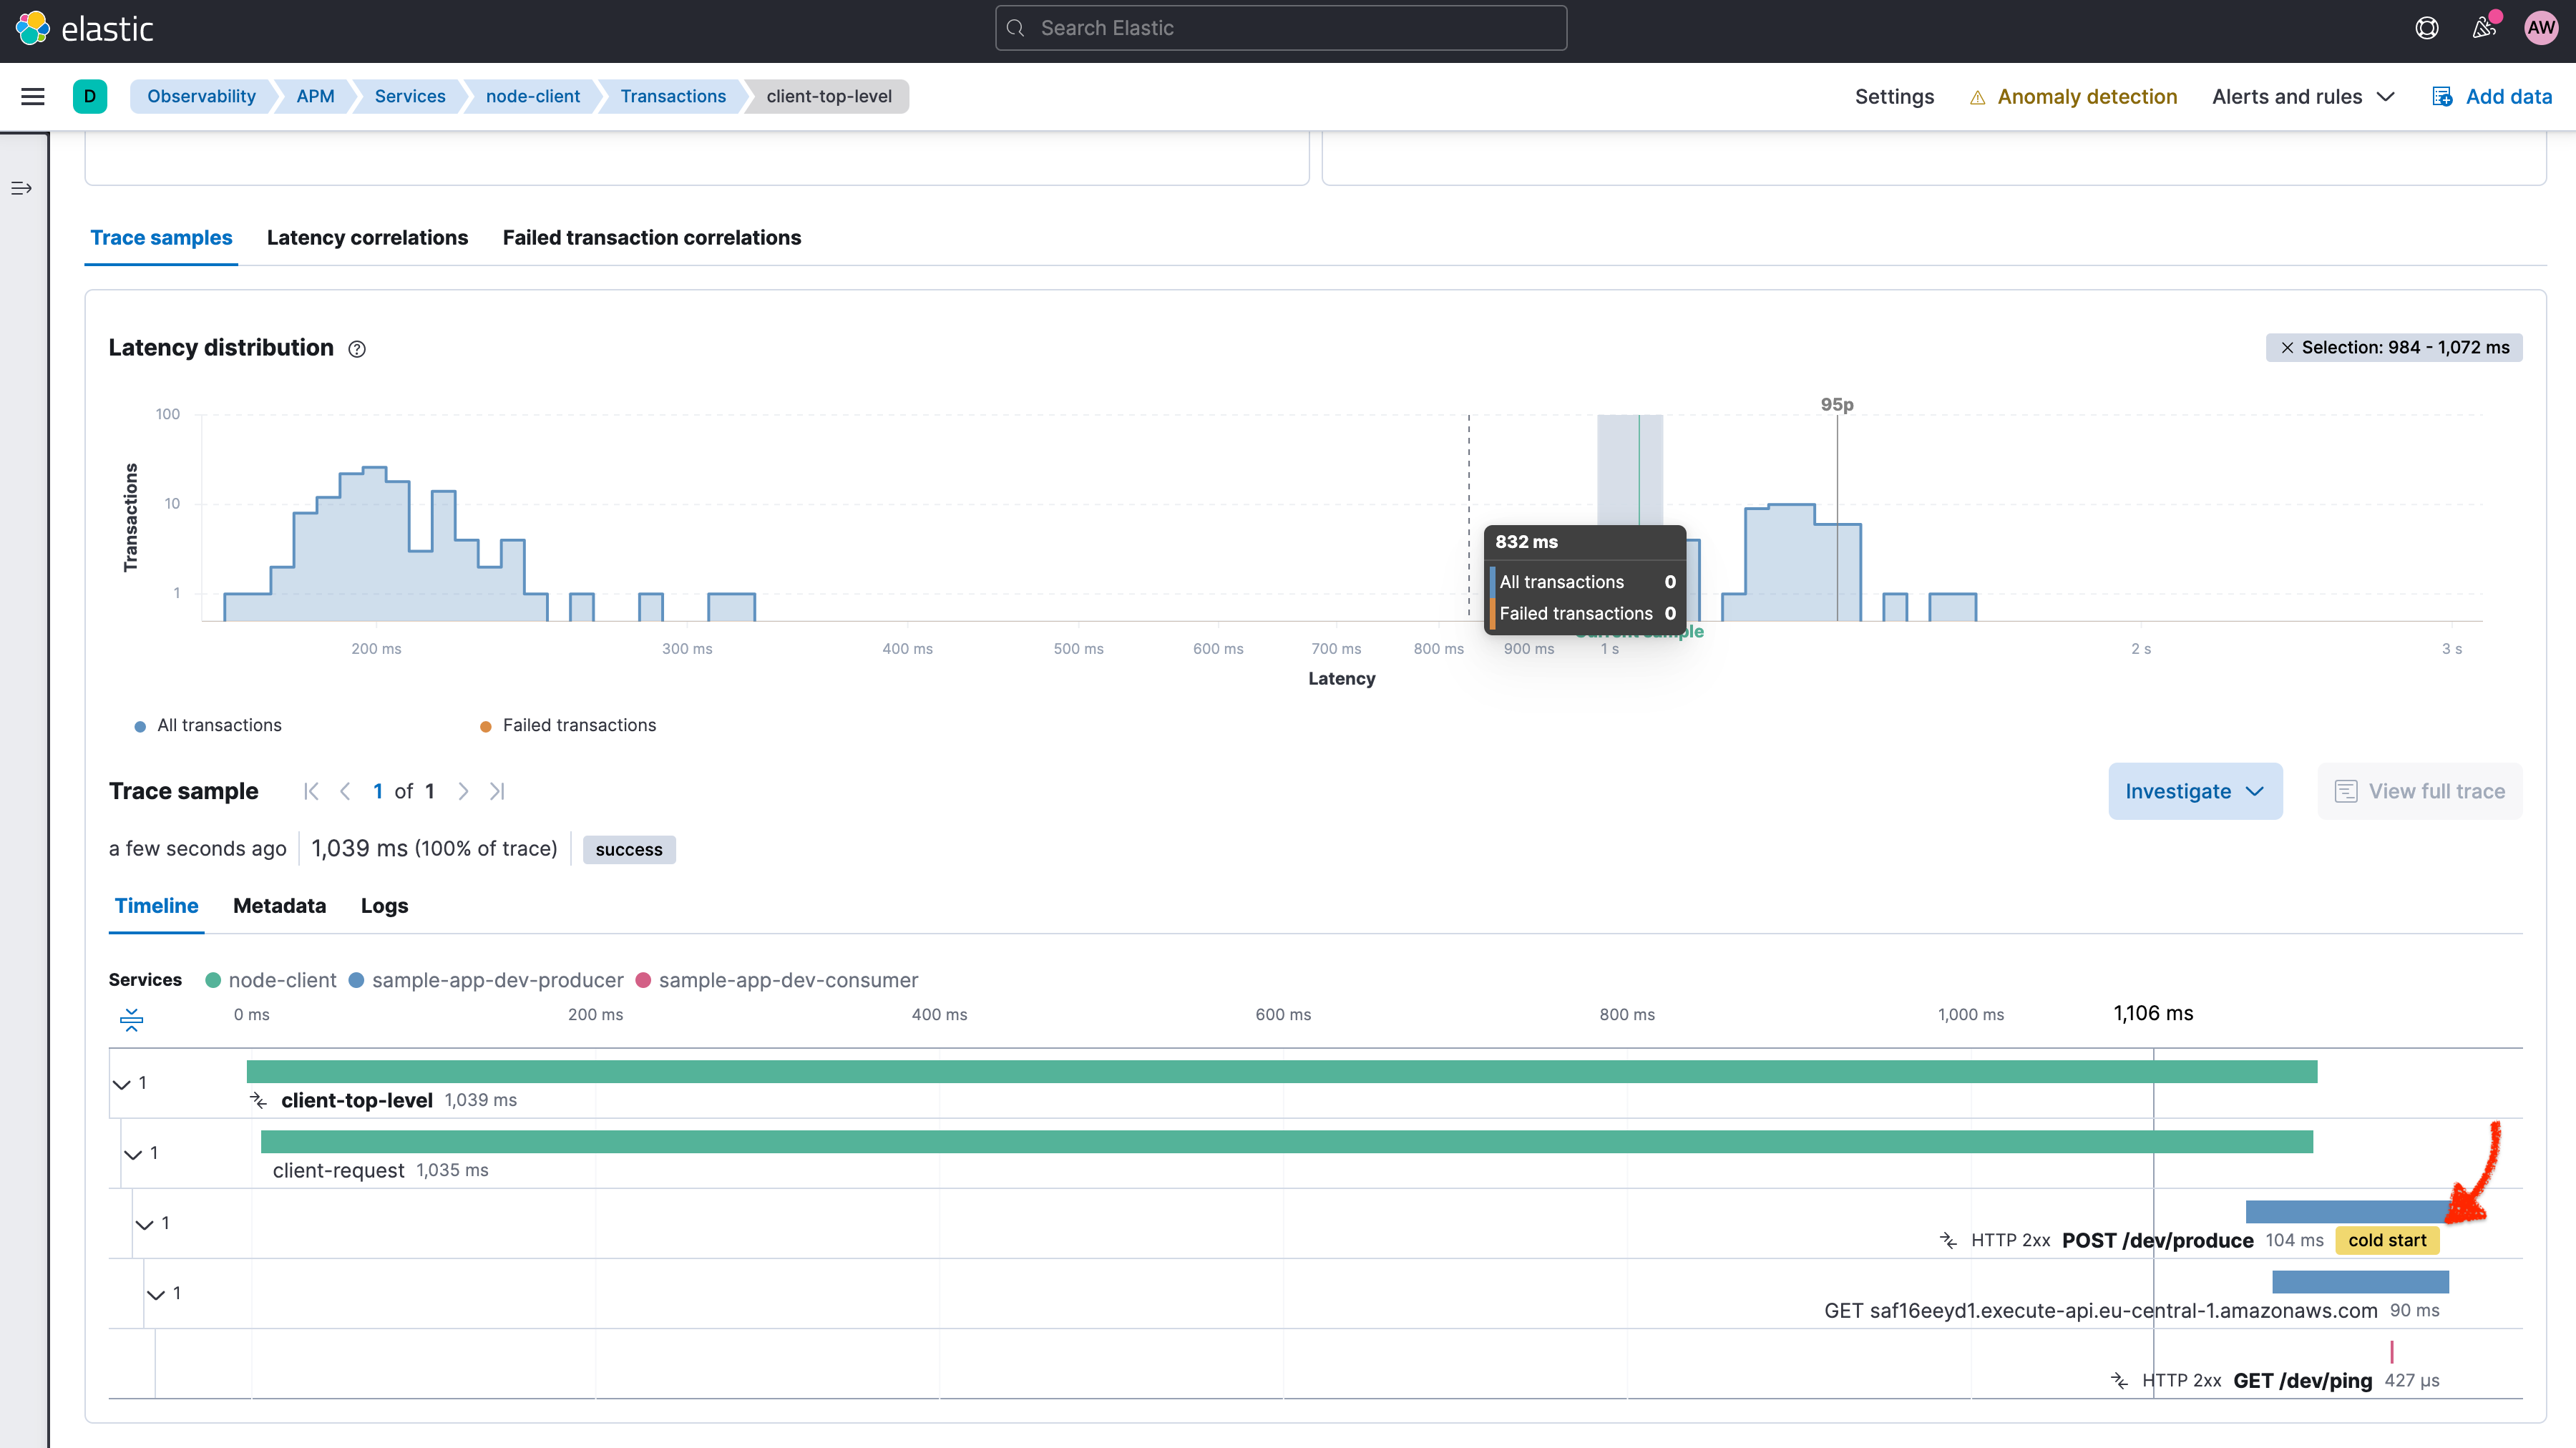
Individual requests from the client and the distributed processing of the request are represented in the trace view for the corresponding transactions. As you can see in the following screenshot, cold starts of Lambda invocations are directly denoted in the trace waterfall view.
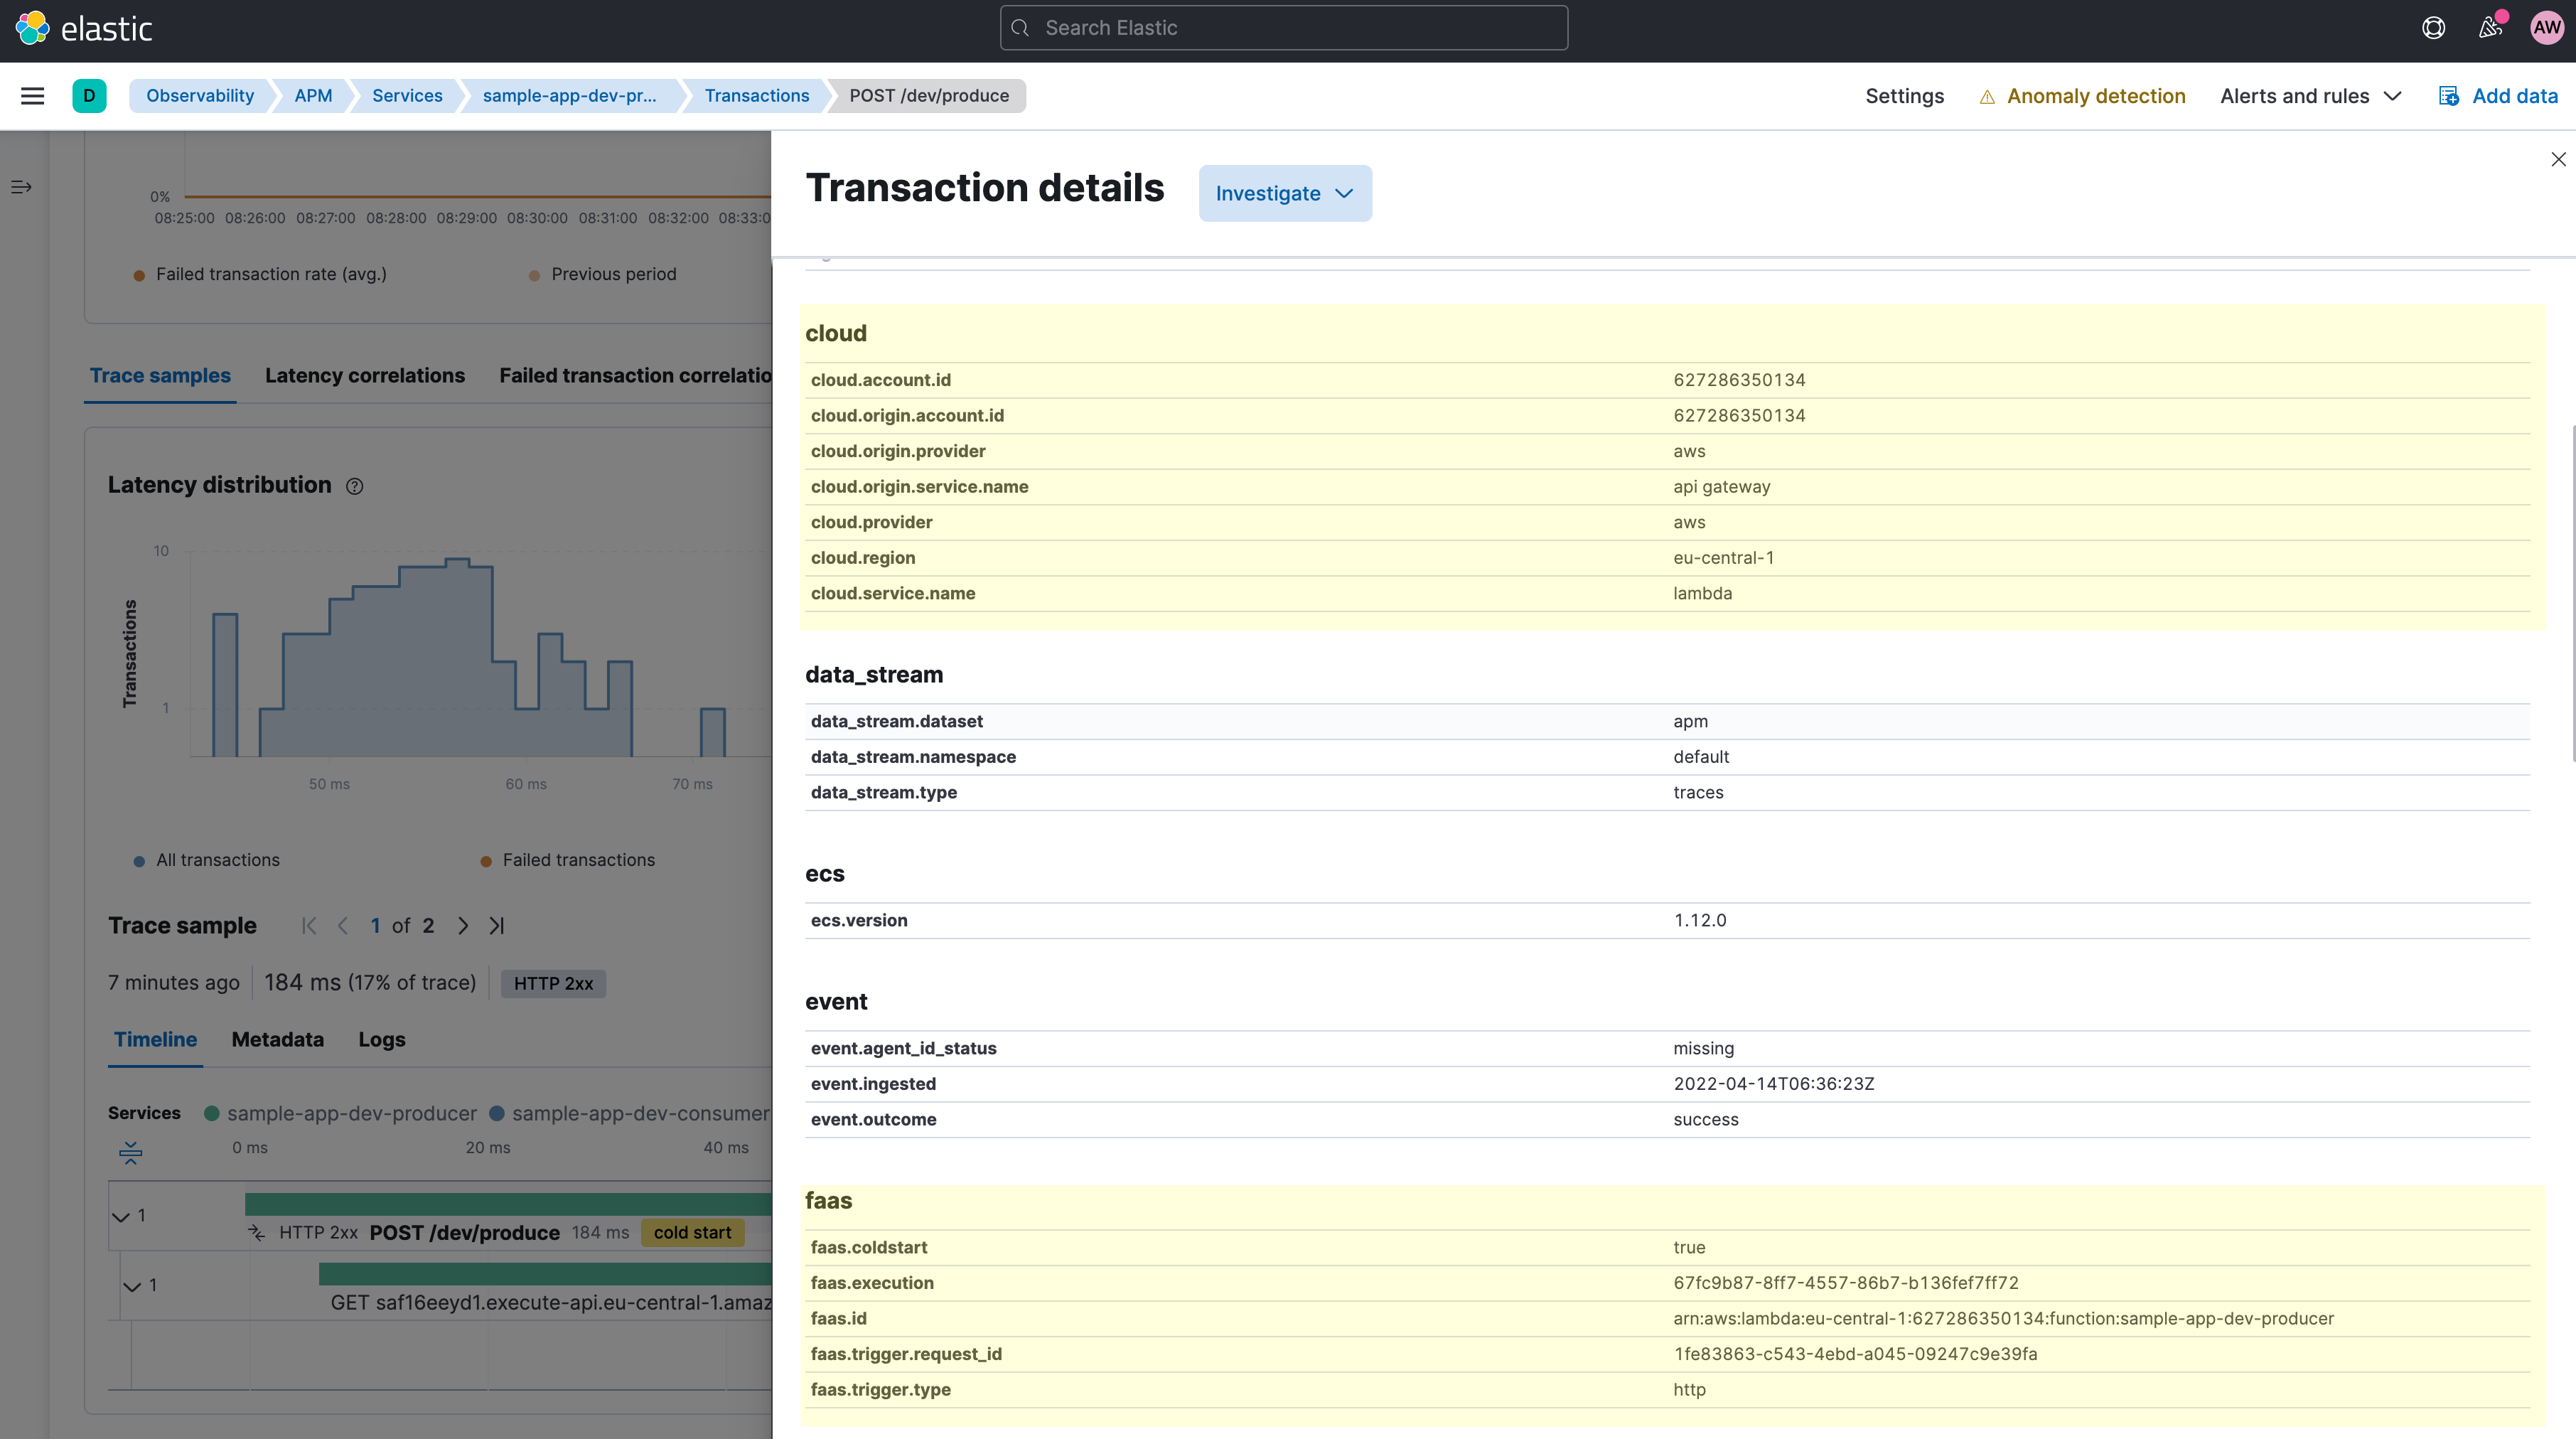
The APM agents collect AWS Lambda-specific metadata and request data to enrich corresponding transaction documents. You can see these fields in the transaction details pop-up screen when clicking on a transaction in the trace waterfall view. The new faas.* field group provides additional insights on the Lambda request, such as the faas.coldstart field, the AWS request ID, as well as some information on the trigger type and the ID of the trigger request. In this example, it’s the ID of the API Gateway request.
If you navigate to a service that represents an AWS Lambda function, you can use these fields to filter the APM data for custom analysis. For AWS Lambda services, Elastic APM shows a cold start rate chart that shows the rate of cold starts (portion of requests that hit a cold start).Moreover, as illustrated in the following screenshot, you can use the Correlation feature to see the impact of Lambda cold starts on the latency, for example.
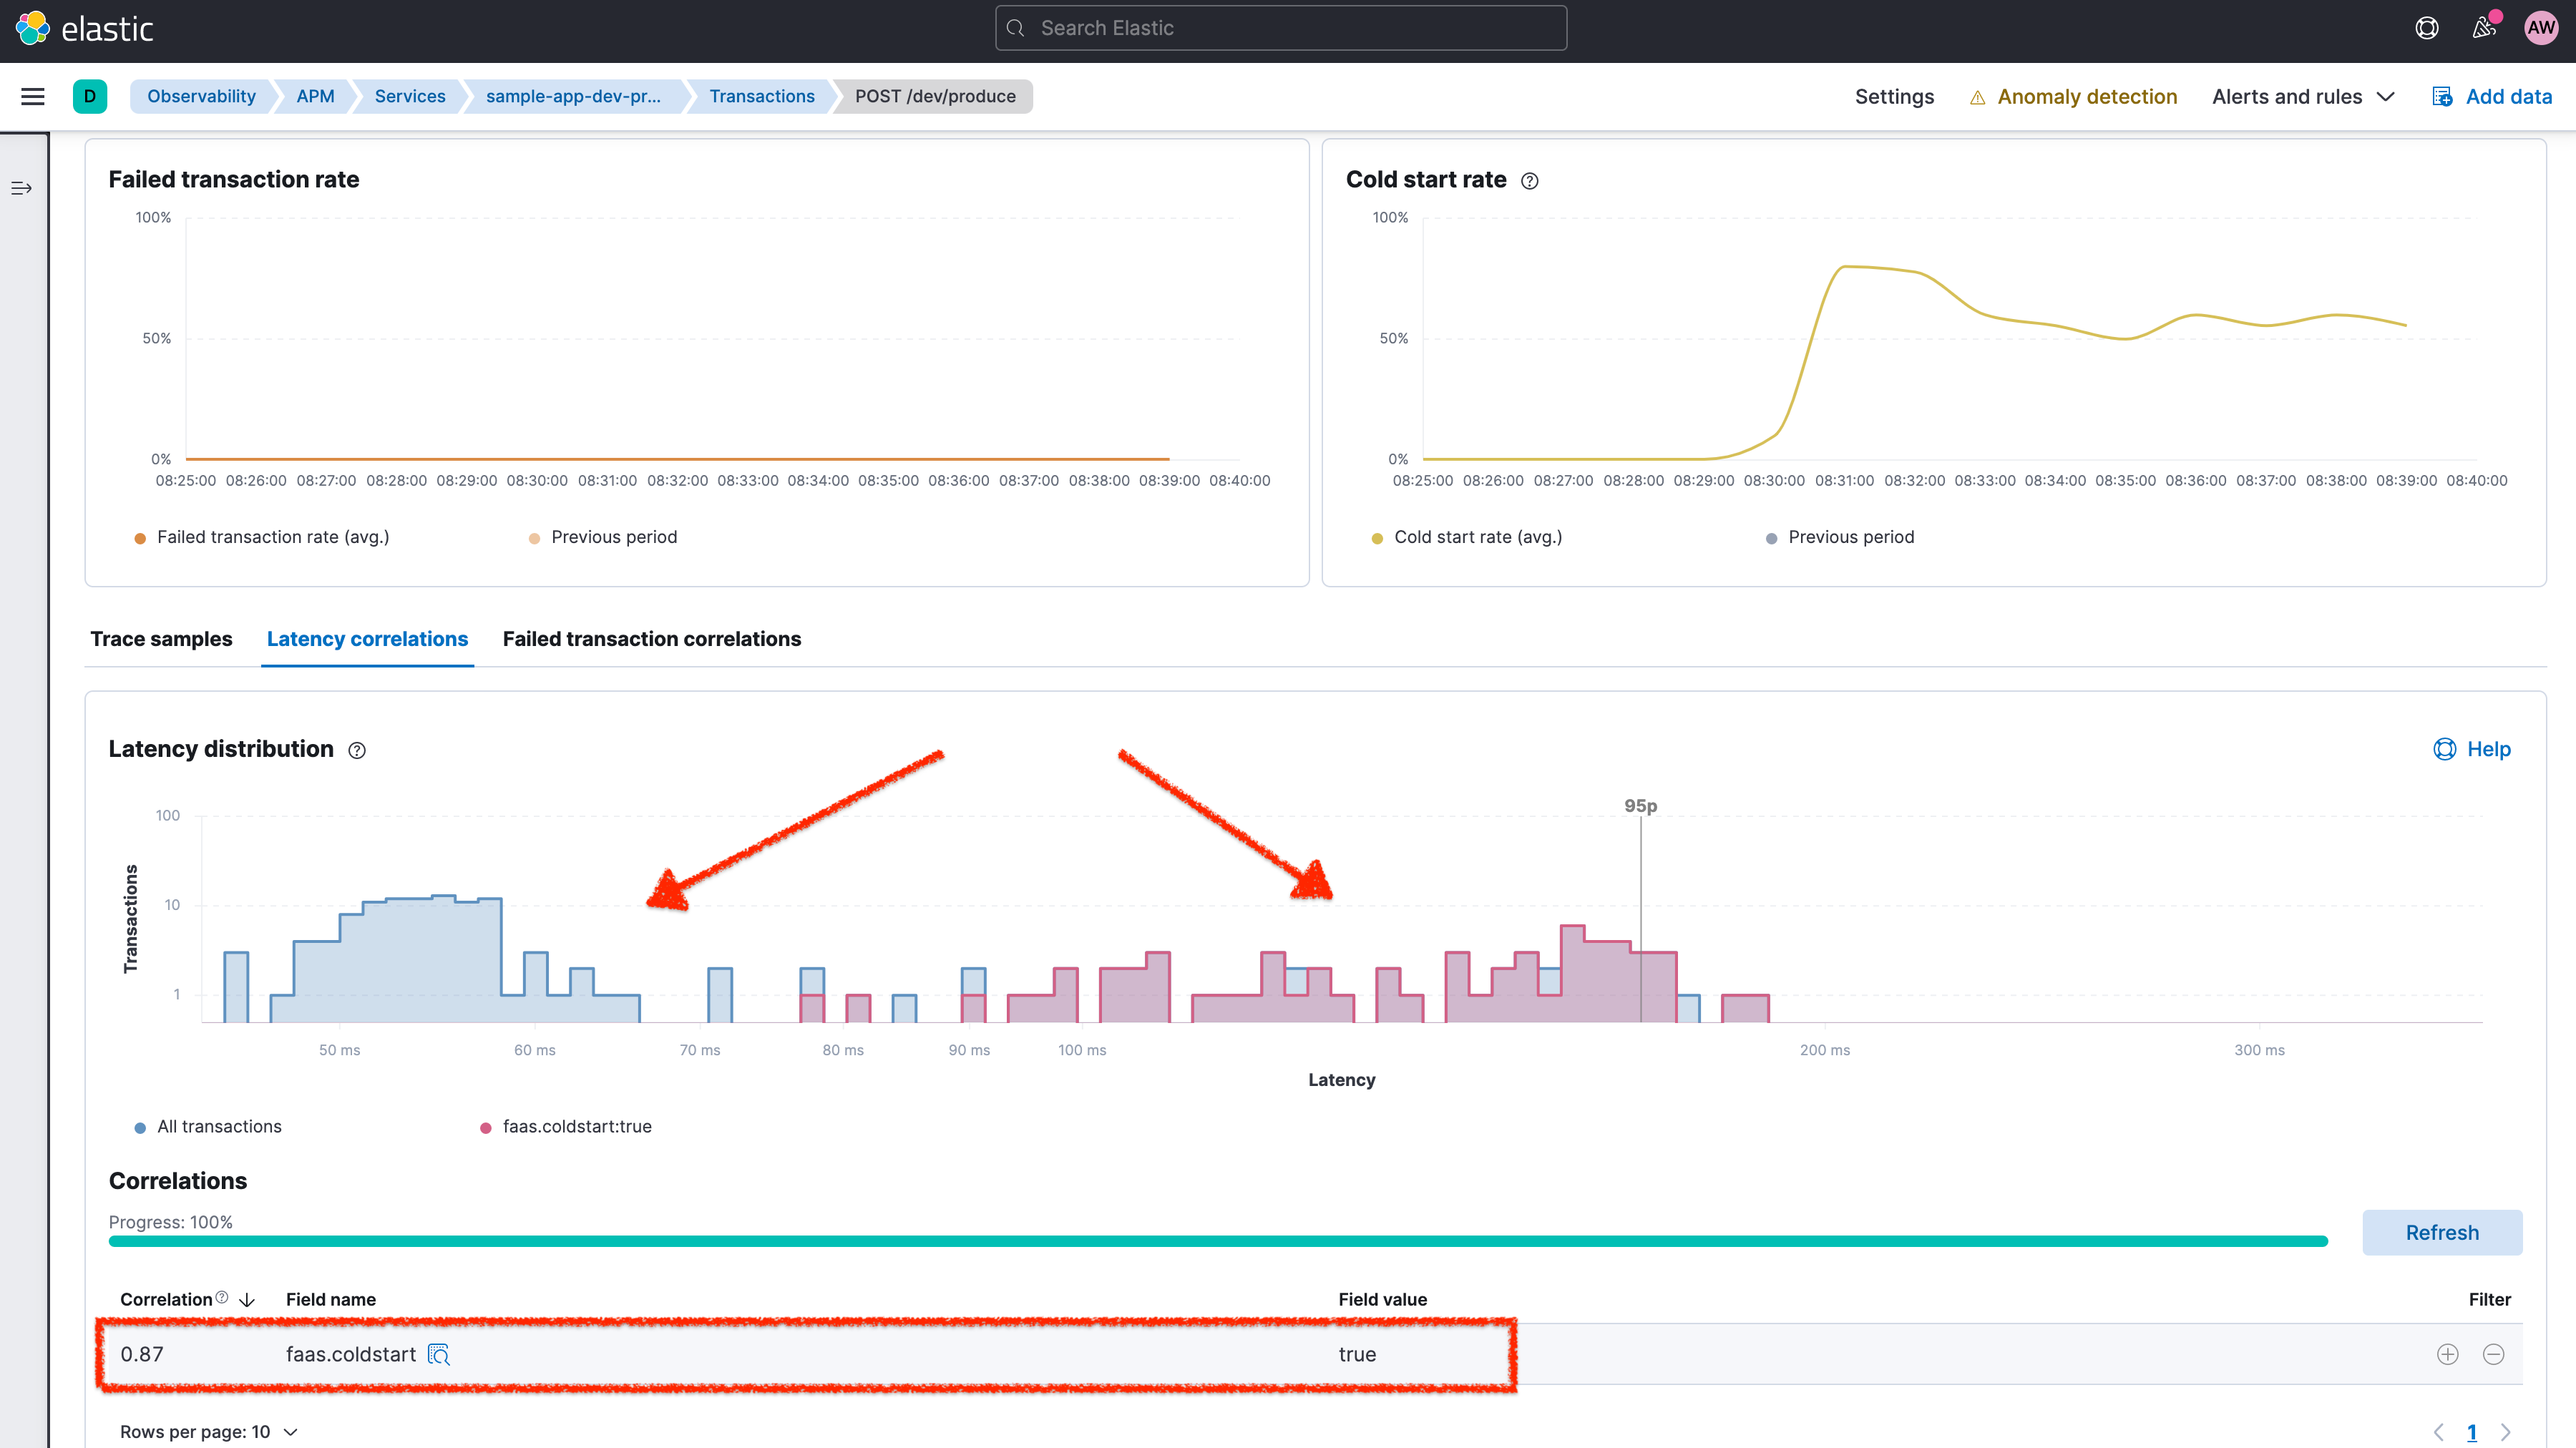
With the default configuration of the APM agents, you will get one APM service in Elastic Observability corresponding to exactly one AWS Lambda function (using the function name as the service name). However, sometimes it is desirable to logically group multiple lambda functions under one APM service. You can achieve this by setting the ELASTIC_APM_SERVICE_NAME environment variable on the corresponding Lambda functions using the same value. The following screenshot shows the effect in the sample application of setting the static service name (here: composite-service) for both the producer and consumer Lambda functions.
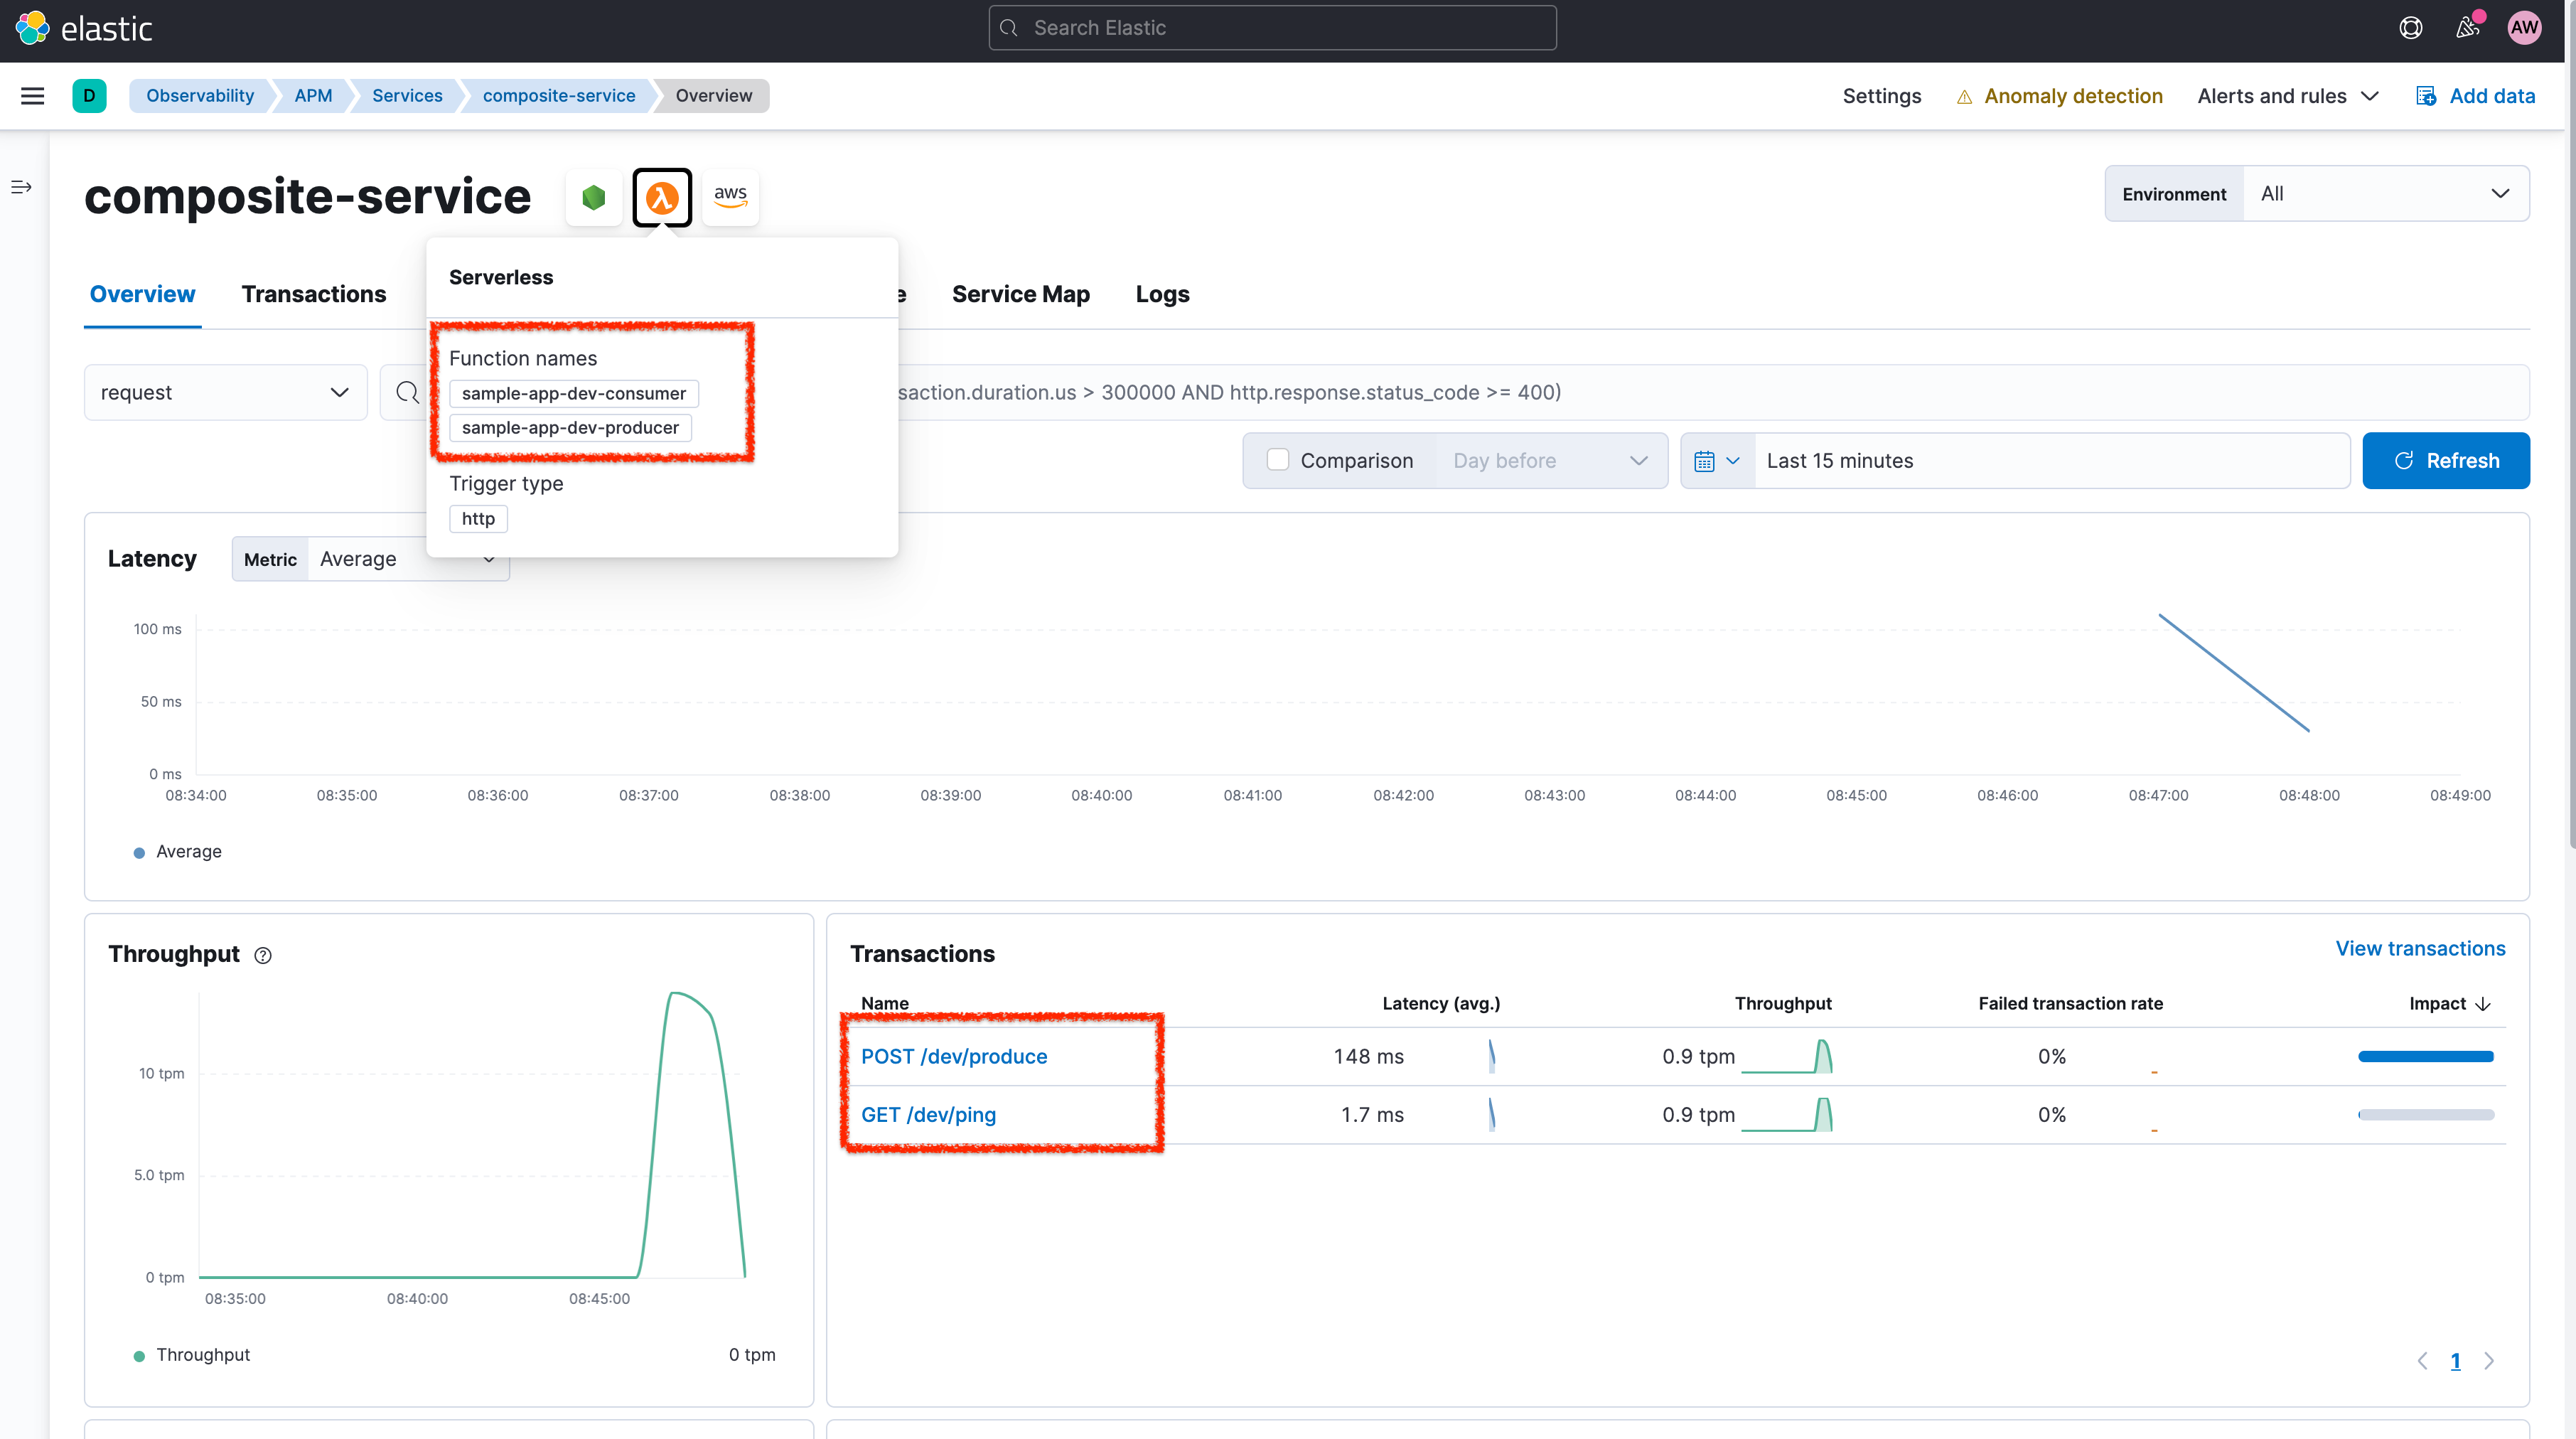
Both Lambda functions now appear under one APM service, and the pop-up on the Lambda icon lists the included AWS Lambda function names. The two different Lambda functions now appear as two different transaction groups (POST /dev/produce and GET /dev/ping). Each chart on the composite-service service page shows aggregated data for the two Lambda functions.
Collecting AWS Lambda metrics and logs
What about the other observability signals, metrics and logs? AWS Lambda writes logs into CloudWatch. You can use Elastic’s Functionbeat to pipe data streams from AWS CloudWatch logs to the Elastic Stack. If you configure the APM agents to use ECS logging, you will get direct correlation between traces and related logs in Elastic APM.
You can also use the AWS Lambda Metrics integration in Elastic to gather and analyze AWS Lambda-specific metrics.
We are continuing to work on improving the onboarding experience, lowering total cost of ownership, and simplifying the use of Elastic Observability. To this end, we plan to integrate logs and metrics collection seamlessly into the Elastic APM AWS Lambda extension in the future. This will allow AWS Lambda users to consume the full range of observability data with the minimal setup described above, while also avoiding the time and cost associated with the CloudWatch API.
Doing more with Elastic Observability
The Elastic Observability solution provides real-time monitoring of AWS Lambda functions in your production environment for a broad range of use cases. Curated dashboards assist DevOps teams in performing root cause analysis for performance bottlenecks and errors. SRE teams can quickly view upstream and downstream dependencies, as well as perform analyses in the context of distributed microservices architecture.
Resource:
This blog post was originally published on May 12, 2022. It was updated on July 8, 2022.

