- Kibana Guide: other versions:
- What is Kibana?
- What’s new in 8.4
- Kibana concepts
- Quick start
- Set up
- Install Kibana
- Configure Kibana
- Alerting and action settings
- APM settings
- Banners settings
- Enterprise Search settings
- Fleet settings
- i18n settings
- Logging settings
- Logs settings
- Metrics settings
- Monitoring settings
- Reporting settings
- Search sessions settings
- Secure settings
- Security settings
- Spaces settings
- Task Manager settings
- Telemetry settings
- URL drilldown settings
- Start and stop Kibana
- Access Kibana
- Securing access to Kibana
- Add data
- Upgrade Kibana
- Configure security
- Configure reporting
- Configure logging
- Configure monitoring
- Command line tools
- Production considerations
- Discover
- Dashboard and visualizations
- Canvas
- Maps
- Build a map to compare metrics by country or region
- Track, visualize, and alert on assets in real time
- Map custom regions with reverse geocoding
- Heat map layer
- Tile layer
- Vector layer
- Plot big data
- Search geographic data
- Configure map settings
- Connect to Elastic Maps Service
- Import geospatial data
- Troubleshoot
- Reporting and sharing
- Machine learning
- Graph
- Alerting
- Observability
- APM
- Security
- Dev Tools
- Fleet
- Osquery
- Stack Monitoring
- Stack Management
- REST API
- Get features API
- Kibana spaces APIs
- Kibana role management APIs
- User session management APIs
- Saved objects APIs
- Data views API
- Index patterns APIs
- Alerting APIs
- Action and connector APIs
- Cases APIs
- Import and export dashboard APIs
- Logstash configuration management APIs
- Machine learning APIs
- Osquery manager API
- Short URLs APIs
- Get Task Manager health
- Upgrade assistant APIs
- Kibana plugins
- Troubleshooting
- Accessibility
- Release notes
- Developer guide
Tutorial: Create a workpad for monitoring sales
editTutorial: Create a workpad for monitoring sales
editTo familiarize yourself with Canvas, add the Sample eCommerce orders data, then use the data to create a workpad for monitoring sales at an eCommerce store.
Open and set up Canvas
editTo create a workpad of the eCommerce store data, add the data set, then create the workpad.
- On the home page, click Try sample data.
- Click Other sample data sets.
- On the Sample eCommerce orders card, click Add data.
- Open the main menu, then click Canvas.
- On the Canvas workpads page, click Create workpad.
Customize your workpad with images
editTo customize your workpad to look the way you want, add your own images.
-
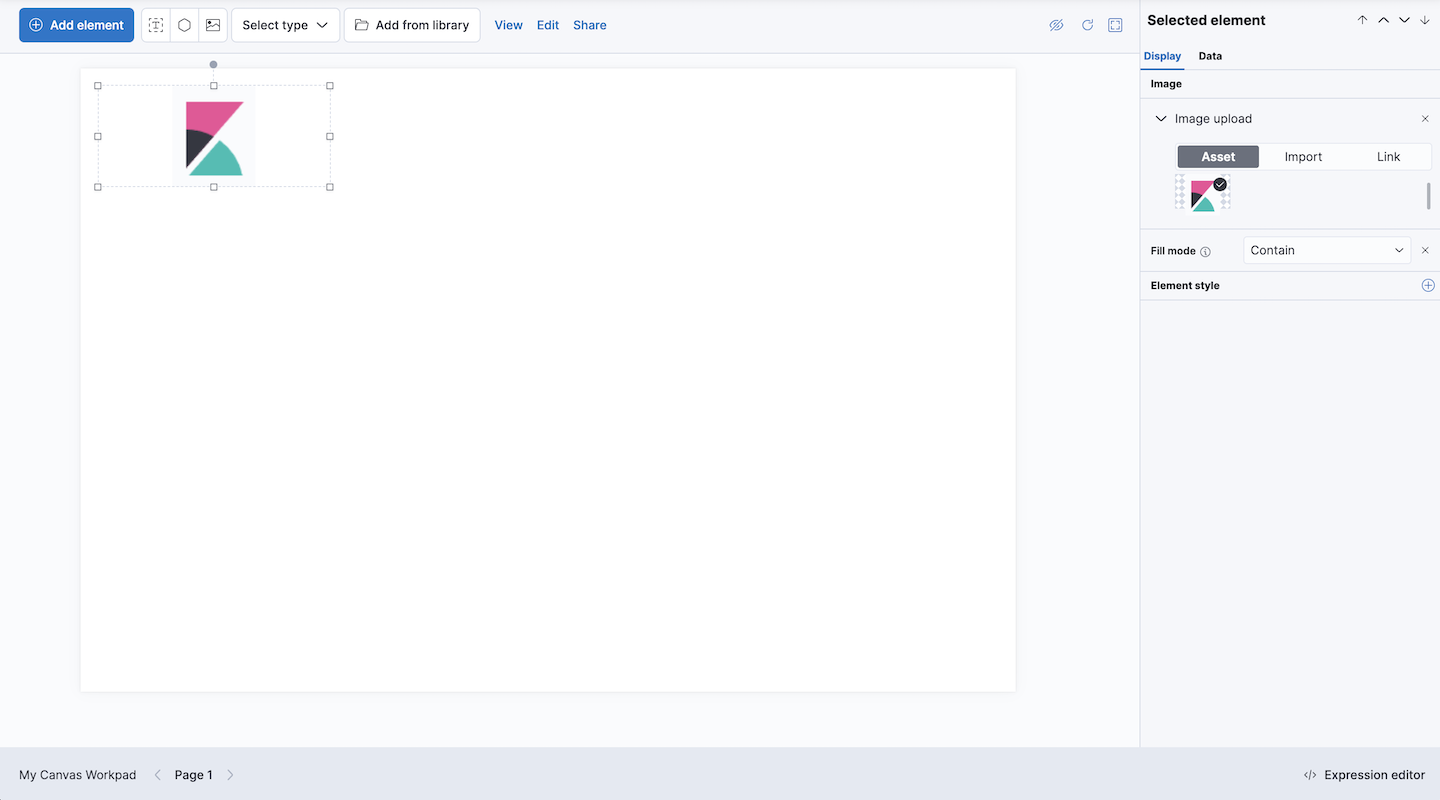
Click Add element > Image > Image.
The default Elastic logo image appears on the page.
-
Add your own image.
- Click the Elastic logo.
-
Drag the image file to the Select or drag and drop an image field.

Customize your data with metrics
editCustomize your data by connecting it to the Sample eCommerce orders data.
-
Click Add element > Chart > Metric.
By default, the element is connected to the demo data, which enables you to experiment with the element before you connect it to your own data source.
-
To connect the element to your own data source, make sure that the element is selected, click Data > Demo data > Elasticsearch SQL.
-
In the Query field, enter:
SELECT sum(taxless_total_price) AS sum_total_price FROM "kibana_sample_data_ecommerce"
-
Click Save.
The query selects the total price field and sets it to the sum_total_price field. All fields are pulled from the kibana_sample_data_ecommerce index.
-
-
At this point, the element appears as an error, so you need to change the element display options.
- Click Display
- From the Value dropdowns, make sure Unique is selected, then select sum_total_price.
-
Change the Label to
Total sales.
-
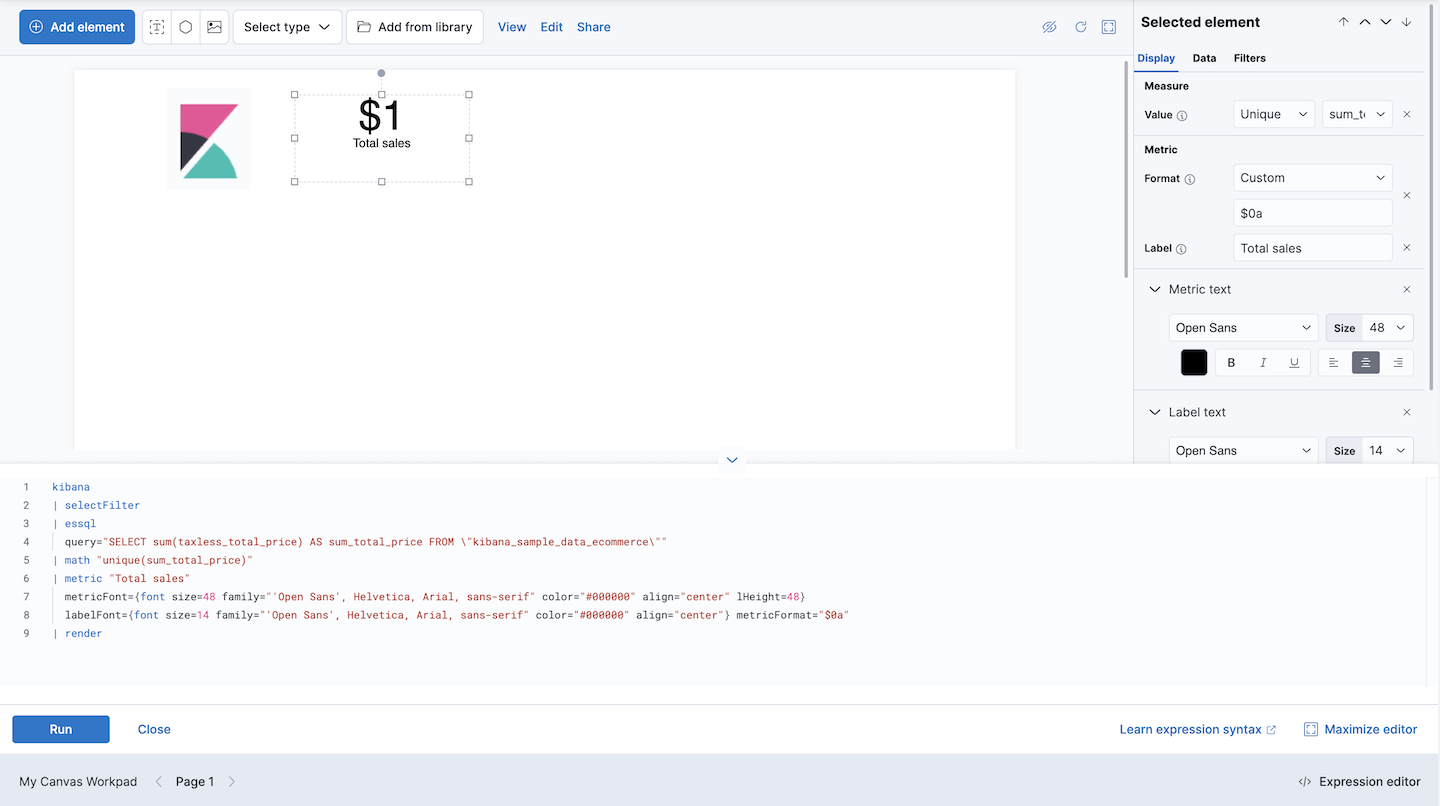
The error is gone, but the element could use some formatting. To format the number, use the Canvas expression language.
-
Click Expression editor.
You’re now looking at the raw data syntax that Canvas uses to display the element.
-
Change
metricFormat="0,0.[000]"tometricFormat="$0a". - Click Run.
-

Show off your data with charts
editTo show what your data can do, add charts, graphs, progress monitors, and more to your workpad.
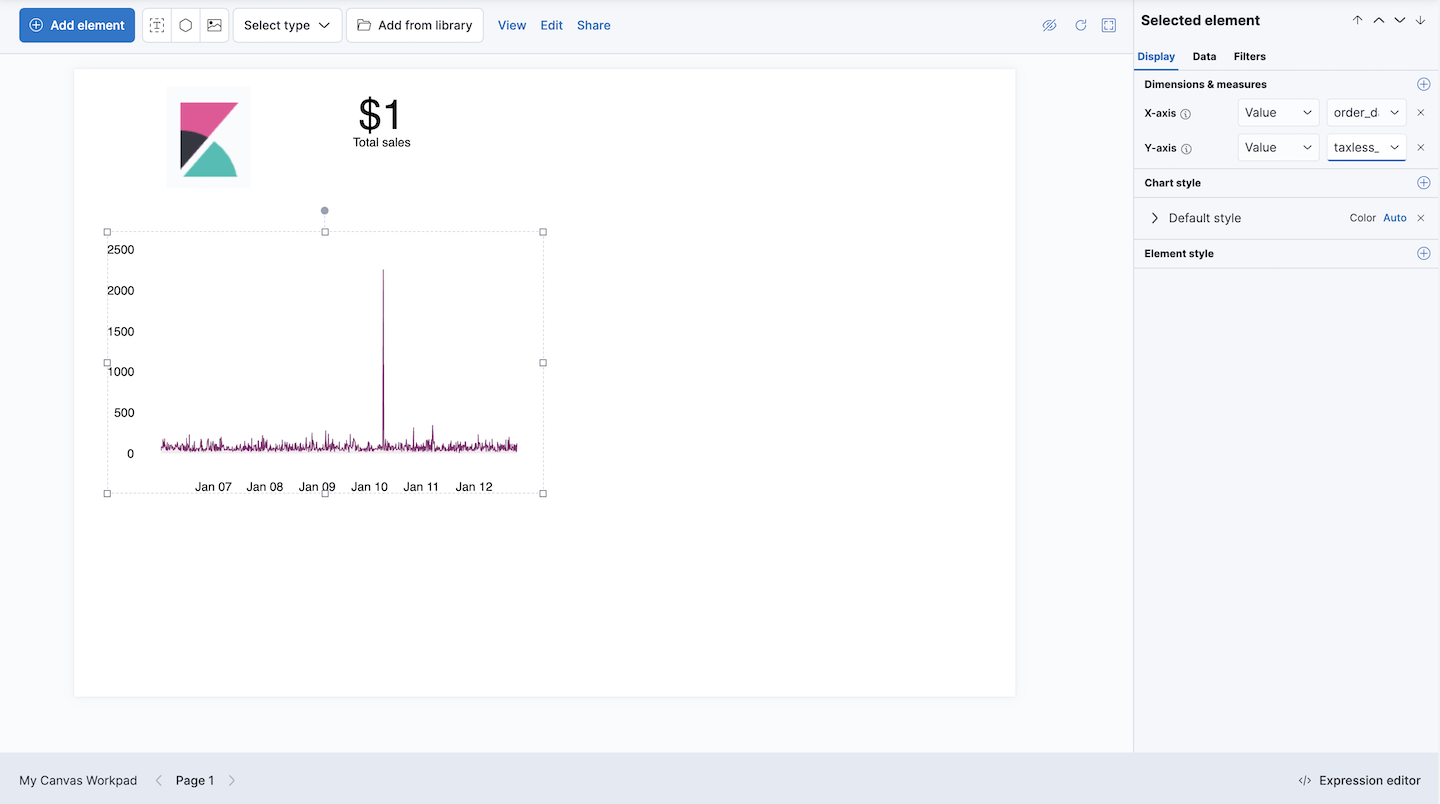
- Click Add element > Chart > Area.
-
Make sure that the element is selected, then click Data > Demo data > Elasticsearch SQL.
-
To obtain the taxless total price by date, enter the following in the Query field:
SELECT order_date, taxless_total_price FROM "kibana_sample_data_ecommerce" ORDER BY order_date
- Click Save.
-
-
Change the display options.
- Click Display
- From the X-axis drop-down lists, select Value, then select order_date.
- From the Y-axis drop-down lists, select Value, then select taxless_total_price.

Show how your data changes over time
editTo focus your data on a specific time range, add the time filter.
- Click Add element > Filter > Time filter.
- Click Display
-
To use the date time field from the sample data, enter
order_datein the Column field, then click Set.

To see how the data changes, set the time filter to Last 7 days. As you change the time filter options, the elements automatically update.
Your workpad is complete!
What’s next?
editNow that you know the basics, you’re ready to explore on your own.
Here are some things to try:
- Play with the sample Canvas workpads.
- Build presentations of your own data with workpads.
- Deep dive into the expression language and functions that drive Canvas.
On this page