- Observability: other versions:
- What is Elastic Observability?
- What’s new in 8.3
- Send data to Elasticsearch
- Spin up the Elastic Stack
- Deploy Elastic Agent to send data
- Deploy Beats to send data
- Elastic Serverless Forwarder for AWS
- Deploy serverless forwarder
- Configuration options
- Troubleshooting
- Observability overview page
- Application performance monitoring (APM)
- Log monitoring
- Metrics monitoring
- Uptime and synthetic monitoring
- User Experience
- Alerting
- Cases
- CI/CD observability
- Troubleshooting
- Fields reference
- Tutorials
Create an infrastructure threshold rule
editCreate an infrastructure threshold rule
editBased on the resources listed on the Inventory page within the Metrics app, you can create a threshold rule to notify you when a metric has reached or exceeded a value for a specific resource or a group of resources within your infrastructure.
Additionally, each rule can be defined using multiple conditions that combine metrics and thresholds to create precise notifications and reduce false positives.
- To access this page, go to Observability > Metrics.
- On the Inventory page or the Metrics Explorer page, click Alerts > Infrastructure.
- Select Create inventory alert.
When you select Create inventory alert, the parameters you configured on the Inventory page will automatically populate the rule. You can use the Inventory first to view which nodes in your infrastructure you’d like to be notified about and then quickly create a rule in just a few clicks.
Inventory conditions
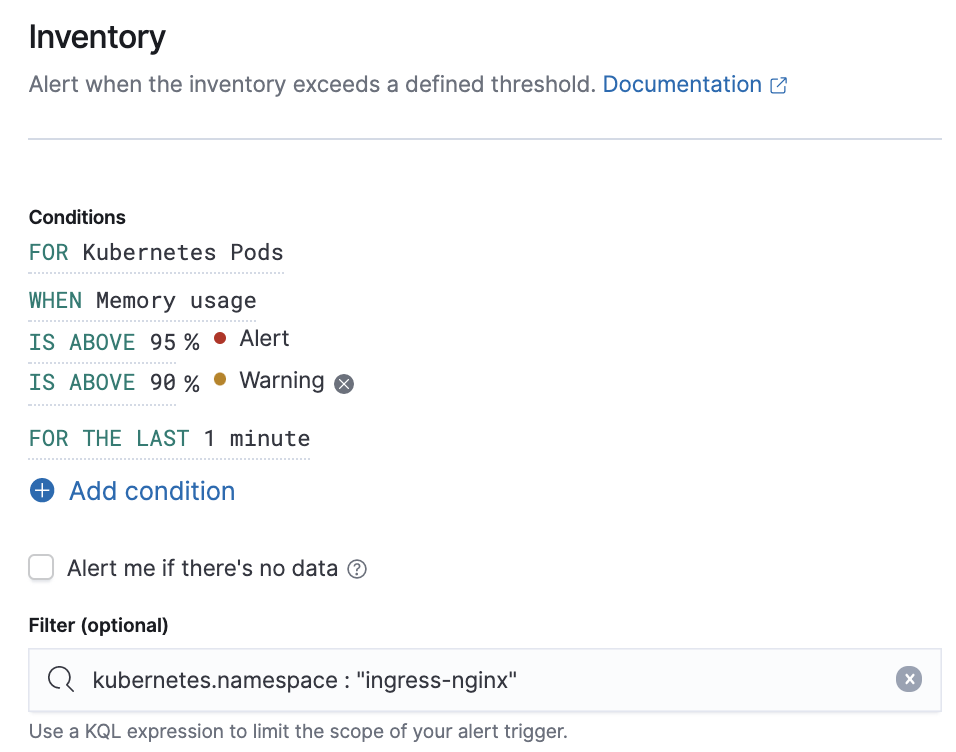
editConditions for each rule can be applied to specific metrics relating to the inventory type you select. You can choose the aggregation type, the metric, and by including a warning threshold value, you can be alerted on multiple threshold values based on severity scores. When creating the rule, you can still get notified if no data is returned for the specific metric or if the rule fails to query Elasticsearch.
In this example, Kubernetes Pods is the selected inventory type. The conditions state that you will receive
a critical alert for any pods within the ingress-nginx namespace with a memory usage of 95% or above
and a warning alert if memory usage is 90% or above.

Before creating a rule, you can preview whether the conditions would have triggered the alert in the last hour, day, week, or month.

Action types
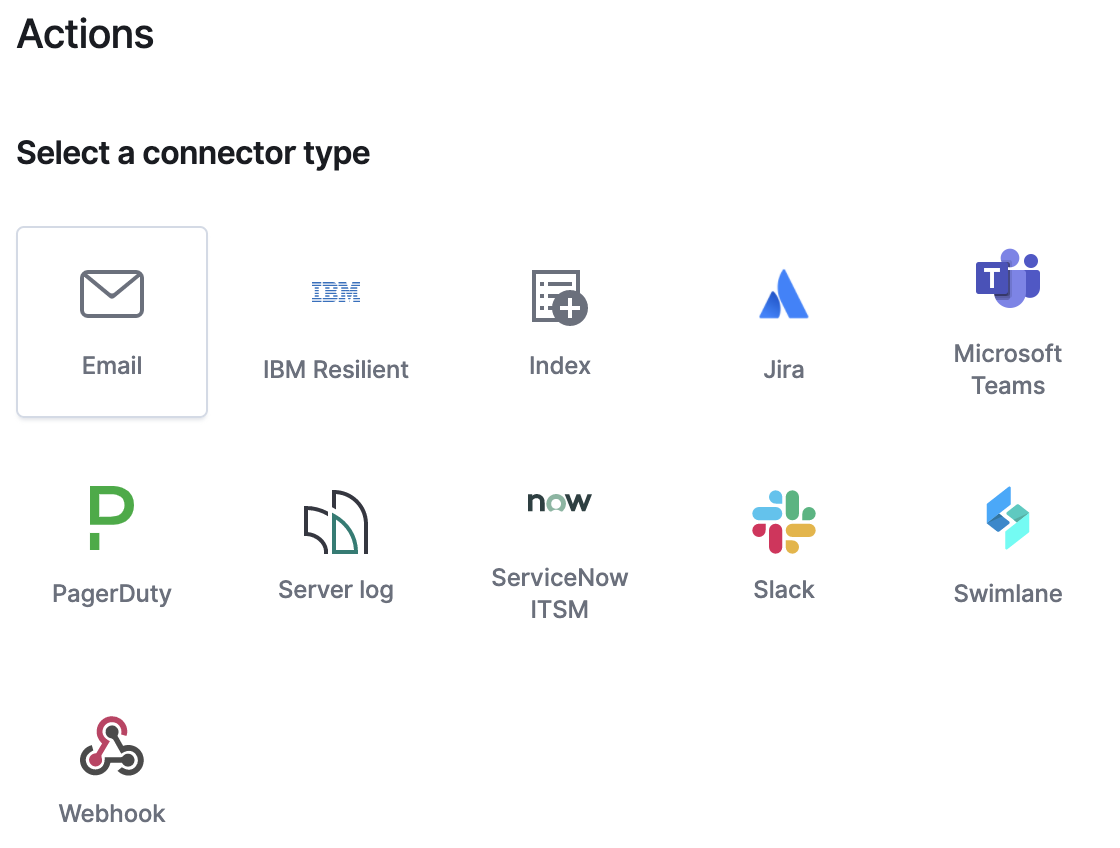
editYou can extend your rules by connecting them to actions that use the following supported built-in integrations.

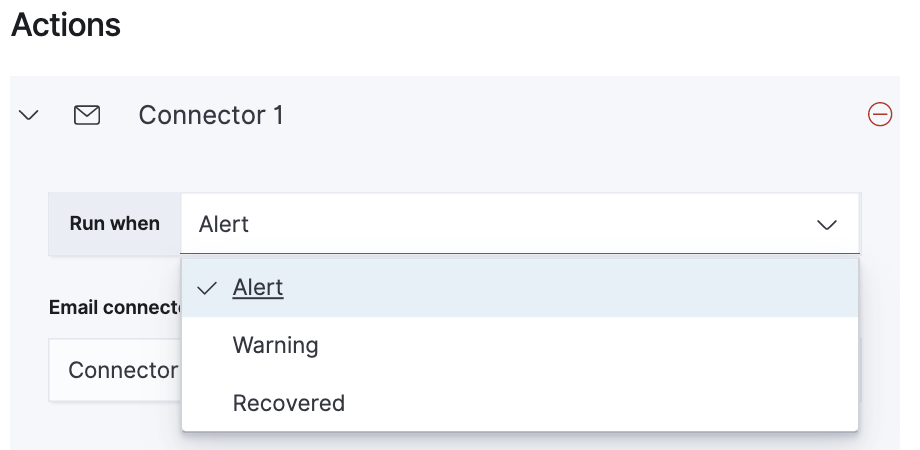
When configuring an action type, you can define precisely when the alert is triggered by selecting a specific
threshold condition: Alert, Warning, or Recovered (a value that was once above a threshold has now dropped below it).

Action variables
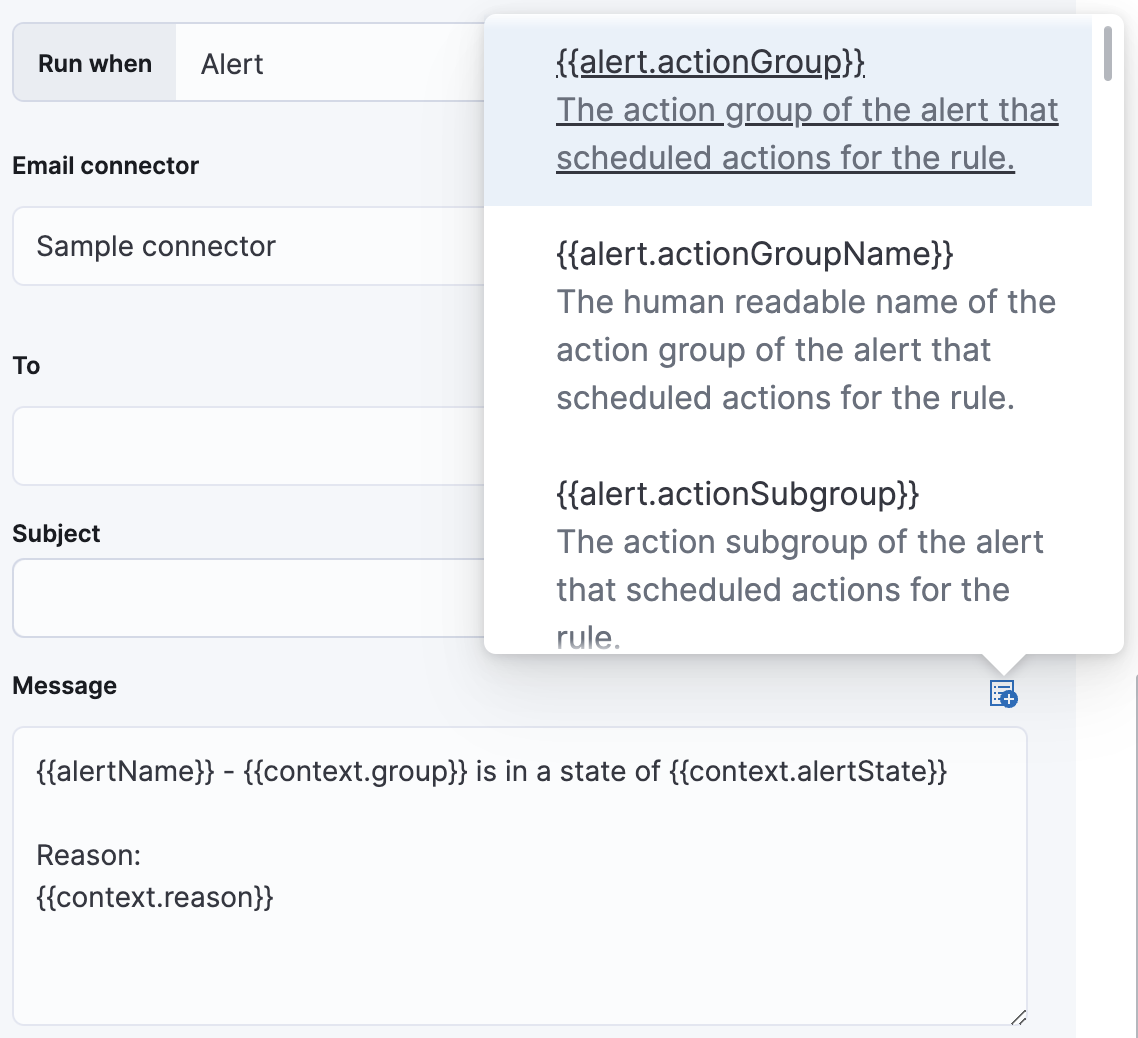
editUse the default notification message or customize it. You can add more context to the message by clicking the icon above the message text box and selecting from a list of available variables.

Settings
editWith infrastructure threshold rules, it’s not possible to set an explicit index pattern as part of the configuration. The index pattern is instead inferred from Metrics indices on the Settings page of the Metrics app.
With each execution of the rule check, the Metrics indices setting is checked, but it is not stored when the rule is created.
The Timestamp field that is set under Settings determines which field is used for timestamps in queries.
ElasticON events are back!
Learn about the Elastic Search AI Platform from the experts at our live events.
Register now