- Observability: other versions:
- What is Elastic Observability?
- What’s new in 8.7
- Send data to Elasticsearch
- Spin up the Elastic Stack
- Deploy Elastic Agent to send data
- Deploy Beats to send data
- Elastic Serverless Forwarder for AWS
- Deploy serverless forwarder
- Configuration options
- Troubleshooting
- Observability overview page
- Application performance monitoring (APM)
- Application logs
- Log monitoring
- Infrastructure monitoring
- Uptime
- Synthetics (beta)
- Get started
- Scripting browser monitors
- Configure lightweight monitors
- Manage monitors
- Analyze monitor data
- Monitor resources on private networks
- Use the CLI
- Configure projects
- Configure Synthetics settings
- Grant users access to secured resources
- Manage data retention
- Use Synthetics with traffic filters
- Migrate from the Elastic Synthetics integration
- User Experience
- Universal Profiling
- Alerting
- Cases
- CI/CD observability
- Troubleshooting
- Fields reference
- Tutorials
- Monitor Amazon Web Services (AWS) with Elastic Agent
- Monitor Amazon Web Services (AWS) with Beats
- Monitor Google Cloud Platform
- Monitor a Java application
- Monitor Kubernetes
- Monitor Microsoft Azure with Elastic Agent
- Monitor Microsoft Azure with the native Azure integration
- Monitor Microsoft Azure with Beats
Monitor Amazon Simple Storage Service (S3)
editMonitor Amazon Simple Storage Service (S3)
editAmazon Simple Storage Service (S3) is a highly available object storage service that provides durability, security, and scalability. To store data, you create one or more buckets that contain objects. An object consists of a file and optional metadata that describes the file. For each bucket, you can control access to it.
Like most AWS services, Amazon S3 and Amazon CloudWatch are integrated so you can collect, view, and analyze CloudWatch metrics for your S3 buckets to help understand and improve the performance of applications that use Amazon S3. The Elastic Amazon S3 integration collects metrics from Amazon CloudWatch using Elastic Agent.
With the Amazon S3 integration, you can collect these S3 metrics from CloudWatch:
- Daily storage metrics for buckets. Use these metrics to monitor bucket storage. These metrics are reported once per day by default and are provided to AWS customers at no additional cost.
- Request metrics. Use these metrics to quickly identify and act on operational issues. These request metrics are available at one-minute intervals after some latency for processing, and they are not enabled by default.
Get started
editIf you plan to collect request metrics, enable them for the S3 buckets you want to monitor. To learn how, refer to the AWS documentation.
To collect S3 metrics, you typically need to install the Elastic Amazon S3 integration and deploy an Elastic Agent locally or on an EC2 instance.
Expand the quick guide to learn how, or skip to the next section if your data is already in Elasticsearch.
Quick guide: Add data
Elastic Agent is currently the preferred way to add S3 metrics. For other ways, refer to Adding data to Elasticsearch.
Dashboards
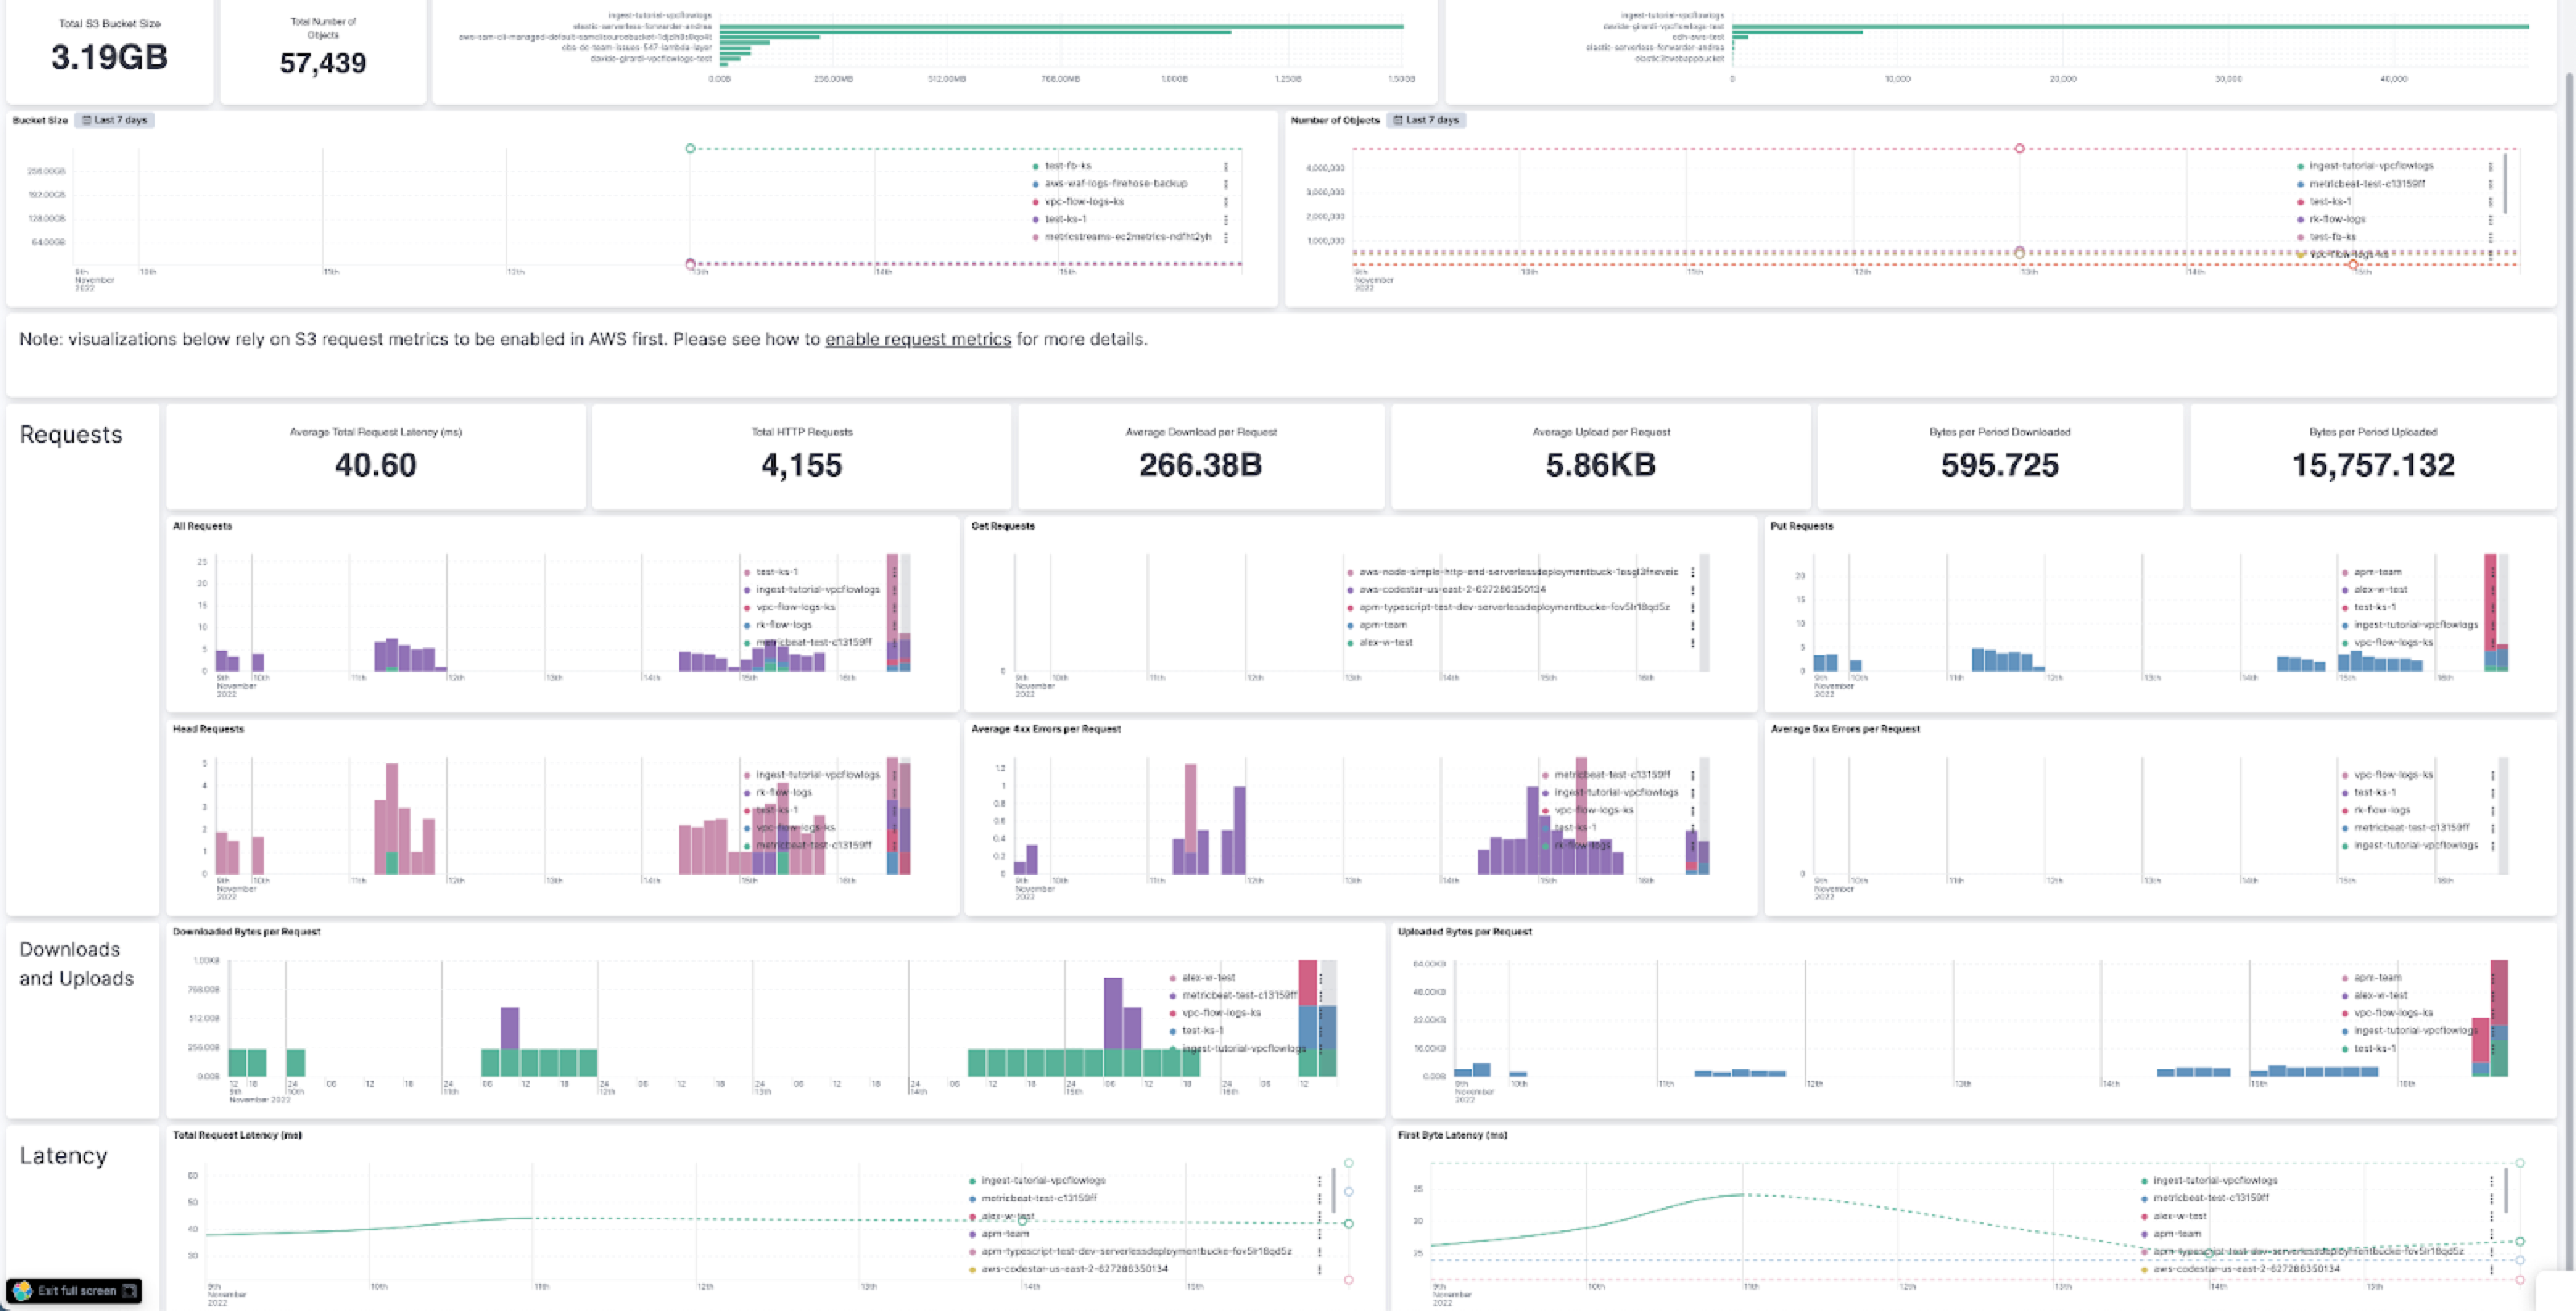
editKibana provides a full data analytics platform with out-of-the-box dashboards that you can clone and enhance to satisfy your custom visualization use cases. For example, to see an overview of your S3 metrics in Kibana, go to the Dashboard app and navigate to the [Metrics AWS] S3 Overview dashboard.

Metrics to watch
editHere are the key metrics that you should watch, organized by category. For a full list of fields exported by the integration, refer to the Amazon S3 integration docs.
-
Daily storage metrics for buckets
-
aws.s3_daily_storage.number_of_objects -
aws.s3_daily_storage.bucket.size.bytes
-
-
Request metrics
-
aws.s3_request.requests.total -
aws.s3_request.requests.get -
aws.s3_request.requests.put -
aws.s3_request.requests.delete -
aws.s3_request.requests.head -
aws.s3_request.requests.post -
aws.s3_request.requests.select -
aws.s3_request.requests.list -
aws.s3_request.requests.select_scanned.bytes -
aws.s3_request.requests.select_returned.bytes -
aws.s3_request.downloaded.bytes -
aws.s3_request.uploaded.bytes -
aws.s3_request.downloaded.bytes_per_period -
aws.s3_request.uploaded.bytes_per_period -
aws.s3_request.errors.4xx -
aws.s3_request.errors.5xx -
aws.s3_request.latency.first_byte.ms -
aws.s3_request.latency.total_request.ms
-
On this page
ElasticON events are back!
Learn about the Elastic Search AI Platform from the experts at our live events.
Register now