- Elastic Security: other versions:
- Elastic Security overview
- What’s new
- Get started with Elastic Security
- Elastic Security UI
- Anomaly Detection with Machine Learning
- Detections and alerts
- Create a detection rule
- Manage detection rules
- Monitor and troubleshoot rule executions
- Rule exceptions and value lists
- About building-block rules
- Manage detection alerts
- Visual event analyzer
- Tune detection rules
- Prebuilt rule changes per release
- Prebuilt rule reference
- AWS Access Secret in Secrets Manager
- AWS CloudTrail Log Created
- AWS CloudTrail Log Deleted
- AWS CloudTrail Log Suspended
- AWS CloudTrail Log Updated
- AWS CloudWatch Alarm Deletion
- AWS CloudWatch Log Group Deletion
- AWS CloudWatch Log Stream Deletion
- AWS Config Service Tampering
- AWS Configuration Recorder Stopped
- AWS EC2 Encryption Disabled
- AWS EC2 Flow Log Deletion
- AWS EC2 Network Access Control List Creation
- AWS EC2 Network Access Control List Deletion
- AWS EC2 Snapshot Activity
- AWS Execution via System Manager
- AWS GuardDuty Detector Deletion
- AWS IAM Assume Role Policy Update
- AWS IAM Brute Force of Assume Role Policy
- AWS IAM Deactivation of MFA Device
- AWS IAM Group Creation
- AWS IAM Group Deletion
- AWS IAM Password Recovery Requested
- AWS IAM User Addition to Group
- AWS Management Console Brute Force of Root User Identity
- AWS Management Console Root Login
- AWS RDS Cluster Creation
- AWS RDS Cluster Deletion
- AWS RDS Instance/Cluster Stoppage
- AWS Root Login Without MFA
- AWS S3 Bucket Configuration Deletion
- AWS WAF Access Control List Deletion
- AWS WAF Rule or Rule Group Deletion
- Abnormally Large DNS Response
- Access of Stored Browser Credentials
- Access to Keychain Credentials Directories
- AdFind Command Activity
- Adding Hidden File Attribute via Attrib
- Administrator Privileges Assigned to an Okta Group
- Administrator Role Assigned to an Okta User
- Adobe Hijack Persistence
- Adversary Behavior - Detected - Elastic Endgame
- Anomalous Kernel Module Activity
- Anomalous Linux Compiler Activity
- Anomalous Process For a Linux Population
- Anomalous Process For a Windows Population
- Anomalous Windows Process Creation
- Apple Script Execution followed by Network Connection
- Apple Scripting Execution with Administrator Privileges
- Application Added to Google Workspace Domain
- Attempt to Create Okta API Token
- Attempt to Deactivate MFA for an Okta User Account
- Attempt to Deactivate an Okta Application
- Attempt to Deactivate an Okta Network Zone
- Attempt to Deactivate an Okta Policy
- Attempt to Deactivate an Okta Policy Rule
- Attempt to Delete an Okta Application
- Attempt to Delete an Okta Network Zone
- Attempt to Delete an Okta Policy
- Attempt to Delete an Okta Policy Rule
- Attempt to Disable Gatekeeper
- Attempt to Disable IPTables or Firewall
- Attempt to Disable Syslog Service
- Attempt to Enable the Root Account
- Attempt to Install Root Certificate
- Attempt to Modify an Okta Application
- Attempt to Modify an Okta Network Zone
- Attempt to Modify an Okta Policy
- Attempt to Modify an Okta Policy Rule
- Attempt to Mount SMB Share via Command Line
- Attempt to Remove File Quarantine Attribute
- Attempt to Reset MFA Factors for an Okta User Account
- Attempt to Revoke Okta API Token
- Attempt to Unload Elastic Endpoint Security Kernel Extension
- Attempted Bypass of Okta MFA
- Attempts to Brute Force a Microsoft 365 User Account
- Attempts to Brute Force an Okta User Account
- Auditd Login Attempt at Forbidden Time
- Auditd Login from Forbidden Location
- Auditd Max Failed Login Attempts
- Auditd Max Login Sessions
- Authorization Plugin Modification
- Azure Active Directory High Risk Sign-in
- Azure Active Directory PowerShell Sign-in
- Azure Application Credential Modification
- Azure Automation Account Created
- Azure Automation Runbook Created or Modified
- Azure Automation Runbook Deleted
- Azure Automation Webhook Created
- Azure Blob Container Access Level Modification
- Azure Command Execution on Virtual Machine
- Azure Conditional Access Policy Modified
- Azure Diagnostic Settings Deletion
- Azure Event Hub Authorization Rule Created or Updated
- Azure Event Hub Deletion
- Azure External Guest User Invitation
- Azure Firewall Policy Deletion
- Azure Global Administrator Role Addition to PIM User
- Azure Key Vault Modified
- Azure Network Watcher Deletion
- Azure Privilege Identity Management Role Modified
- Azure Resource Group Deletion
- Azure Service Principal Addition
- Azure Storage Account Key Regenerated
- Base16 or Base32 Encoding/Decoding Activity
- Bash Shell Profile Modification
- Bypass UAC via Event Viewer
- Clearing Windows Event Logs
- Cobalt Strike Command and Control Beacon
- Command Execution via SolarWinds Process
- Command Prompt Network Connection
- Command Shell Activity Started via RunDLL32
- Component Object Model Hijacking
- Conhost Spawned By Suspicious Parent Process
- Connection to Commonly Abused Free SSL Certificate Providers
- Connection to Commonly Abused Web Services
- Connection to External Network via Telnet
- Connection to Internal Network via Telnet
- Creation of Hidden Files and Directories
- Creation of Hidden Launch Agent or Daemon
- Creation of Hidden Login Item via Apple Script
- Creation of a Hidden Local User Account
- Creation or Modification of Domain Backup DPAPI private key
- Creation or Modification of Root Certificate
- Creation or Modification of a new GPO Scheduled Task or Service
- Credential Acquisition via Registry Hive Dumping
- Credential Dumping - Detected - Elastic Endgame
- Credential Dumping - Prevented - Elastic Endgame
- Credential Manipulation - Detected - Elastic Endgame
- Credential Manipulation - Prevented - Elastic Endgame
- DNS Activity to the Internet
- DNS Tunneling
- Default Cobalt Strike Team Server Certificate
- Delete Volume USN Journal with Fsutil
- Deleting Backup Catalogs with Wbadmin
- Direct Outbound SMB Connection
- Disable Windows Firewall Rules via Netsh
- Disabling User Account Control via Registry Modification
- Domain Added to Google Workspace Trusted Domains
- Dumping Account Hashes via Built-In Commands
- Dumping of Keychain Content via Security Command
- EggShell Backdoor Execution
- Emond Rules Creation or Modification
- Encoded Executable Stored in the Registry
- Encoding or Decoding Files via CertUtil
- Encrypting Files with WinRar or 7z
- Endpoint Security
- Enumeration Command Spawned via WMIPrvSE
- Enumeration of Administrator Accounts
- Enumeration of Kernel Modules
- Enumeration of Users or Groups via Built-in Commands
- Executable File Creation with Multiple Extensions
- Execution from Unusual Directory - Command Line
- Execution of COM object via Xwizard
- Execution of File Written or Modified by Microsoft Office
- Execution of File Written or Modified by PDF Reader
- Execution of Persistent Suspicious Program
- Execution via Electron Child Process Node.js Module
- Execution via MSSQL xp_cmdshell Stored Procedure
- Execution via TSClient Mountpoint
- Execution via local SxS Shared Module
- Execution with Explicit Credentials via Scripting
- Exploit - Detected - Elastic Endgame
- Exploit - Prevented - Elastic Endgame
- Exporting Exchange Mailbox via PowerShell
- External Alerts
- External IP Lookup fron Non-Browser Process
- File Deletion via Shred
- File Permission Modification in Writable Directory
- File and Directory Discovery
- Finder Sync Plugin Registered and Enabled
- GCP Firewall Rule Creation
- GCP Firewall Rule Deletion
- GCP Firewall Rule Modification
- GCP IAM Custom Role Creation
- GCP IAM Role Deletion
- GCP IAM Service Account Key Deletion
- GCP Logging Bucket Deletion
- GCP Logging Sink Deletion
- GCP Logging Sink Modification
- GCP Pub/Sub Subscription Creation
- GCP Pub/Sub Subscription Deletion
- GCP Pub/Sub Topic Creation
- GCP Pub/Sub Topic Deletion
- GCP Service Account Creation
- GCP Service Account Deletion
- GCP Service Account Disabled
- GCP Service Account Key Creation
- GCP Storage Bucket Configuration Modification
- GCP Storage Bucket Deletion
- GCP Storage Bucket Permissions Modification
- GCP Virtual Private Cloud Network Deletion
- GCP Virtual Private Cloud Route Creation
- GCP Virtual Private Cloud Route Deletion
- Google Workspace API Access Granted via Domain-Wide Delegation of Authority
- Google Workspace Admin Role Assigned to a User
- Google Workspace Admin Role Deletion
- Google Workspace Custom Admin Role Created
- Google Workspace MFA Enforcement Disabled
- Google Workspace Password Policy Modified
- Google Workspace Role Modified
- Halfbaked Command and Control Beacon
- High Number of Okta User Password Reset or Unlock Attempts
- High Number of Process and/or Service Terminations
- Hosts File Modified
- Hping Process Activity
- IIS HTTP Logging Disabled
- IPSEC NAT Traversal Port Activity
- Image File Execution Options Injection
- ImageLoad via Windows Update Auto Update Client
- Inbound Connection to an Unsecure Elasticsearch Node
- Incoming DCOM Lateral Movement via MSHTA
- Incoming DCOM Lateral Movement with MMC
- Incoming DCOM Lateral Movement with ShellBrowserWindow or ShellWindows
- Incoming Execution via PowerShell Remoting
- Incoming Execution via WinRM Remote Shell
- InstallUtil Process Making Network Connections
- Installation of Custom Shim Databases
- Installation of Security Support Provider
- Interactive Terminal Spawned via Perl
- Interactive Terminal Spawned via Python
- Kerberos Cached Credentials Dumping
- Kerberos Traffic from Unusual Process
- Kernel Module Removal
- Keychain Password Retrieval via Command Line
- LSASS Memory Dump Creation
- Lateral Movement via Startup Folder
- Lateral Tool Transfer
- Launch Agent Creation or Modification and Immediate Loading
- LaunchDaemon Creation or Modification and Immediate Loading
- Local Scheduled Task Creation
- MFA Disabled for Google Workspace Organization
- Malware - Detected - Elastic Endgame
- Malware - Prevented - Elastic Endgame
- Microsoft 365 Exchange Anti-Phish Policy Deletion
- Microsoft 365 Exchange Anti-Phish Rule Modification
- Microsoft 365 Exchange DKIM Signing Configuration Disabled
- Microsoft 365 Exchange DLP Policy Removed
- Microsoft 365 Exchange Malware Filter Policy Deletion
- Microsoft 365 Exchange Malware Filter Rule Modification
- Microsoft 365 Exchange Management Group Role Assignment
- Microsoft 365 Exchange Safe Attachment Rule Disabled
- Microsoft 365 Exchange Safe Link Policy Disabled
- Microsoft 365 Exchange Transport Rule Creation
- Microsoft 365 Exchange Transport Rule Modification
- Microsoft 365 New Inbox Rule Created
- Microsoft 365 Teams Custom Application Interaction Allowed
- Microsoft 365 Teams External Access Enabled
- Microsoft 365 Teams Guest Access Enabled
- Microsoft Build Engine Loading Windows Credential Libraries
- Microsoft Build Engine Started an Unusual Process
- Microsoft Build Engine Started by a Script Process
- Microsoft Build Engine Started by a System Process
- Microsoft Build Engine Started by an Office Application
- Microsoft Build Engine Using an Alternate Name
- Microsoft Exchange Server UM Spawning Suspicious Processes
- Microsoft Exchange Server UM Writing Suspicious Files
- Microsoft Exchange Worker Spawning Suspicious Processes
- Microsoft IIS Connection Strings Decryption
- Microsoft IIS Service Account Password Dumped
- Mimikatz Memssp Log File Detected
- Modification of Boot Configuration
- Modification of Dynamic Linker Preload Shared Object
- Modification of Environment Variable via Launchctl
- Modification of OpenSSH Binaries
- Modification of Safari Settings via Defaults Command
- Modification of Standard Authentication Module or Configuration
- Modification of WDigest Security Provider
- Modification or Removal of an Okta Application Sign-On Policy
- Mounting Hidden or WebDav Remote Shares
- MsBuild Making Network Connections
- Mshta Making Network Connections
- Multi-Factor Authentication Disabled for an Azure User
- NTDS or SAM Database File Copied
- Net command via SYSTEM account
- Netcat Network Activity
- Network Connection via Certutil
- Network Connection via Compiled HTML File
- Network Connection via MsXsl
- Network Connection via Registration Utility
- Network Connection via Signed Binary
- Network Logon Provider Registry Modification
- Network Traffic to Rare Destination Country
- New ActiveSyncAllowedDeviceID Added via PowerShell
- Nping Process Activity
- NullSessionPipe Registry Modification
- Okta Brute Force or Password Spraying Attack
- Outbound Scheduled Task Activity via PowerShell
- Peripheral Device Discovery
- Permission Theft - Detected - Elastic Endgame
- Permission Theft - Prevented - Elastic Endgame
- Persistence via BITS Job Notify Cmdline
- Persistence via DirectoryService Plugin Modification
- Persistence via Docker Shortcut Modification
- Persistence via Folder Action Script
- Persistence via Hidden Run Key Detected
- Persistence via KDE AutoStart Script or Desktop File Modification
- Persistence via Login or Logout Hook
- Persistence via Microsoft Office AddIns
- Persistence via Microsoft Outlook VBA
- Persistence via Scheduled Job Creation
- Persistence via TelemetryController Scheduled Task Hijack
- Persistence via Update Orchestrator Service Hijack
- Persistence via WMI Event Subscription
- Persistence via WMI Standard Registry Provider
- Persistent Scripts in the Startup Directory
- Port Forwarding Rule Addition
- Possible Consent Grant Attack via Azure-Registered Application
- Possible FIN7 DGA Command and Control Behavior
- Possible Okta DoS Attack
- Potential Admin Group Account Addition
- Potential Application Shimming via Sdbinst
- Potential Command and Control via Internet Explorer
- Potential Cookies Theft via Browser Debugging
- Potential Credential Access via Windows Utilities
- Potential DLL SideLoading via Trusted Microsoft Programs
- Potential DNS Tunneling via Iodine
- Potential DNS Tunneling via NsLookup
- Potential Disabling of SELinux
- Potential Evasion via Filter Manager
- Potential Hidden Local User Account Creation
- Potential Kerberos Attack via Bifrost
- Potential LSA Authentication Package Abuse
- Potential Microsoft Office Sandbox Evasion
- Potential Modification of Accessibility Binaries
- Potential OpenSSH Backdoor Logging Activity
- Potential Password Spraying of Microsoft 365 User Accounts
- Potential Persistence via Atom Init Script Modification
- Potential Persistence via Login Hook
- Potential Persistence via Periodic Tasks
- Potential Persistence via Time Provider Modification
- Potential Port Monitor or Print Processor Registration Abuse
- Potential Privacy Control Bypass via Localhost Secure Copy
- Potential Privacy Control Bypass via TCCDB Modification
- Potential Privilege Escalation via Sudoers File Modification
- Potential Process Herpaderping Attempt
- Potential Protocol Tunneling via EarthWorm
- Potential Remote Desktop Shadowing Activity
- Potential Remote Desktop Tunneling Detected
- Potential Reverse Shell Activity via Terminal
- Potential SSH Brute Force Detected
- Potential Secure File Deletion via SDelete Utility
- Potential SharpRDP Behavior
- Potential Shell via Web Server
- Potential Windows Error Manager Masquerading
- Privilege Escalation via Named Pipe Impersonation
- Privilege Escalation via Root Crontab File Modification
- Privilege Escalation via Windir Environment Variable
- Process Activity via Compiled HTML File
- Process Execution from an Unusual Directory
- Process Injection - Detected - Elastic Endgame
- Process Injection - Prevented - Elastic Endgame
- Process Injection by the Microsoft Build Engine
- Process Termination followed by Deletion
- Program Files Directory Masquerading
- Prompt for Credentials with OSASCRIPT
- PsExec Network Connection
- RDP (Remote Desktop Protocol) from the Internet
- RDP Enabled via Registry
- RPC (Remote Procedure Call) from the Internet
- RPC (Remote Procedure Call) to the Internet
- Ransomware - Detected - Elastic Endgame
- Ransomware - Prevented - Elastic Endgame
- Rare AWS Error Code
- Registry Persistence via AppCert DLL
- Registry Persistence via AppInit DLL
- Remote Desktop Enabled in Windows Firewall
- Remote Execution via File Shares
- Remote File Copy to a Hidden Share
- Remote File Copy via TeamViewer
- Remote File Download via Desktopimgdownldr Utility
- Remote File Download via MpCmdRun
- Remote File Download via PowerShell
- Remote File Download via Script Interpreter
- Remote SSH Login Enabled via systemsetup Command
- Remote Scheduled Task Creation
- Remote System Discovery Commands
- Remotely Started Services via RPC
- Renamed AutoIt Scripts Interpreter
- Roshal Archive (RAR) or PowerShell File Downloaded from the Internet
- SIP Provider Modification
- SMB (Windows File Sharing) Activity to the Internet
- SMTP on Port 26/TCP
- SSH Authorized Keys File Modification
- SUNBURST Command and Control Activity
- Scheduled Task Created by a Windows Script
- Scheduled Tasks AT Command Enabled
- Searching for Saved Credentials via VaultCmd
- Security Software Discovery using WMIC
- Security Software Discovery via Grep
- Sensitive Files Compression
- Service Command Lateral Movement
- Service Control Spawned via Script Interpreter
- Setuid / Setgid Bit Set via chmod
- Shell Execution via Apple Scripting
- Shortcut File Written or Modified for Persistence
- SoftwareUpdate Preferences Modification
- SolarWinds Process Disabling Services via Registry
- Spike in AWS Error Messages
- Spike in Firewall Denies
- Spike in Network Traffic
- Spike in Network Traffic To a Country
- Startup Folder Persistence via Unsigned Process
- Startup or Run Key Registry Modification
- Strace Process Activity
- Sublime Plugin or Application Script Modification
- Sudo Heap-Based Buffer Overflow Attempt
- Sudoers File Modification
- Suspicious .NET Code Compilation
- Suspicious Activity Reported by Okta User
- Suspicious Automator Workflows Execution
- Suspicious Browser Child Process
- Suspicious Calendar File Modification
- Suspicious Child Process of Adobe Acrobat Reader Update Service
- Suspicious Cmd Execution via WMI
- Suspicious DLL Loaded for Persistence or Privilege Escalation
- Suspicious Emond Child Process
- Suspicious Endpoint Security Parent Process
- Suspicious Execution - Short Program Name
- Suspicious Execution via Scheduled Task
- Suspicious Explorer Child Process
- Suspicious Hidden Child Process of Launchd
- Suspicious Image Load (taskschd.dll) from MS Office
- Suspicious ImagePath Service Creation
- Suspicious JAR Child Process
- Suspicious MS Office Child Process
- Suspicious MS Outlook Child Process
- Suspicious Managed Code Hosting Process
- Suspicious PDF Reader Child Process
- Suspicious PowerShell Engine ImageLoad
- Suspicious Powershell Script
- Suspicious Print Spooler Point and Print DLL
- Suspicious PrintSpooler SPL File Created
- Suspicious PrintSpooler Service Executable File Creation
- Suspicious Process Execution via Renamed PsExec Executable
- Suspicious Process from Conhost
- Suspicious RDP ActiveX Client Loaded
- Suspicious Script Object Execution
- Suspicious SolarWinds Child Process
- Suspicious Startup Shell Folder Modification
- Suspicious WMI Image Load from MS Office
- Suspicious WMIC XSL Script Execution
- Suspicious WerFault Child Process
- Suspicious Zoom Child Process
- Suspicious macOS MS Office Child Process
- Svchost spawning Cmd
- System Log File Deletion
- System Shells via Services
- SystemKey Access via Command Line
- TCC Bypass via Mounted APFS Snapshot Access
- Tampering of Bash Command-Line History
- Telnet Port Activity
- Threat Detected by Okta ThreatInsight
- Threat Intel Filebeat Module Indicator Match
- Timestomping using Touch Command
- UAC Bypass Attempt via Elevated COM Internet Explorer Add-On Installer
- UAC Bypass Attempt via Privileged IFileOperation COM Interface
- UAC Bypass Attempt via Windows Directory Masquerading
- UAC Bypass Attempt with IEditionUpgradeManager Elevated COM Interface
- UAC Bypass via DiskCleanup Scheduled Task Hijack
- UAC Bypass via ICMLuaUtil Elevated COM Interface
- UAC Bypass via Windows Firewall Snap-In Hijack
- Uncommon Registry Persistence Change
- Unusual AWS Command for a User
- Unusual Child Process from a System Virtual Process
- Unusual Child Process of dns.exe
- Unusual Child Processes of RunDLL32
- Unusual City For an AWS Command
- Unusual Country For an AWS Command
- Unusual DNS Activity
- Unusual Executable File Creation by a System Critical Process
- Unusual File Creation - Alternate Data Stream
- Unusual File Modification by dns.exe
- Unusual Linux Network Activity
- Unusual Linux Network Connection Discovery
- Unusual Linux Network Port Activity
- Unusual Linux Network Service
- Unusual Linux Process Calling the Metadata Service
- Unusual Linux Process Discovery Activity
- Unusual Linux System Information Discovery Activity
- Unusual Linux System Network Configuration Discovery
- Unusual Linux System Owner or User Discovery Activity
- Unusual Linux User Calling the Metadata Service
- Unusual Linux Username
- Unusual Linux Web Activity
- Unusual Login Activity
- Unusual Network Activity from a Windows System Binary
- Unusual Network Connection via RunDLL32
- Unusual Network Destination Domain Name
- Unusual Parent Process for cmd.exe
- Unusual Parent-Child Relationship
- Unusual Persistence via Services Registry
- Unusual Process Execution - Temp
- Unusual Process Execution Path - Alternate Data Stream
- Unusual Process For a Linux Host
- Unusual Process For a Windows Host
- Unusual Process Network Connection
- Unusual Service Host Child Process - Childless Service
- Unusual Sudo Activity
- Unusual Web Request
- Unusual Web User Agent
- Unusual Windows Network Activity
- Unusual Windows Path Activity
- Unusual Windows Process Calling the Metadata Service
- Unusual Windows Remote User
- Unusual Windows Service
- Unusual Windows User Calling the Metadata Service
- Unusual Windows User Privilege Elevation Activity
- Unusual Windows Username
- User Account Creation
- User Added as Owner for Azure Application
- User Added as Owner for Azure Service Principal
- User Added to Privileged Group in Active Directory
- VNC (Virtual Network Computing) from the Internet
- VNC (Virtual Network Computing) to the Internet
- Virtual Machine Fingerprinting
- Virtual Private Network Connection Attempt
- Volume Shadow Copy Deletion via VssAdmin
- Volume Shadow Copy Deletion via WMIC
- WMI Incoming Lateral Movement
- Web Application Suspicious Activity: No User Agent
- Web Application Suspicious Activity: POST Request Declined
- Web Application Suspicious Activity: Unauthorized Method
- Web Application Suspicious Activity: sqlmap User Agent
- WebProxy Settings Modification
- WebServer Access Logs Deleted
- Whoami Process Activity
- Windows CryptoAPI Spoofing Vulnerability (CVE-2020-0601 - CurveBall)
- Windows Defender Disabled via Registry Modification
- Windows Event Logs Cleared
- Windows Network Enumeration
- Windows Script Executing PowerShell
- Windows Script Interpreter Executing Process via WMI
- Zoom Meeting with no Passcode
- macOS Installer Spawns Network Event
- Downloadable rule updates
- Investigate events
- Cases
- Elastic Security APIs
- Detections API
- Exceptions API
- Lists API
- Detection Alerts Migration API
- Timeline API
- Get Timelines or Timeline templates
- Get Timeline / Timeline template by savedObjectId
- Get Timeline template by templateTimelineId
- Create Timeline or Timeline template
- Add a note to an existing Timeline
- Pin an event to an existing Timeline
- Delete Timelines or Timeline templates
- Import timelines and timeline templates
- Cases API
- Create case
- Add comment
- Update case
- Update comment
- Find cases
- Get case
- Get all case comments
- Get comment
- Get all case activity
- Get tags
- Get reporters
- Get status
- Delete comment
- Delete all comments
- Delete case
- Set default Elastic Security UI connector
- Update case configurations
- Get current connector
- Find connectors
- Push case
- Add external details to case
- Actions API (for pushing cases to external systems)
- Elastic Security fields and object schemas
- Enable process analyzer after an upgrade
- Release Notes
Manage detection alerts
editManage detection alerts
editThe Detections page displays all detection alerts. From the Alerts table, you can filter alerts, change an alert’s status, and start investigating and analyzing alerts in Timeline.
From Timeline, you can create cases to track issues and share information with colleagues.
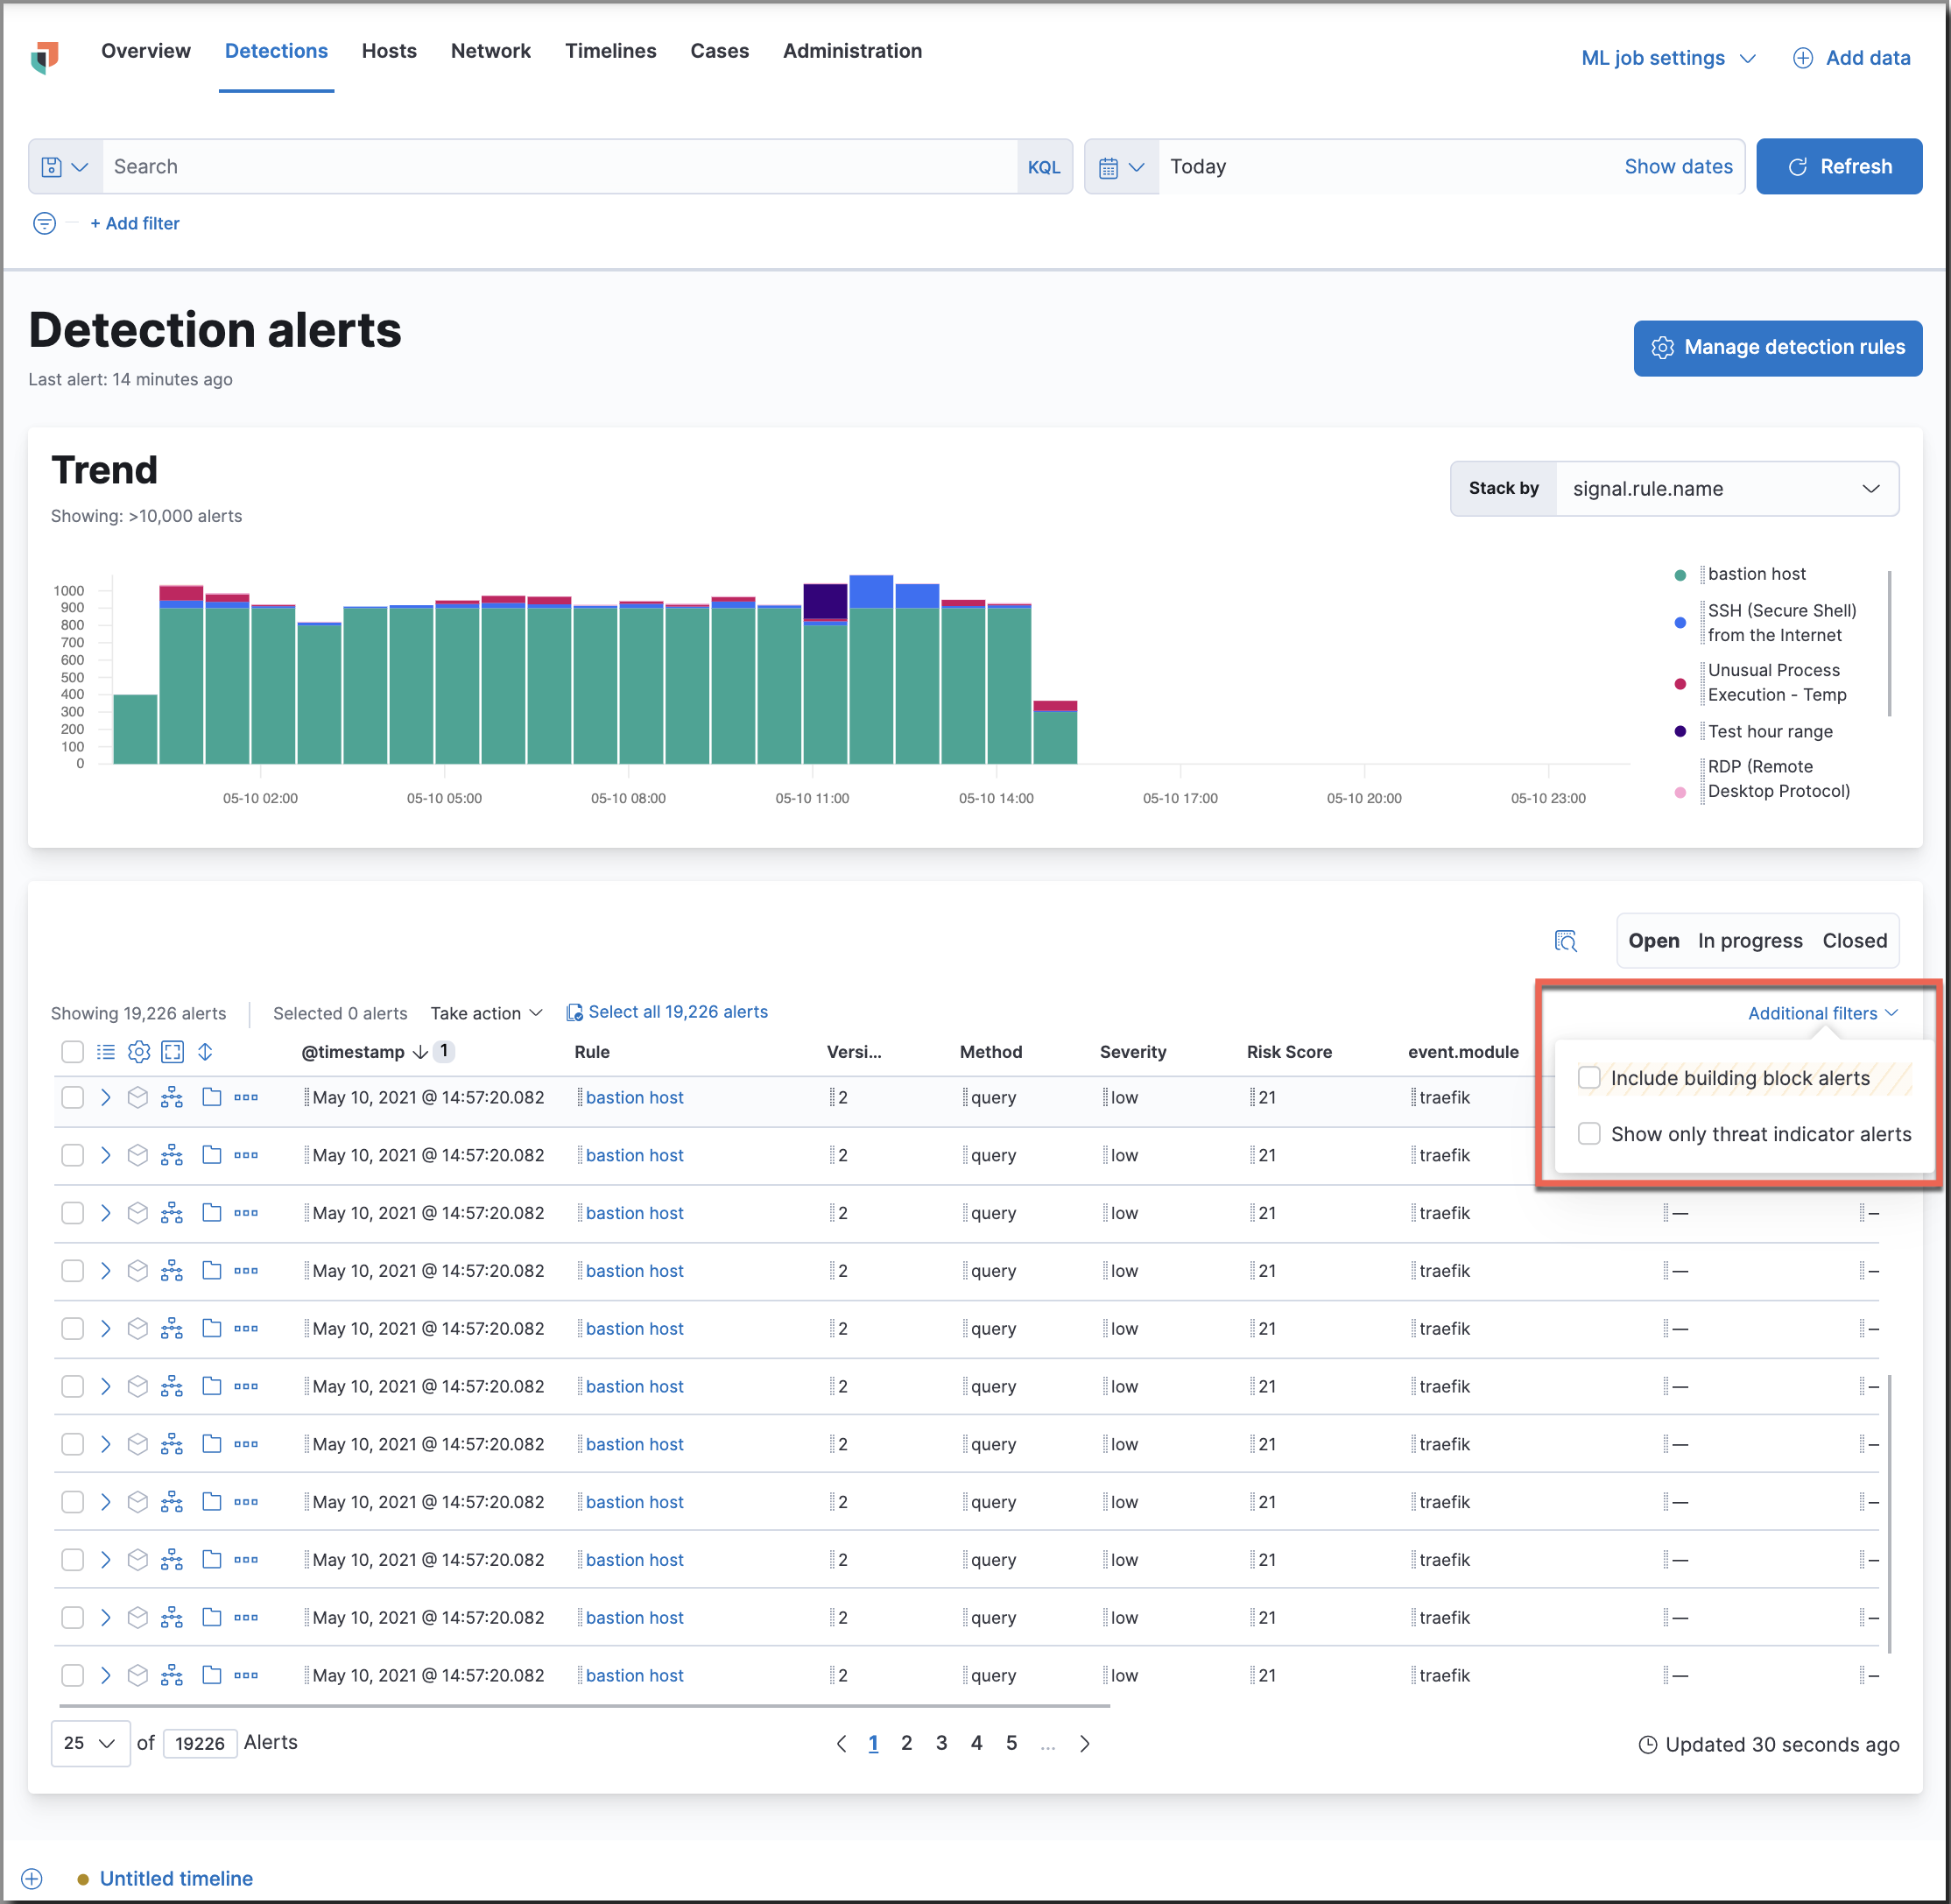
View and filter detection alerts
editThe Detections page offers various ways for you to organize and triage detection alerts as you investigate suspicious events. You can:
-
Filter for a specific rule in the KQL bar (for example,
signal.rule.name :"SSH (Secure Shell) from the Internet").
KQL autocomplete for .siem-signals-* indices is available on the
Detections and Rule details pages, and in Timeline when either All or
Detection alerts is selected.
- Use the date and time filter to select a time range that you’re interested in exploring. By default, this filter is set to search the last 24 hours.
- View detection alerts generated by a specific rule. To do this, click Manage detection rules, then click on a rule name in the All rules table. The Rules detail page displays a comprehensive view of the rule’s details, and alert details are displayed in the Alerts table beneath the Trend histogram.
-
Use the Stack by drop-down in the Trend histogram to select specific parameters to visualize the individual counts. For example, if you select
signal.rule.name, the histogram displays the total counts by alert name. - Filter alert results to include building block alerts or to only show alerts from indicator match rules by selecting the Additional filters drop-down. By default, building block alerts are excluded from the Alerts table; therefore, including them expands the number of alerts.
When updating alert results to include building block alerts, the Security app searches the .siem-signals-<Kibana space> index for the signal.rule.building_block_type field. When looking for alerts created from indicator match rules, the app searches the same index for the signal.rule.threat_mapping field.
Customize the Alerts table
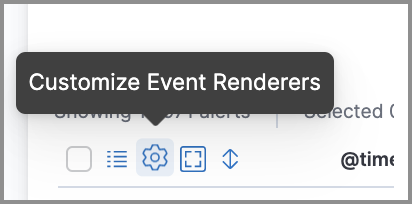
editUse the buttons in the upper left corner of the Alerts table to customize the columns you want displayed and to view the table in full-screen mode.

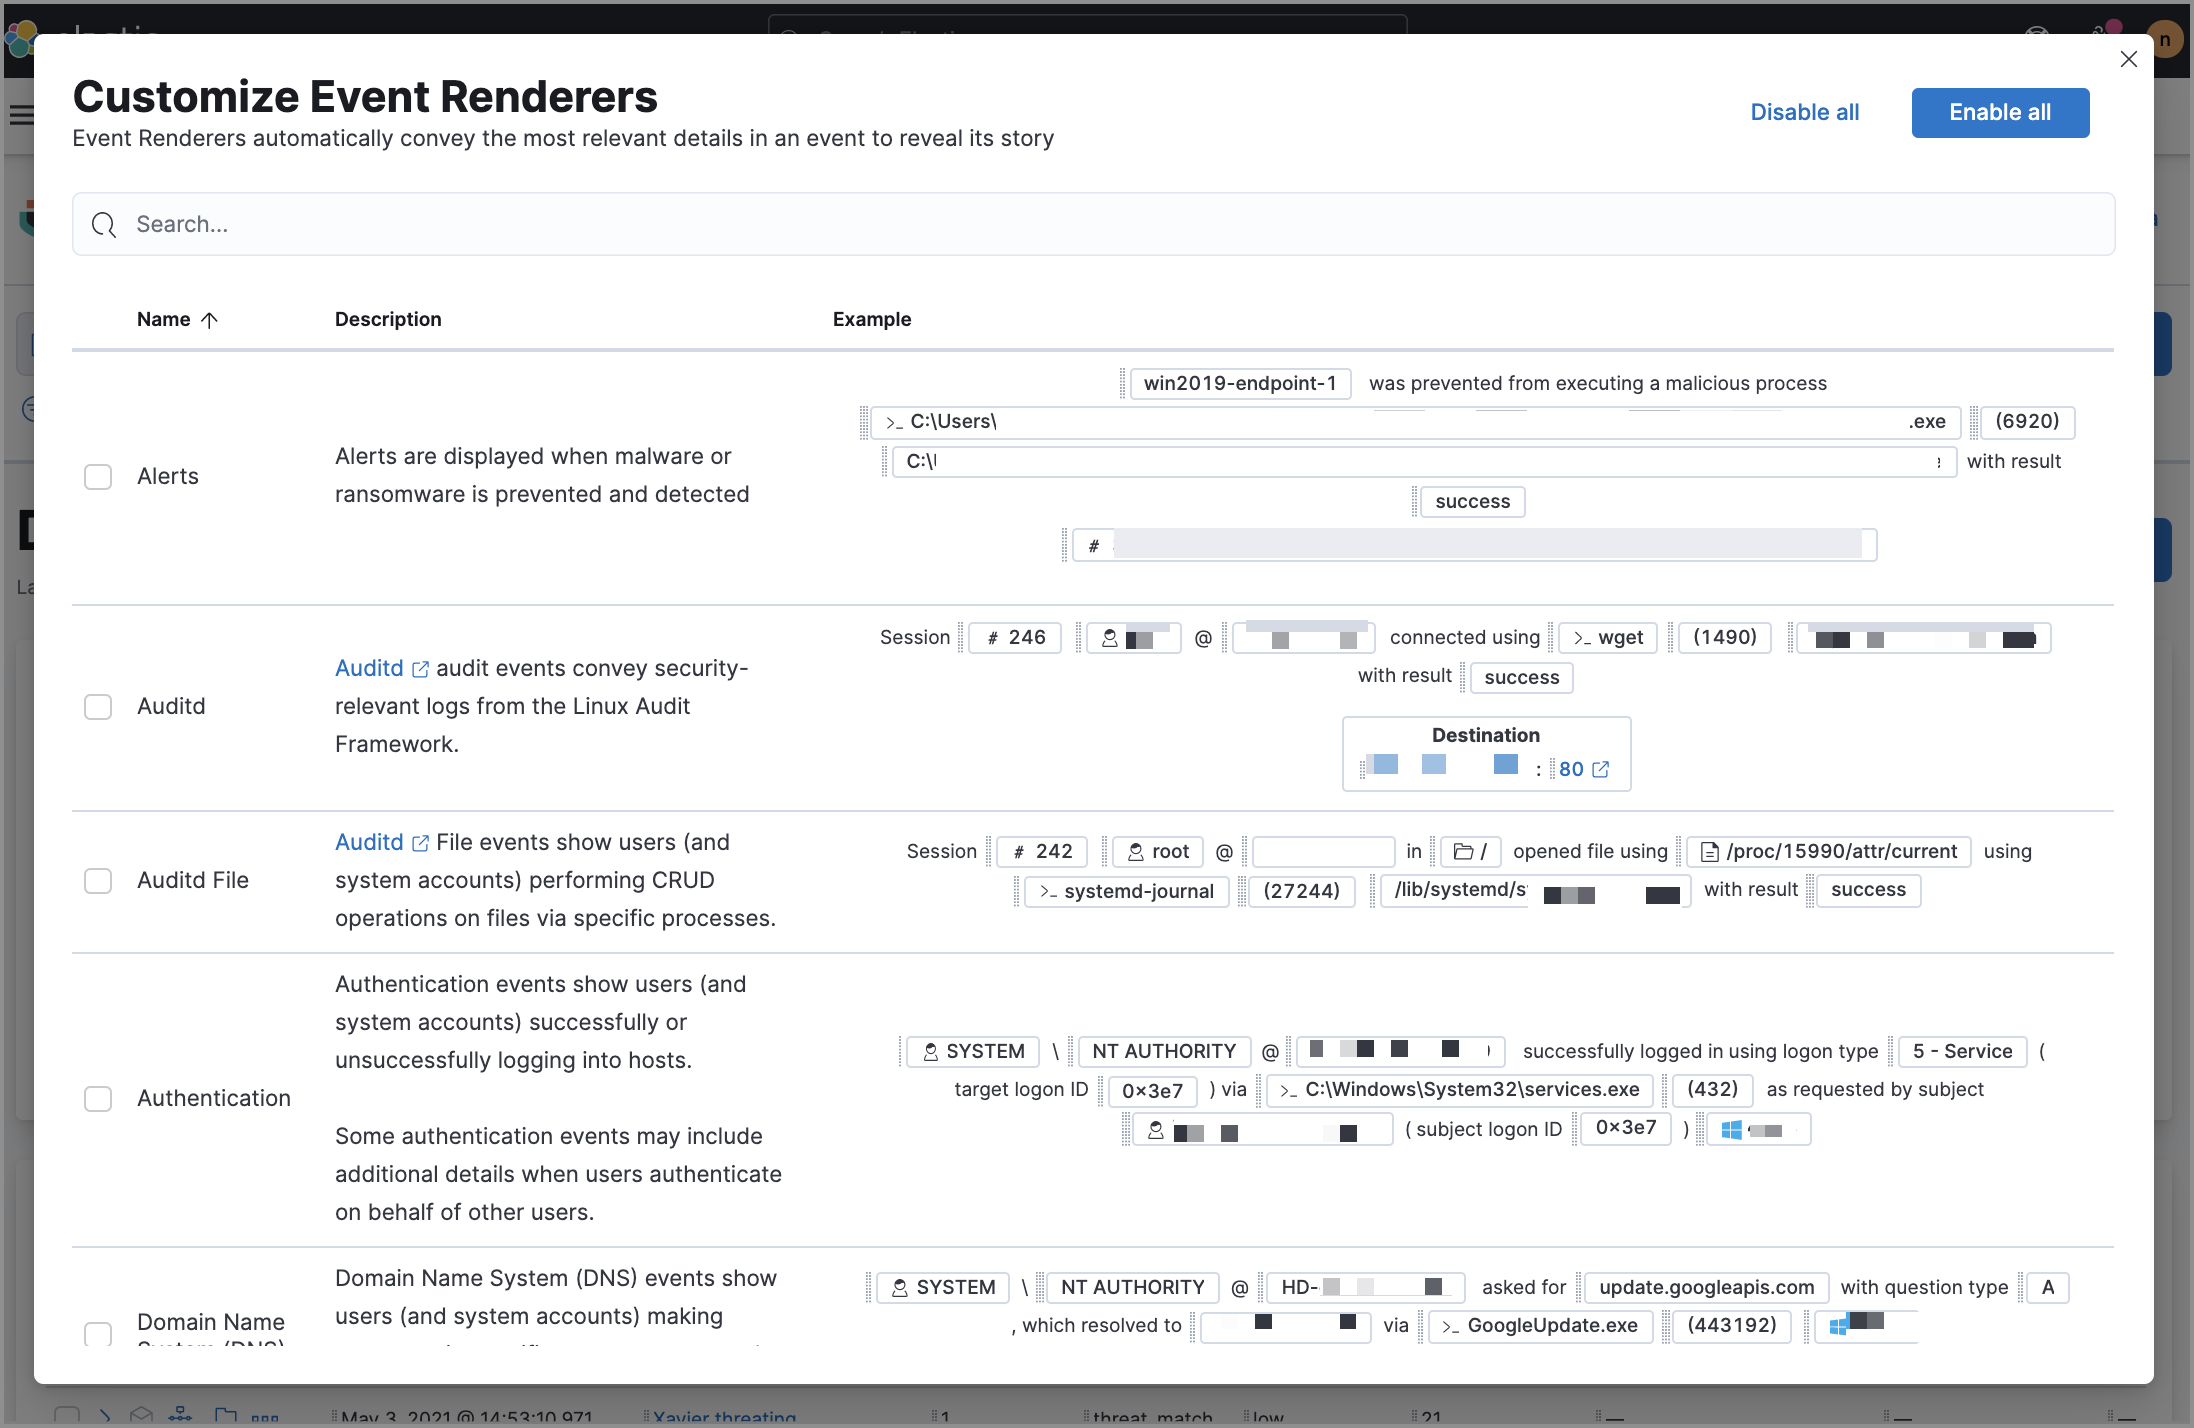
Click the Customize Event Renderers button to enable event renderers within the Alerts table. When enabled, event renderers show relevant details that provide more context about the event. For example, if you enable the Flow Event Renderer, the Alerts table shows details that describe the data flow between a source and destination — such as hosts, ports, protocol, direction, duration, amount transferred, process, and geographic location.
All event renderers are disabled by default. To switch between event views in the Alerts table, you can enable individual event renderers or click Enable all. Closing the Customize Event Renderers page saves your configurations.
View alert details
editTo further inspect an alert, click the View details button from the Alerts table.
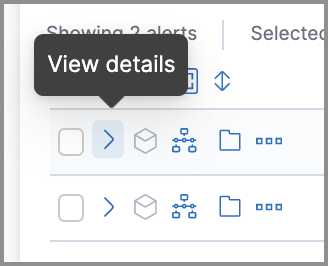
The Alert details flyout appears and offers several options for viewing alert details:
-
Summary: Shows an aggregated view of alert details. Alerts that have been enriched with
threat.indicatordata also display the threat summary section, which is an additional section located beneath the alert summary. In the threat summary section, you can view mapped data for the followingthreat.indicatorsubfields:-
matched.field -
matched.type -
source (threat.indicator.provider) -
first_seen -
last_seen
-
If an alert is linked to more than one threat, a compiled version of threat indicator data displays in the threat summary section. A more detailed view displays within the Threat Intel tab.
-
Threat Intel: Shows the number of matched threats and displays them individually. Threats appear in reverse chronological order, with the most recent alerts at the top. The available
threat.indicatorandsource.eventdata is displayed for each threat. If the alert has not been enriched with threat data, the Threat Intel tab displays the message "No Threat Intel Enrichment Found" and provides a link to Threat Intel module documentation. - Table: Shows the alert details in table format. Alert details are organized into field value pairs.
- JSON View: Shows the alert details in JSON format.
Change an alert’s status
editYou can set an alert’s status to indicate whether it needs to be investigated (Open), is under active investigation (In progress), or resolved (Closed). By default, the Alerts table displays open alerts. To view alerts with other statuses, click In progress or Closed.
To change alert statuses, do one of the following:
- In the alert’s row, click the More actions button, then select the appropriate status (Mark in progress, Close alert, or Open alert).
- In the Alerts table, select all the alerts you want to change, then select Take action → Close selected, Open selected, or Mark in progress.
Add alerts to cases
editFrom the Alerts table, you can attach one or more alerts to a case by clicking the Add to case button. From here, you can choose to add the alert to a new case or attach it to an existing one. You can add an unlimited amount of alerts from any rule type. If you attach the alert to a case that has been configured to sync its status with associated alerts, the alert’s status updates any time the case’s status is modified.
Once you’ve added an alert to a case, you can only remove it through the Elastic Security Cases API.
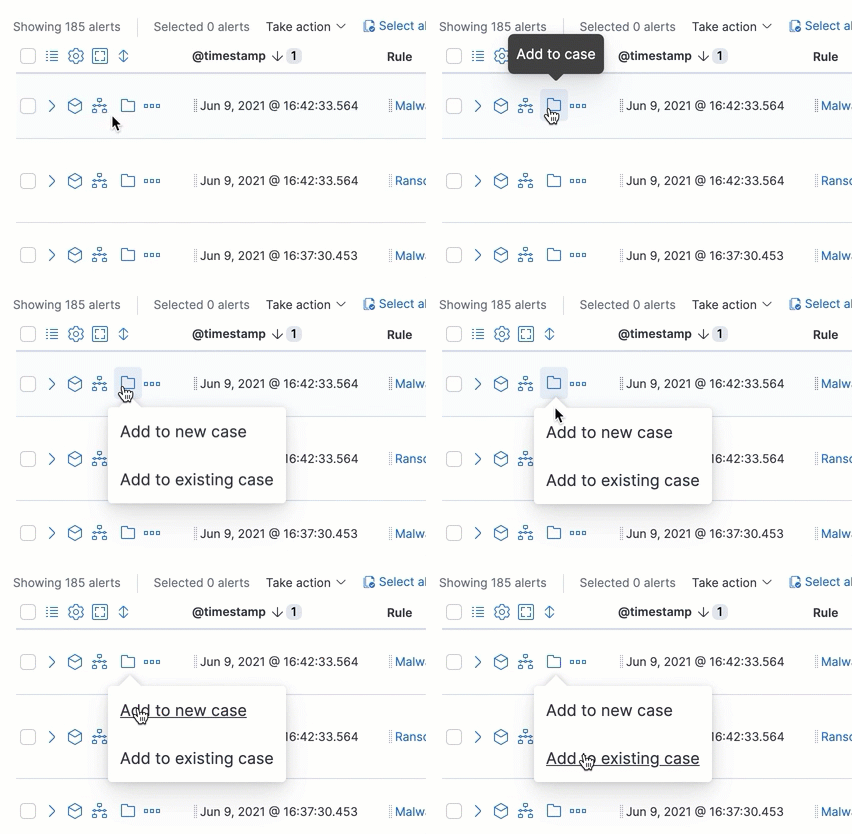
Add an alert to a new case
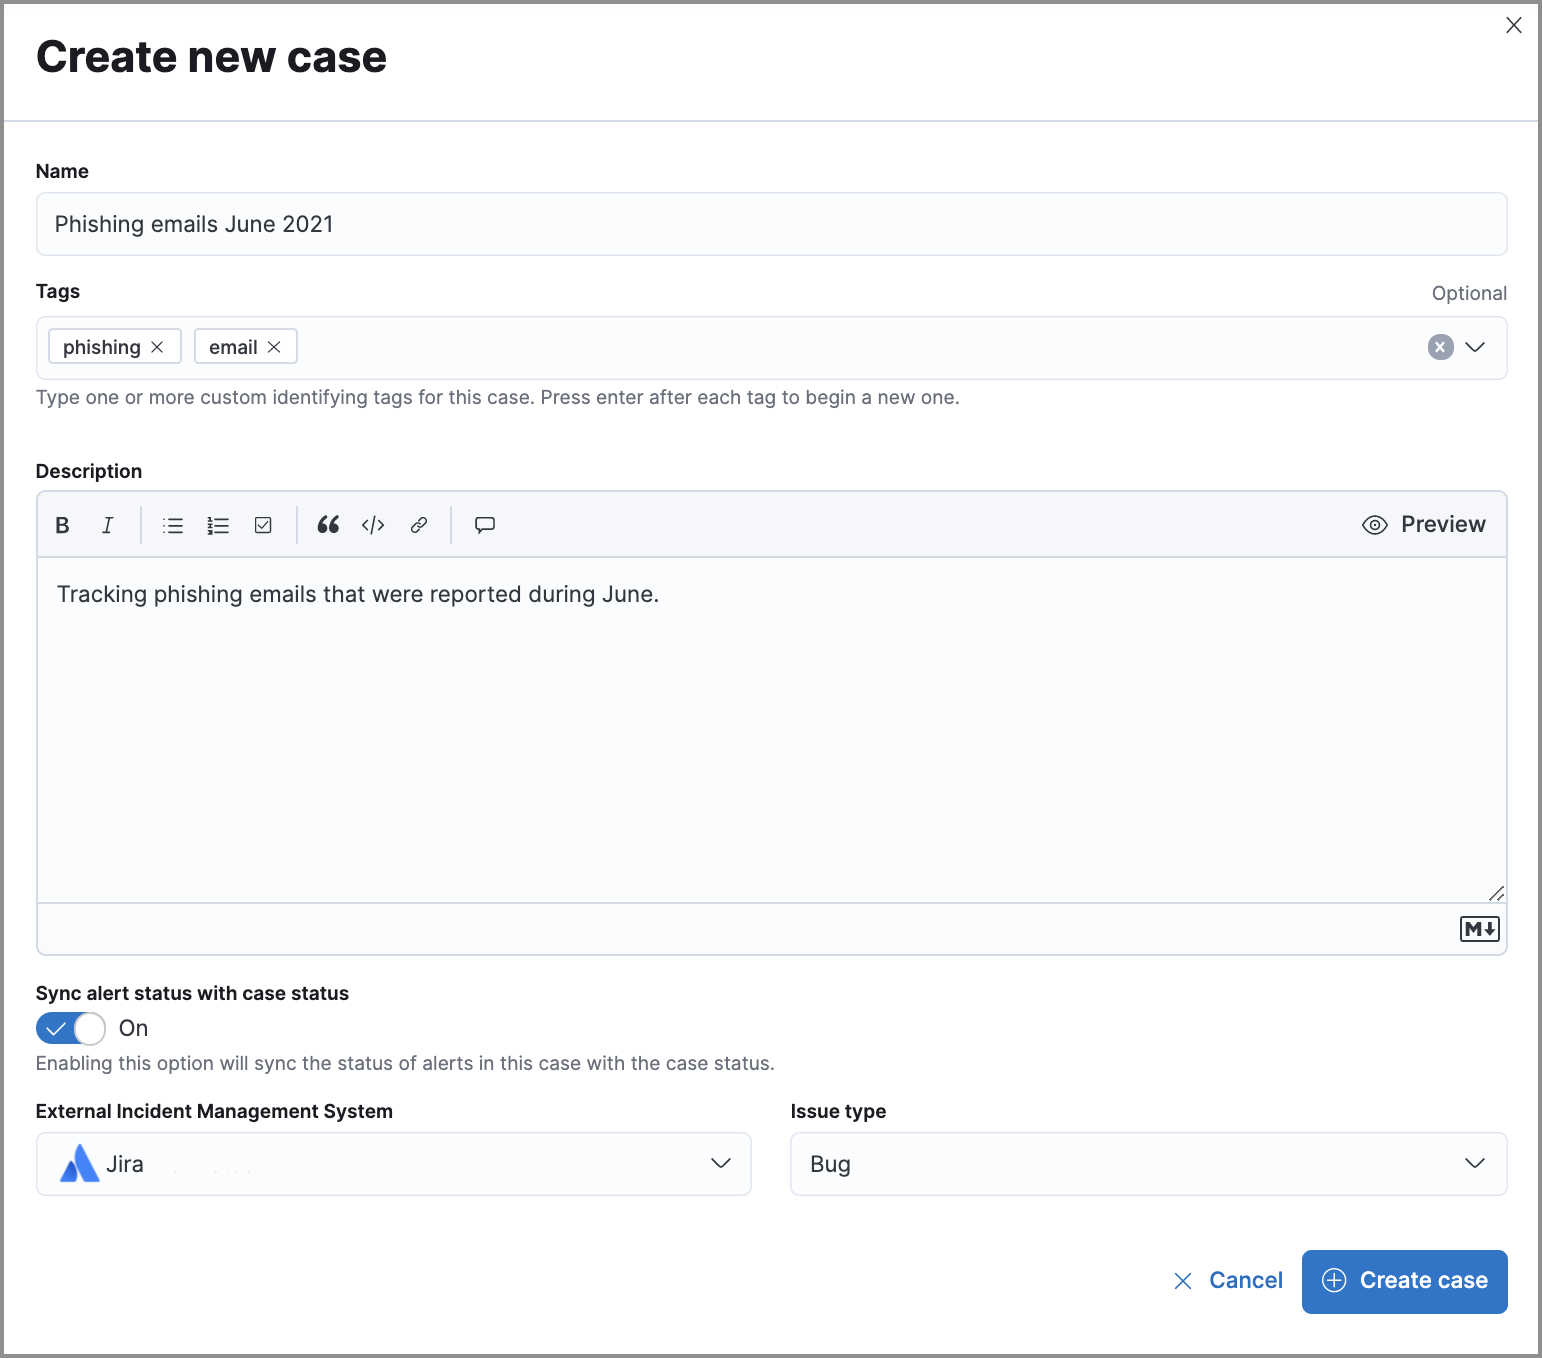
editTo add an alert to a new case:
- Select Add to case → Add to a new case.
- In the Create a new case pane, give your case a name, add relevant tags, and include a case description.
- Specify whether you want to sync the status of associated alerts. It is enabled by default; however, you can toggle this setting on or off at any time. If it remains enabled, the alert’s status updates whenever the case’s status is modified.
-
Select a connector. If you’ve previously added one, that connector displays as the default selection. Otherwise, the default setting is
No connector selected. - Click Create case after you’ve completed all of the required fields. A notification message that confirms the case was successfully created displays. Click the link inside the notification or go to the Cases page to view your case.
Add an alert to an existing case
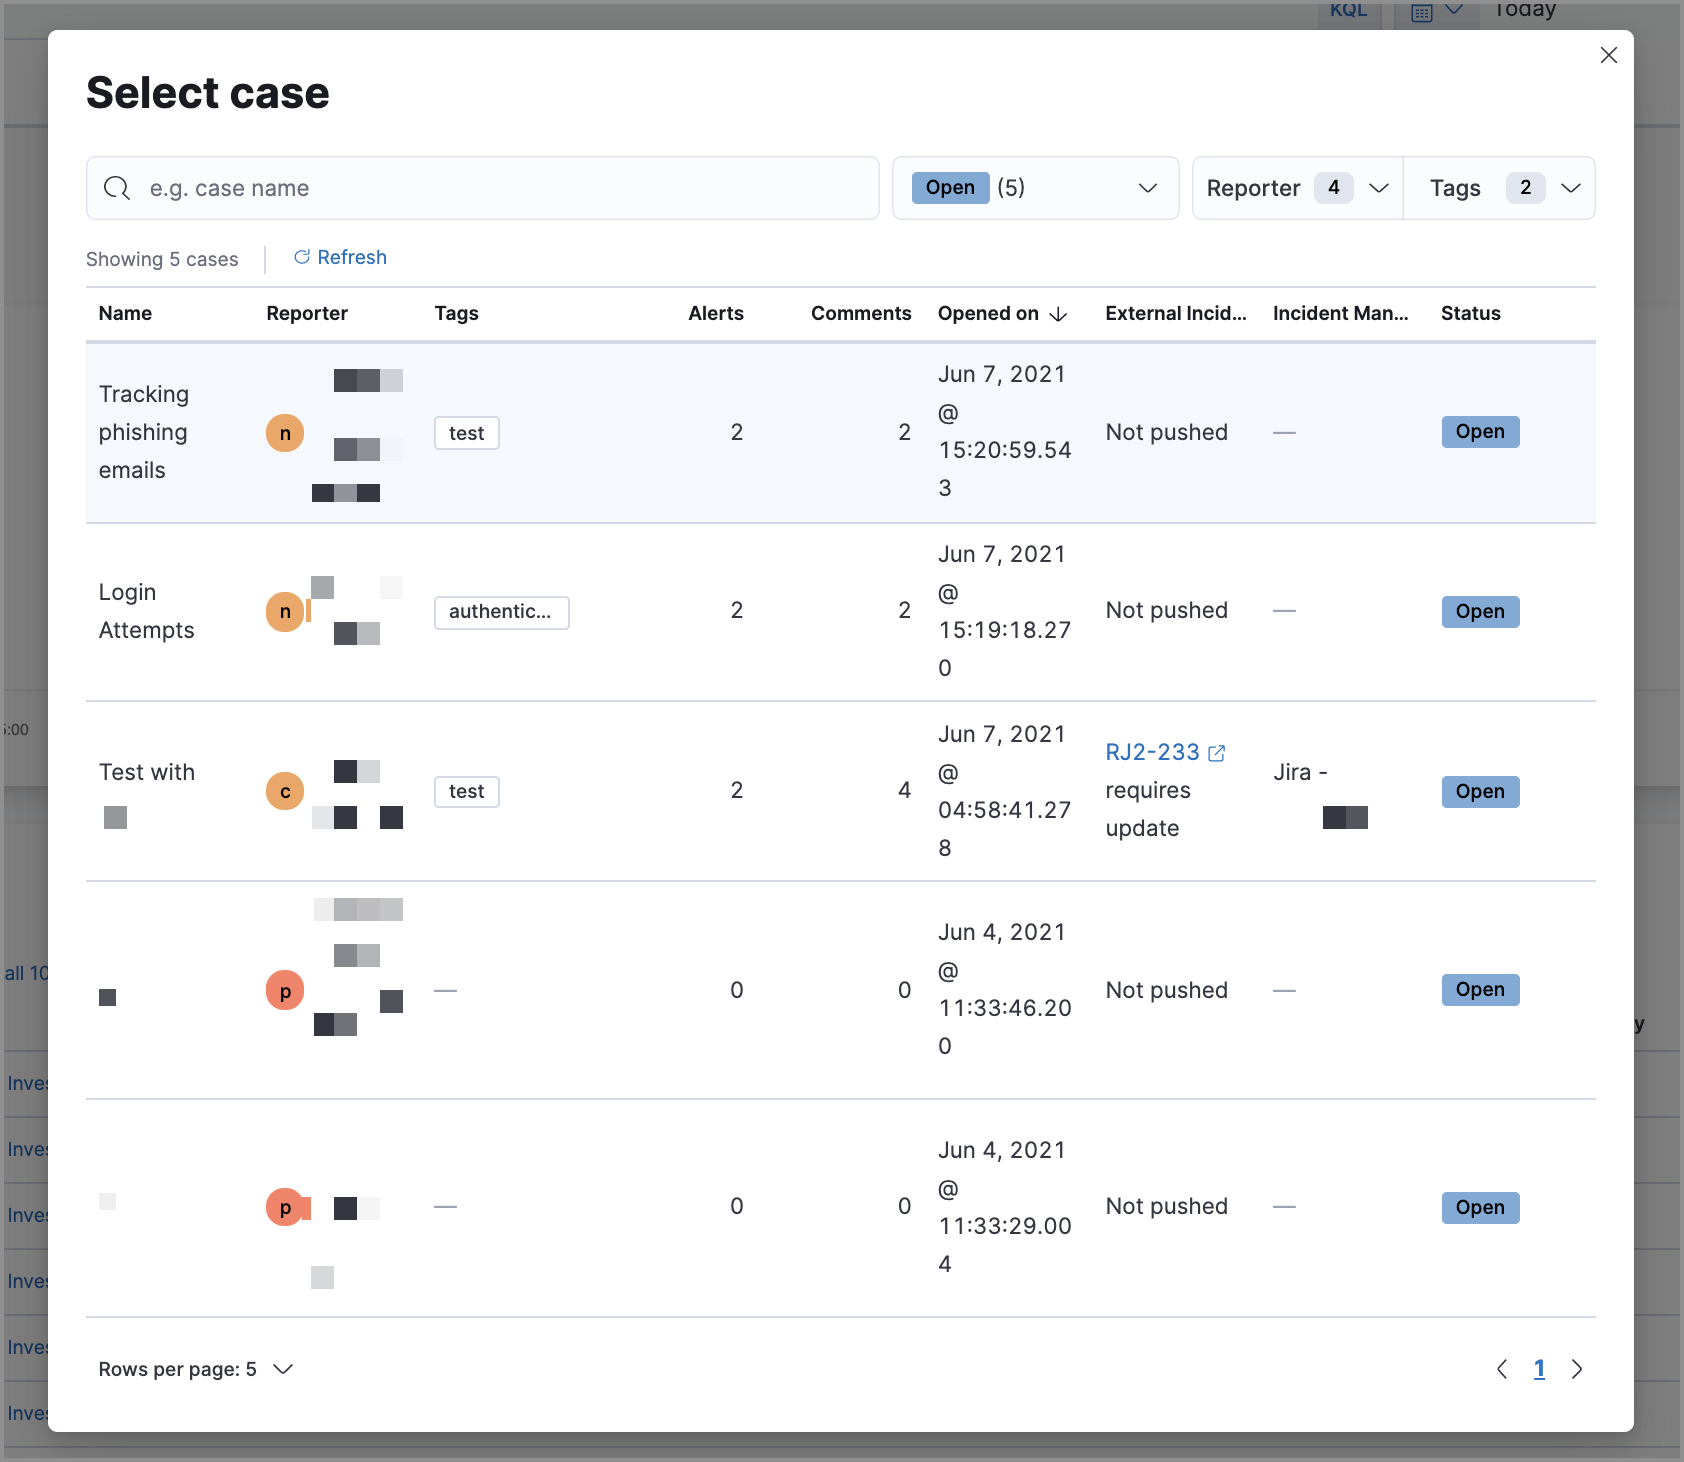
editTo attach an alert to an existing case:
- Select Add to case → Add to existing case.
- From the Select case pane, select the appropriate case for which to attach an alert. A confirmation message displays with an option to view the updated case. Click on the link in the notification or go to the Cases page to view the case’s details.
Send alerts to Timeline
editTo view an alert in Timeline, click the Investigate in timeline button.
When you send an alert generated by a threshold rule to Timeline, all matching events are listed in the Timeline, even ones that did not reach the threshold value. For example, if you have an alert generated by a threshold rule that detects 10 failed login attempts, when you send that alert to Timeline, all failed login attempts detected by the rule are listed.
Suppose the rule that generated the alert uses a Timeline template. In this case, when you investigate the alert in Timeline, the dropzone query values defined in the template are replaced with their corresponding alert values.
Example
This Timeline template uses the host.name: "{host.name}" dropzone filter in
the rule. When alerts generated by the rule are investigated in Timeline, the
{host.name} value is replaced with the alert’s host.name value. If the
alerts’s host.name value is Windows-ArsenalFC, the Timeline dropzone query
is host.name: "Windows-ArsenalFC".
See Investigate events in Timeline for information on creating Timelines and Timeline templates. For information on how to add Timeline templates to rules, see Create a detection rule.
Add rule exceptions
editYou can add exceptions to the rule that generated the alert directly from the Alerts table. Exceptions prevent a rule from generating alerts even when its criteria are met.
To add an exception, click the actions button (three dots) and then select Add exception.
For information about exceptions and how to use them, see Rule exceptions and value lists.
Visually analyze process relationships
editFor process events that are detected by Elastic Endpoint, you can open a visual mapping to view a hierarchal timeline of when these events occurred. For more information, see Visual event analyzer.
On this page