Log it like you mean it: Best practices for security
Not every log is equal


 Share on Twitter
Share on Twitter

 Share on LinkedIn
Share on LinkedIn

 Share on Facebook
Share on Facebook

 Share by Email
Share by Email

 Print this page
Print
As solutions architects at Elastic, we receive a lot of questions around how to fine-tune a security environment, such as:
What are the best practices for identifying security integrations in Elastic?
How can I ensure our settings cover our use cases and detect what we want?
How can we limit the ingest from a very chatty server without losing visibility?
The answer is often, "it depends." So, we’d like to explore the parameters behind these questions to provide you with a more comprehensive understanding of how they influence the response.
Use cases: Where to start
Getting your priorities straight
Step one is identifying and understanding the visibility requirements of your SOC and categorizing these requirements into Must haves and Nice to haves. This will guide you in identifying the necessary detection rules and the corresponding data sources and influencers. But how do you pinpoint those requirements?
A common way to start is identifying your current data sources and how they can be ingested. This could be achieved by going through each category of data source in order, identifying which integrations are available for each, and mapping them to different use cases to see which ones are most applicable to your environment.
An even better, more structured approach is identifying your current data sources and prioritizing them based on their importance to your organization. Ask yourself what data and assets have the highest value — these should have the highest visibility and protection. This usually involves some type of threat profiling: the process to identify and categorize potential threats to an organization's information systems. The main goals are to understand who might attack you, why they might do it, and how they are likely to proceed, given your information systems.
A good way to start your profiling journey is by answering questions, such as:
-
What type of organization are we?
-
Who could be interested in attacking us?
-
What assets would attackers be interested in?
-
How can they attack these assets?
Once these questions have been answered, you can turn your attention to new ones like, "What tools/assets have interesting logs/data?" and “What assets have critical IP (Intellectual Property)?” all with the goal of identifying relevant threat use cases. After that, you can finally find a way to map this to integrations that are available OOTB and identify which data sources would require custom integrations.
When working on the “valuable assets/data” question, it’s a good idea to document the result. Below is an example on how to map types of data to what's important to an organization. If operational data is the highest priority — which it probably is — start identifying categories of data related to operations and then the individual logs.
Here your Must haves and Nice to haves begin to emerge. What are your top five data sources linked to your most valuable assets (i.e., operational data)? Are you able to identify which data sources need additional information or enrichments? At the same time, it’s a good idea to start thinking about how you would prefer to be notified about issues for each of these and how severe a temporary loss of this data would be.
Here is an example of a starting point for priority mapping an organization:
| Priority | Data source type | Log | Assets to protect |
| Priority 0: Operational data | Endpoint, Network, Cloud, Security tools | Firewall Syslog, Windows endpoint system logs, Anomaly/(threat intel) | IP assets, Business critical applications, Customer data, Financial transactions |
| Priority 1: Management tools | Auth management, Tool management | AWS CloudTrail, Azure AD logs | Internal company assets, User accounts, API keys, Administrative access, Configuration files |
| Priority 2: Infrastructure tools | Applications, Databases, IT tools | Database logs, syslog | Servers, Databases, Network devices, Development environments |
| Priority 3: Other tools | Monitoring tools, Visualization tools |
This also provides you with an excellent start for documenting your visibility, to be more informed when reviewing it, as well as a building block for when you want to onboard new data sources in a structured way. This way you will know why you are onboarding a new data source as well as the value it brings, and you’ll have a proactive way of working instead of reactive.
What are your threat use cases?
A use case is a specific scenario or threat that an organization aims to detect and mitigate using security tools and strategies. It involves defining the rule logic and creating rules to identify patterns and indicators of compromise related to threats — for example, lateral movement, compromised credentials, or data exfiltration. These use cases guide the development of detection mechanisms to enhance your organization's security stance. You want to transform business threats into SIEM detection rules, which then detect possible threats and generate alerts.
Use cases can also combine two or more other use cases, along with their respective rules, potentially incorporating additional logic. For example, data exfiltration threat use cases can consist of rules of a malware detection use case and a lateral movement use case. It's key to see use cases as interconnected pieces that can be combined to build out full attack chains. It's also essential to consider what data sources are in play to reveal the next steps. For example, after credentials are compromised, logs from network traffic or user activity can show further malicious actions.
A good use case must also describe the response and mitigation workflow and step-by-step actions for security teams to follow when certain alerts or events are detected. Elastic simplifies this part by including investigation guides for many of the prebuilt rules that come with Elastic, with more to come. These guides help with investigation, containment, eradication, and recovery steps once detection rules fire alerts.
A best practice is to attach a priority to these use cases in terms of the potential impact they could cause. This helps the SOC team set relevant alert levels and focus on critical issues first.
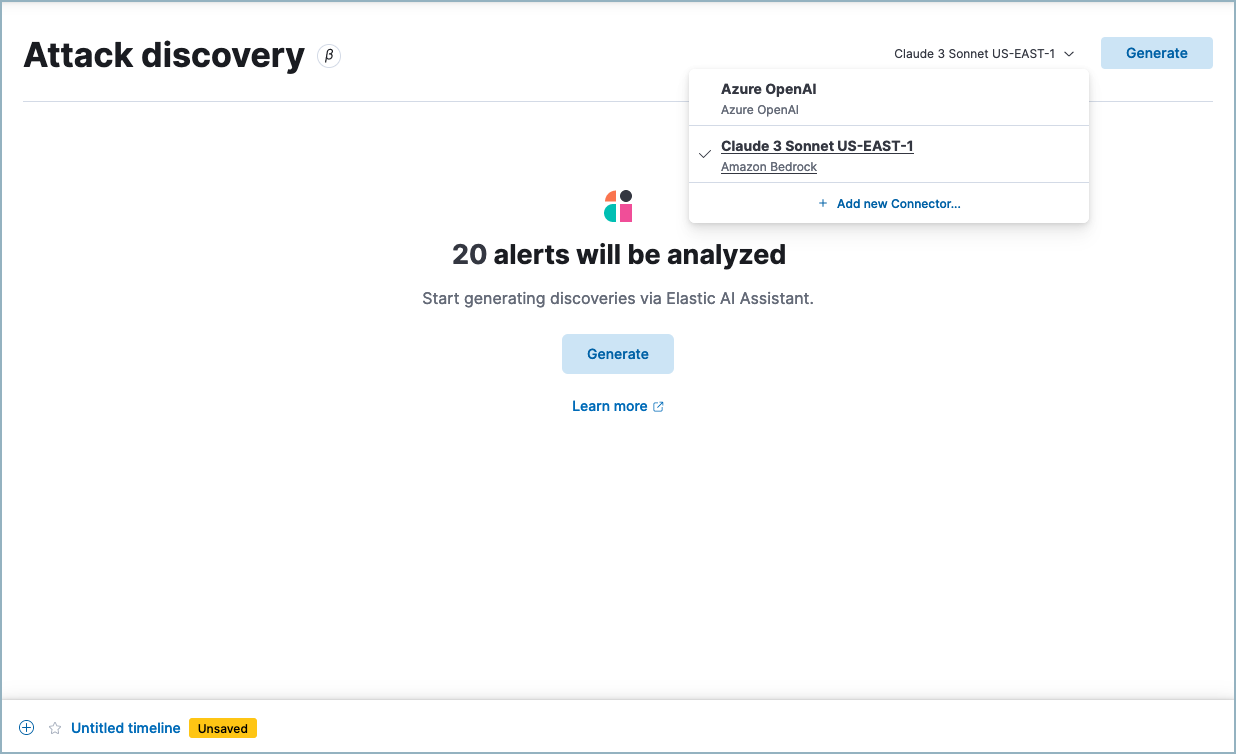
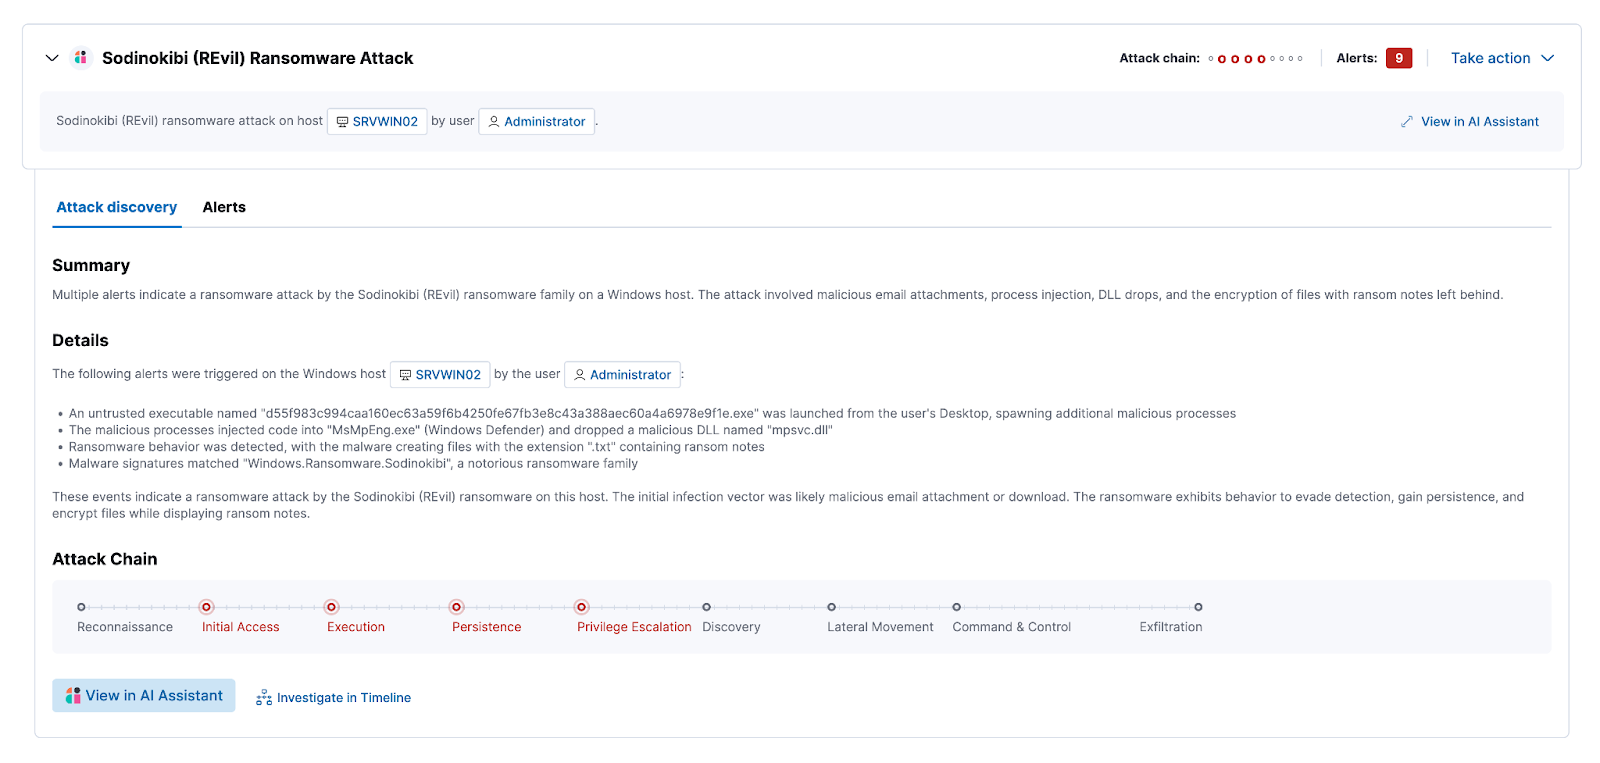
To help the SOC teams with highlighting complex alert patterns, we released the new Attack Discovery feature in 8.14. Attack Discovery enhances the ability to detect and understand attack patterns related to specific threats like lateral movement, compromised credentials, or data exfiltration. By transforming isolated alerts into cohesive narratives, it reveals underlying coordinated attacks, providing security analysts with actionable intelligence to address these threats swiftly and accurately, thereby improving overall response times and effectiveness.
Again, documentation is your friend. Keeping it structured, and possibly applying version control as well, will give you visibility into answering questions like “why weren’t we able to detect this months ago?” The reply might be that you simply didn’t collect the data or had yet to define a use case with a detection and alert, and you are able to show exactly when that visibility changed. We also highly recommend reviewing and becoming familiar with the list of prebuilt detection rules provided out-of-the-box to speed up your onboarding and let you focus on developing the detection rules that will be custom for your organization.
What about MITRE ATT&CK?
If you’re familiar with security threat frameworks, you’re probably thinking this sounds an awful lot like the MITRE ATT&CK™ framework. This is by no means a coincidence.
The MITRE ATT&CK™ framework is a knowledge base detailing adversary tactics and techniques, along with the data components needed to detect these attacks. Many of our prebuilt detection rules are linked to these tactics and techniques, and it’s a best practice to link to the framework when building your own detection rules. When you are investigating or threat hunting, it’s an incredible asset for not only identifying but mitigating the attacks.
By mapping your security use cases to specific tactics, you can easily identify the required data sources by referencing the specific technique in the framework. This simplifies the task of pinpointing the necessary signals for detections. Under data sources, you can go the other way about it and see the visibility each data source provides. In this example, we’re taking a look at Active Directory:
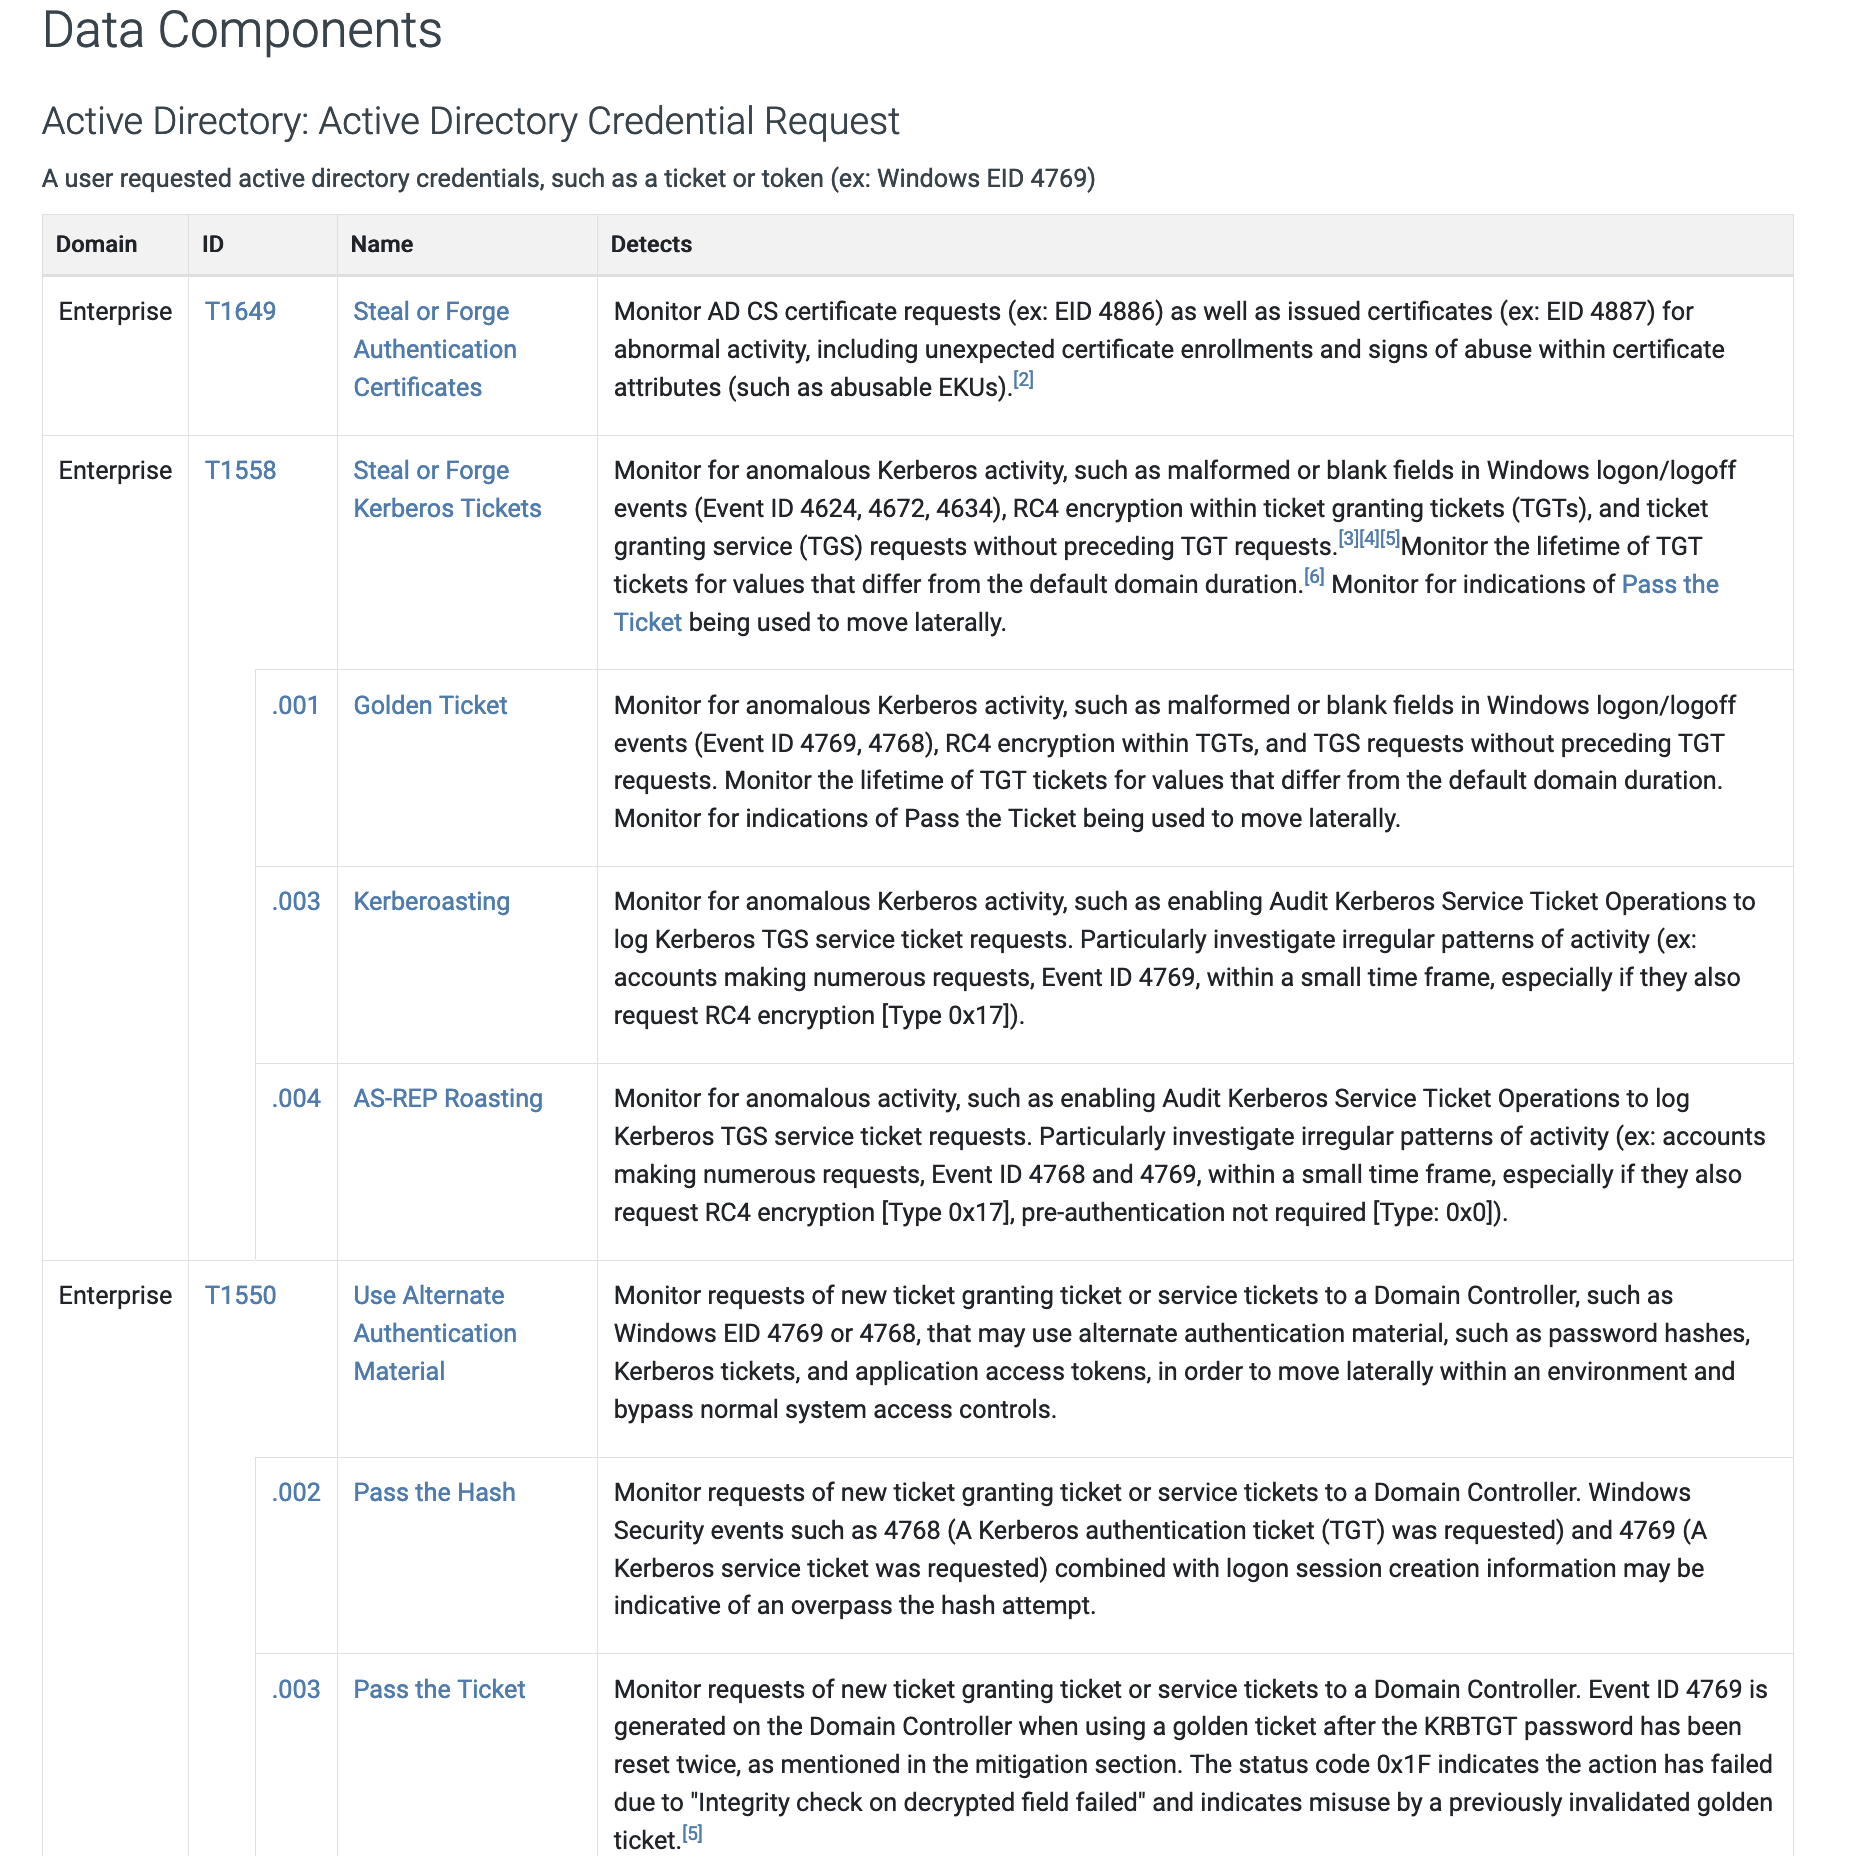
You can clearly see the use cases and tactics where AD logs are a requirement and the visibility that data source provides.
The MITRE ATT&CK™ knowledge base helps to define business threats, such as phishing and data extraction. When using Elastic Security, it is highly recommended to get familiar with MITRE ATT&CK and go through the list of attacks and tactics to identify which ones are relevant for your organization. By the end, you should have a map showing the relation between business risks and attacks. We suggest also including a list of tags and the indices where the data will be located in Elastic for easier and faster threat hunting.
This mapping work could, for example, look something like this:
| Use case | Severity | Description | Framework | Tactic | Index | Data sources |
| Execution of file written or modified by PDF reader | High | Identifies a suspicious file that was written by a PDF reader application and subsequently executed; these processes are often launched via exploitation of PDF applications | MITRE ATT&CK | {'id': 'TA0002', 'name': 'Execution', 'reference': 'https://attack.mitre.org/tactics/TA0002/'} | ['logs-endpoint.events.*', 'winlogbeat-*', 'logs-windows.*'] | ['endpoint'] Once you have ingested your data sources properly into Elastic and enabled relevant detection rules, your current MITRE ATT&CK™ coverage can easily be viewed in Kibana. Elastic Security simplifies how you can track your detection rule coverage. Here is an example of how the coverage will look: |
A word of caution: This will never be a complete list of your required detections! Make sure to also include other non-MITRE ATT&CK use cases and work on identifying their respective signals as well. Other use cases might be ones that are described in compliance standards or in other threat frameworks, or they can be fully custom made to meet specific threat detection requirements.
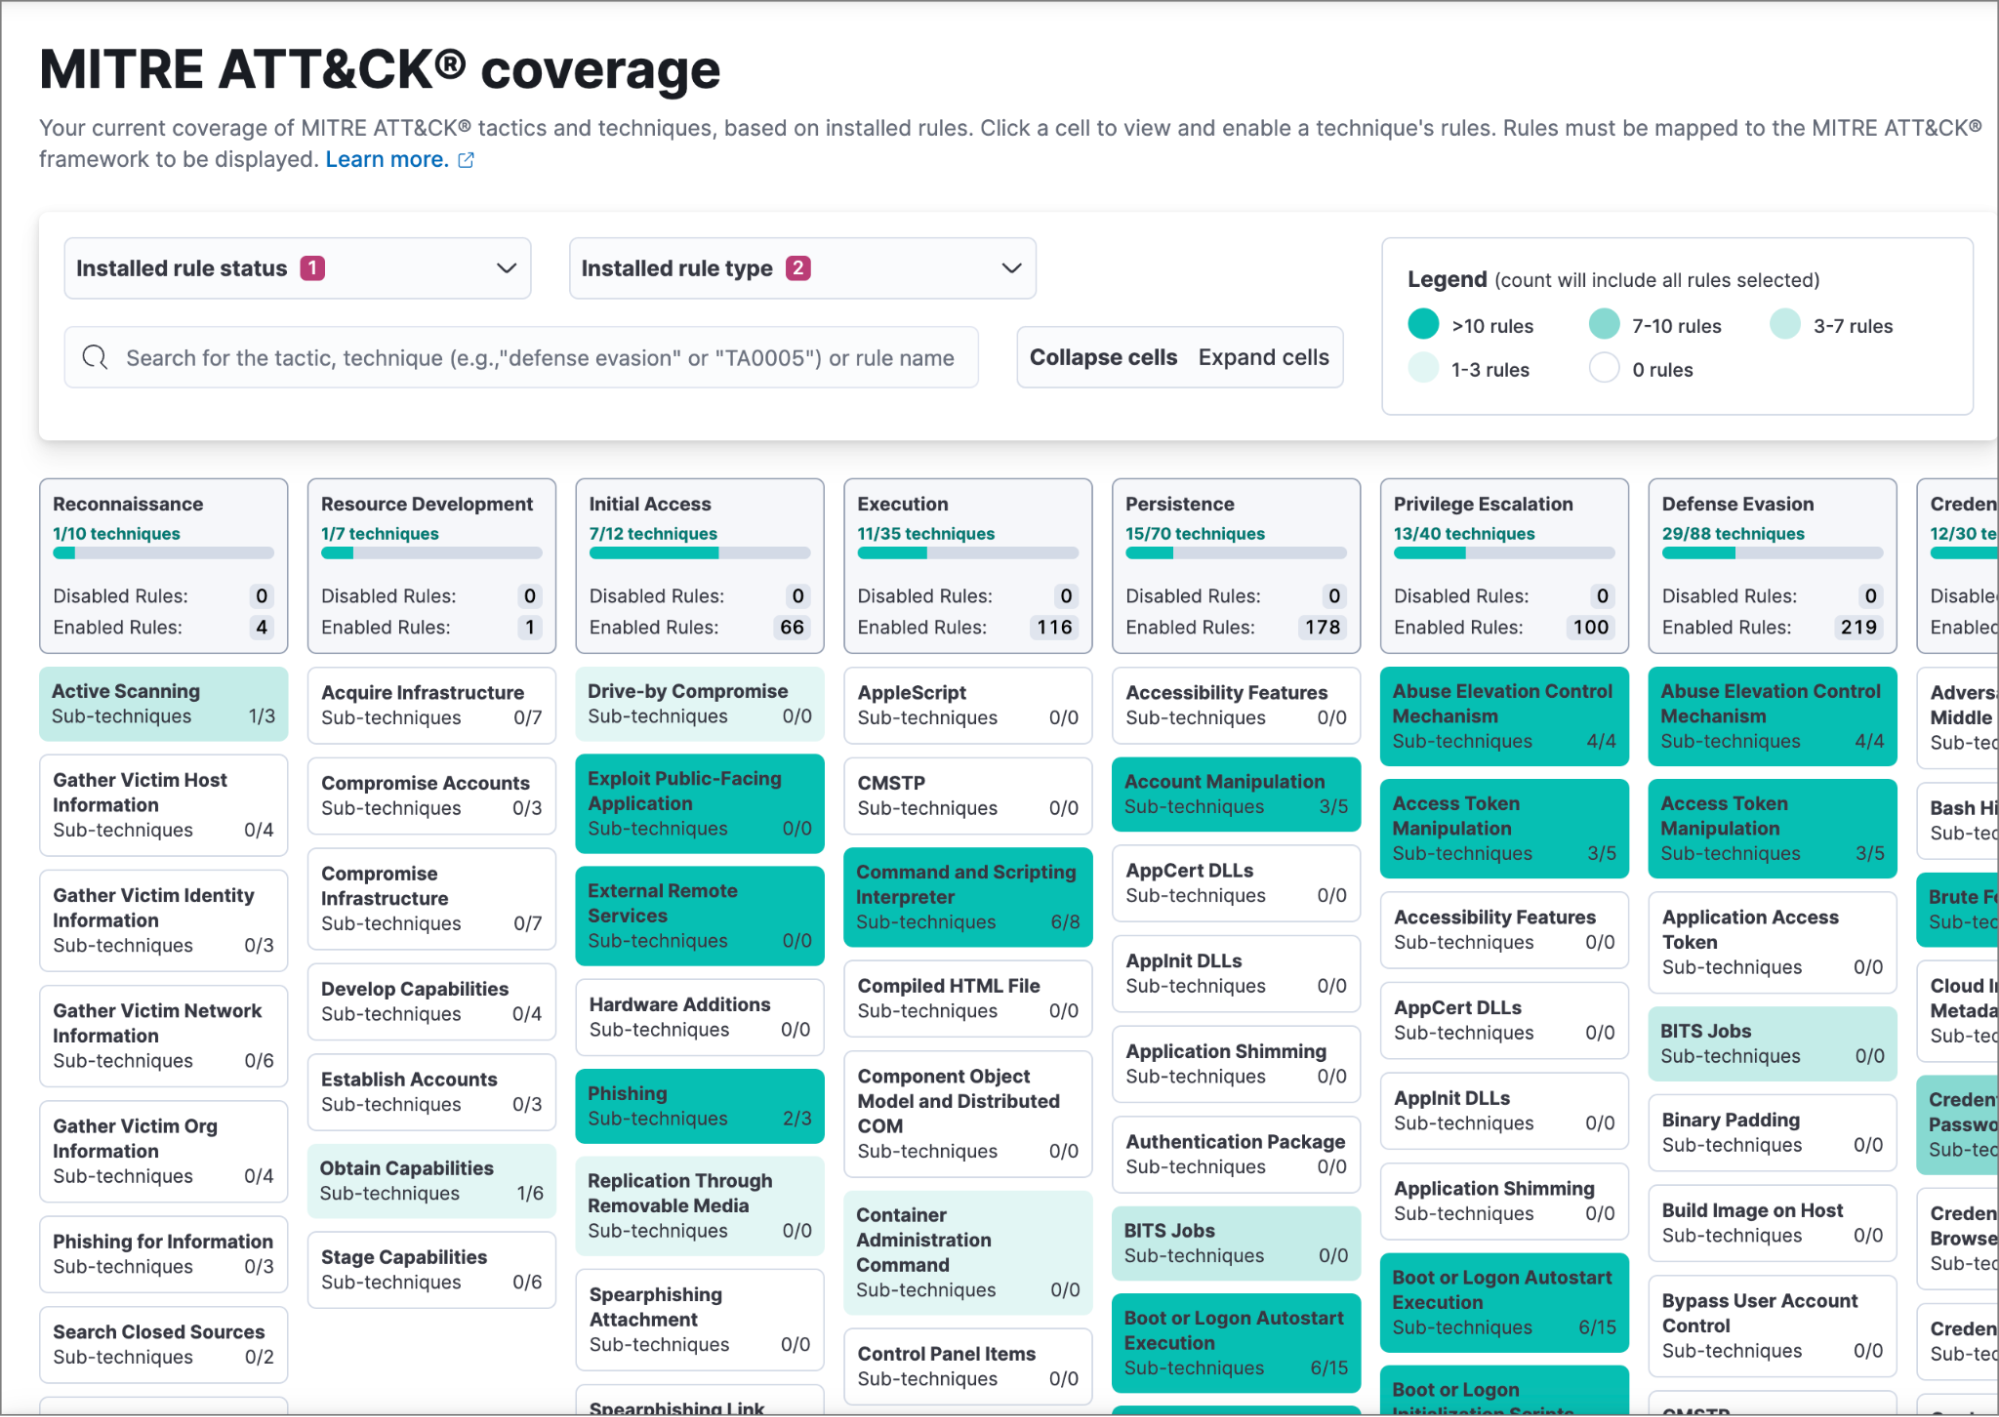
Once you have ingested your data sources properly into Elastic and enabled relevant detection rules, your current MITRE ATT&CK™ coverage can easily be viewed in Kibana. Elastic Security simplifies how you can track your detection rule coverage. Here is an example of how the coverage will look:
The Elastic detection rules explorer
To simplify mapping use cases to data sources in Elastic Security, we built a web-based tool called the detection rules explorer. This tool allows Elastic Security users to easily identify the data sources and integrations required for each out-of-the-box detection that may be top of mind as they think through their use case requirements. The detection rule explorer also helps you understand the specific data fields and types that your detection rules require.
Maximize your insights: Ingestion strategies
Once you have a clear understanding of what data sources you need to collect and you’ve done the above work on mapping them to use cases, your work on how to best ingest the data begins.
In addition to knowing your data sources, it is also crucial to know your environment. Some data sources, such as Windows and Linux operating systems, will have audit and other event logging enabled by default while others don’t. Therefore, you will still need to ensure that the logging or audit levels on the endpoints you want to observe are to the expected level for your use cases before you can start collecting the data.
In the case of Windows, for example, you need to ascertain which of the myriad of Windows event codes need to be collected for each use case. Ultimately filtering out the "irrelevant" event codes is what makes the 50%+ difference in collection volume. The same principle applies to audit and logging policies configured for other data sources in your environment. You want to have a balance between log volume and detection coverage value.
Keeping it organized
Best practice for ingesting data into Elasticsearch is to use the simplest option that meets your needs and satisfies your use case.
The Ingest Reference Architecture is a good place to read more on different paths to achieve this for different environments at a high level, and you can reference the integration documentation for details on specific data sources. Using the integrations will also help you to normalize the data OOTB to Elastic Common Schema, which is the secret sauce to unlocking even more of Elastic Security.
For most users, the recommended method for ingesting data today is through Elastic Agent. With Elastic Agent you can collect all forms of data from anywhere with a single unified agent per host. One thing to install, configure, and scale. In addition, many of our newer integrations are agent-specific. For example, the Elastic Defend integration requires Elastic Agent, and there is no Beats equivalent. So, for new Elastic deployments, we assume the majority of data sources will be ingested through Elastic Agent.
At the core, much of the work will be done managing and configuring so called policies. In simple terms, a policy is a collection of integrations and settings that specify the data to be collected by an Elastic Agent. Since many Elastic Agents can subscribe to the same policy, this enables you to scale better and manage your data collection easily, as well as quickly have visibility into what data is collected at what asset in your organization.For example, you can define a specific policy for your Windows desktops, one for your Linux servers, and so on.
Coming back to the documentation of your use cases for threat detection, with a good policy strategy, it’s quick to verify that you are indeed collecting the data required for your security visibility or whether you need to add an integration. This strategy is typically about grouping similar assets with the same priority/value together under one policy. By mapping your critical assets, documenting your use cases, and regularly revisiting your strategies, you can enhance your organization’s security posture.
Data processing
One of Elastic's strengths is its ability to process data in countless ways, enabling you to address any security use case effectively and seamlessly. This versatility, combined with the ease of its pre-built integrations, is a key enabler for maintaining usable, actionable logs that drive your security operations. When processing data, there are a few considerations to keep in mind:
Mapping: Why schema matters
When it comes to security logging, having a consistent and well-structured data format is crucial for effective analysis and response. That’s where the Elastic Common Schema (ECS) comes in. With ECS, you don’t need to worry about the original source format or specific field names. This makes it much easier to search and write new detection rules and alerts, as well as streamline your threat detection process.
Since ECS standardizes the way data from various sources is organized, it is a key enabler for you to leverage Elastic Security features like out-of-the-box detection rules, dashboards, and machine learning jobs. This speeds up threat investigations and lowers the learning curve for new members of your SOC. Seeing how important this is, Elastic provides different ways to help you maximize your ECS usage:
Out-of-the-box integrations: Elastic provides a variety of OOTB integrations that automatically apply ECS to common log formats. These integrations simplify data ingestion and often come with pre-built dashboards and other assets, giving you instant insights and faster security results. No need to worry about parsing or normalizing the fields in your data!
Custom integrations: Sometimes, pre-built integrations might not cover all your needs. In those cases, creating custom integrations and pipelines to enrich and transform your log data is the way to go. You can add additional fields, normalize data, or apply advanced processing techniques like geoIP lookup or user-agent parsing. Custom integrations ensure you can make the most of all your log data within Elastic Security. You don’t have to guess if it’s been done correctly either — the Data Quality dashboard helps you identify if your data is accurately mapped to ECS.
Extensible schema: ECS is extensible, allowing you to add fields unique to your organization. This flexibility ensures that ECS can adapt to your specific needs, making it easier to incorporate custom data and maintain a consistent schema across all your logs.
Please also refer to the complete list of required and optional ECS fields for Elastic Security when working on your data onboarding. Master ECS, and you master your data.
Adding context
Security teams tend to want data insights that are actionable. This is where context and data enrichment can help. Context here refers to the additional information or insights that help security teams better understand and analyze security events. Data enrichment involves adding this contextual information to raw security data to make it more meaningful and actionable. An example of this is adding user information from directories like Active Directory to provide context about the user involved in an event, such as department, role, and access rights.
Adding context to a tool, such as Elastic, ensures efficient threat detection and investigation workflows, allowing organizations to defend against threats more effectively and efficiently. Some of this enrichment context may include:
Geolocation data User and entity context
Asset information
Threat intel
Application context
Network context
Enriching raw security data with this additional context helps security analysts understand the nature of an event more comprehensively. This context is essential for accurately assessing the severity and potential impact of a security incident, ultimately proving valuable for addressing challenges encountered by security teams such as alert fatigue and false positives, among others.
Efficient storage: So what about retention?
If you have ever discussed cluster architecture and sizing with an Elastician, one of those “it depends” questions might have likely been about your retention. Similar to where we started, the primary step is to distinguish between data retention that is nice to have and data that is essential for compliance/legal requirements. After creating an inventory list with defined requirements, it’s best practice to implement data tiering strategies to store data cost-effectively while maximizing value. Ask yourself: how long do we actually need that data, and do we know why?
When you have those answers, Elastic's index lifecycle management (ILM) provides the flexibility to set varying data tiering strategies for each source. For instance, a data source that generates 500GB per day but only queried once a week could be moved to more cost-effective tiers to maximize value and minimize cost per query.
Data tiering
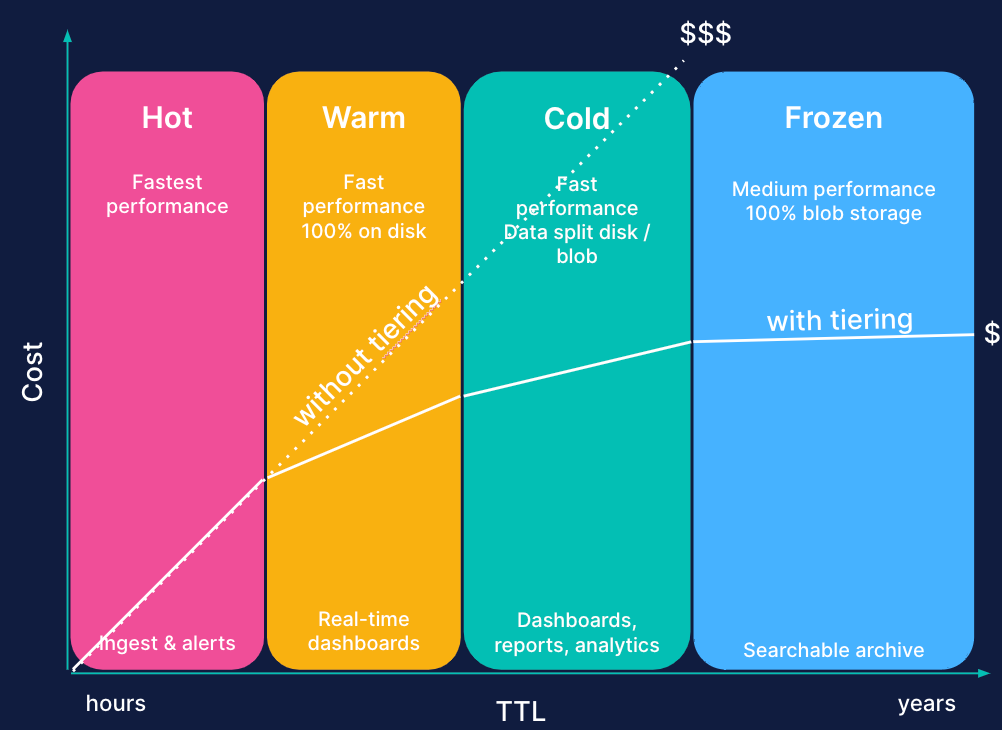
Elastic offers four data tiers: hot, warm, cold, and frozen. Don't let the terminologies of the cold and frozen tiers mislead you into thinking they're slow. Query results from the frozen tier can be expected between a few minutes and tens of seconds. It's usually just long enough for an analyst or threat investigator to make a cup of tea and return to their workstation.
Instead, think about the tiers in terms of use case: ingest, search, and store.
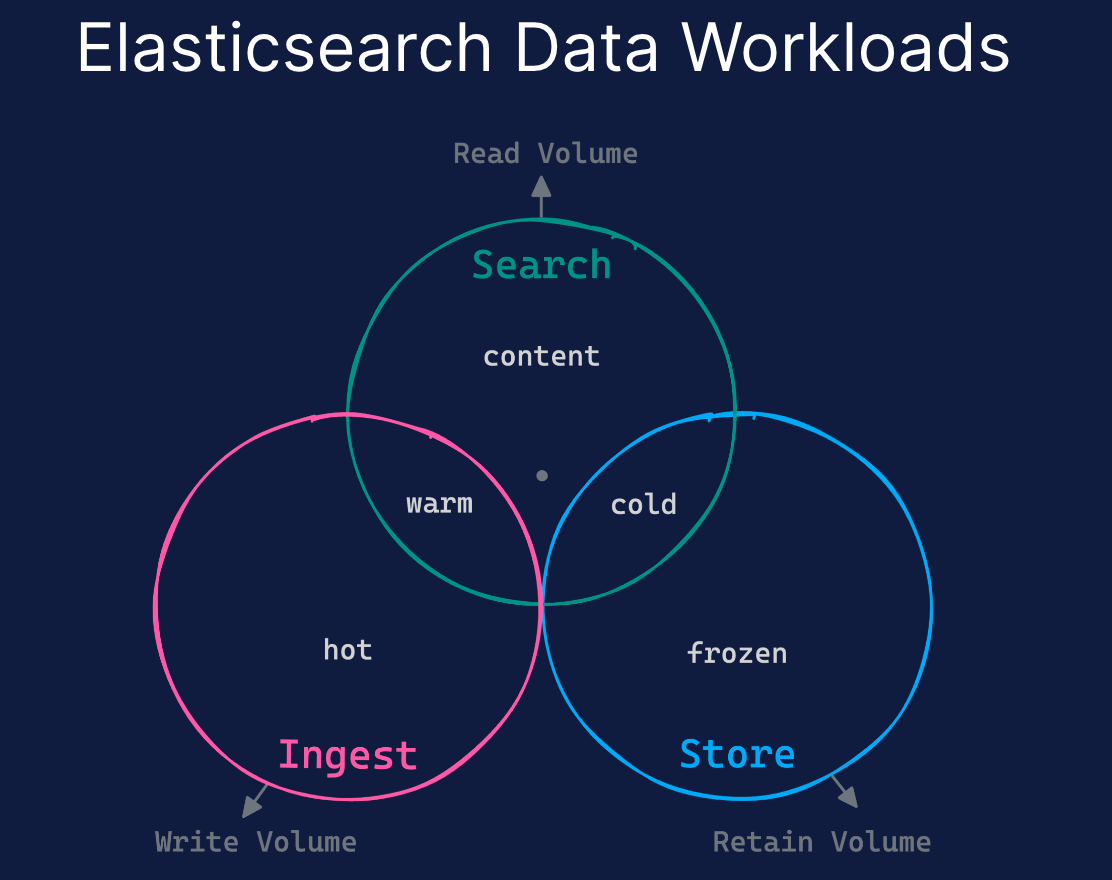
We generally recommend storing new data in the Ingest (Hot tier) for just 1–2 days for detection processes. Once the detection phase concludes and the data is prepared for investigation, we advise transitioning it to a colder storage tier (Warm, Cold, or Frozen).
The signal to noise ratio is an essential consideration in any tiering strategy, as it helps assess the value and cost efficiency of each data source. Take firewall data, for instance, which is high in volume but contains few significant events. If 100GB of this data costs $100 and yields one valuable alert, the cost per alert equates to $100.
Data tiering can address this, balancing cost of retention against value — this value being detection and regulatory compliance value. It potentially reduces costs by 30%–80%, subject to the ILM strategy employed. This means that for the same volume and retention of data, the cost per alert could be halved or even further reduced.
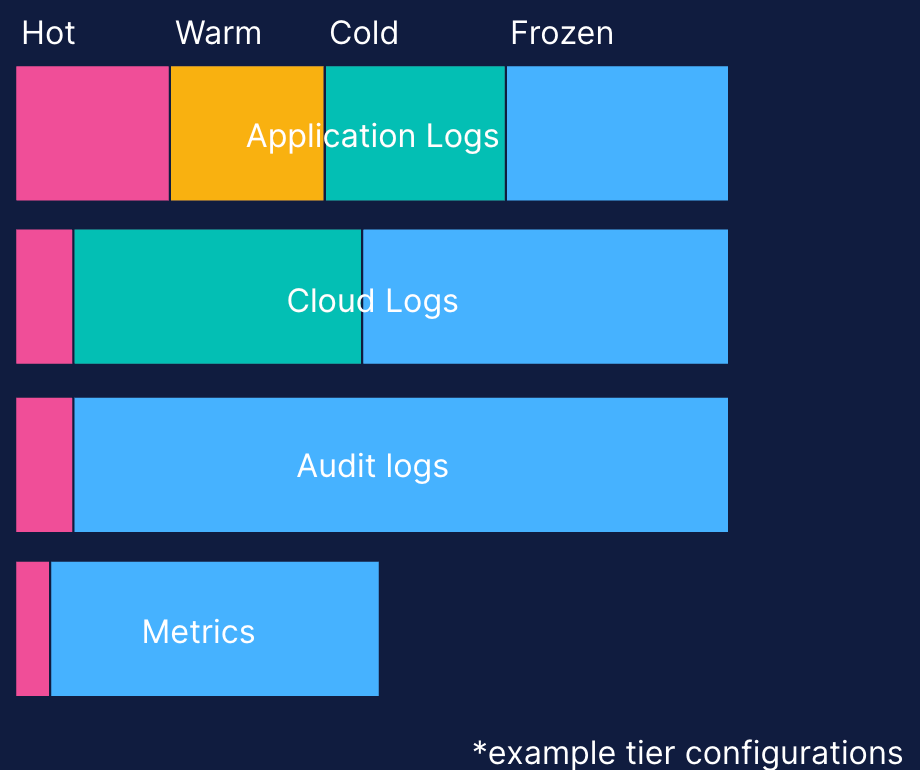
Data tiers offer flexibility in combination, allowing you to utilize diverse strategies for each data source.
For instance, consider this sample approach:
For Firewall Logs, they can be kept Hot for two days, Cold for 12 days, and Frozen for 76 days, culminating in a 90-day cycle.
Audit logs can follow a different pattern, remaining Hot for a single day and then Frozen for the subsequent two years.
Keeping these logs Hot for two days aids in quickly identifying these “signals” to “noise.” As the data's immediate relevance decreases over time, it transitions to Cold and then Frozen states, optimizing storage and maintaining system performance.
It's still advisable to maintain a manageable number of index lifecycle policies by grouping multiple sources and categories under different policies.
An effective method to gauge retention is through actual usage measurement rather than estimations. The adaptability of ILM enables you to initiate a specific strategy, evaluate its performance, and recalibrate as necessary. The pursuit of data sources in SIEMs are perpetual, so it's critical to consistently assess strategies to ensure they align with both your needs and budget.
This flexibility proves beneficial when needing to change retention or ingest more data while managing costs. For instance, if the daily ingestion of firewall logs is expected to double from 100GB, it doesn't mean the cost needs to double with it. The policies can be adjusted accordingly, like Hot for two days, Cold for five days, and Frozen for 83 days, keeping costs manageable.
Lastly, not all data needs to be continuously searchable. In forensic investigations, for instance, backups and data restores are typically relied upon. Yet, restoring large amounts of data to a cluster can be time-consuming. The Frozen tier uniquely addresses this issue by leveraging snapshots for search, using them as a data source that eliminates the need for complete data restoration or transfer. By using searchable snapshots stored on cheap object storage, a simple API command can remount a snapshot for instant searchability. This rapid access to backup data during an incident or forensic investigation can drastically cut down on triage time.
If you are in a pinch for more storage, refer to your list of Must haves and Nice to haves when deciding on what data has higher prioritization.
Operationalizing everything
Probably the most common pitfall we see is forgetting about the operational aspect of data collection. This is easy to solve, however, by planning ahead and following a few best practices.
Engage data source custodians
Who are the system owners and custodians of the data, and are they aware of the SOC team’s plans and requirements? Security is a team effort that should involve stakeholders within and beyond the security team. Early engagement of stakeholders in the security logging journey ensures they are made aware of the objectives and why they are needed as part of the process. This is especially important if the data collection process might have an operations impact on the service. It also helps with prioritization on the end of the stakeholders. Examples of stakeholders may include system and network administrators, developers, and other security teams external to the SOC team.
Continuous reevaluation
The most important step in making sure your organization stays secure is to have a schedule where you revisit most, if not all, of your use cases and priorities. This is why documentation is so important. Make sure to not set it once and forget it. Schedule these reevaluation sessions on regular intervals that make sense for you — once a month, quarterly, or every six months for example. The threat landscape is continuously changing, so the threat profiling process mentioned earlier must be dynamic and continuous; your use cases should be too.
To help in these sessions, Elastic Security can step in and assist as an extra resource for your security team. The Elastic TRaDE (Threat Research and Detection Engineering) team performs research on emerging and commodity threats, developing and maintaining detection and prevention rules for our users. The team also provides feedback for improving the various query languages used to support security use cases. The TRaDE team works closely with our internal InfoSec team, as well as various other engineering teams, ensuring the integration of feedback for consistent improvements. You can follow their research and publications at Elastic Security Labs.
Monitor actual data usage and rule performance
First deployments always have a “best guess” approach to data tiering requirements, but nothing beats actual data. Keep track of the actual usage of data you collect, and update your ILM policies accordingly. Don’t be afraid to question the old requirements of availability, and be humble if your own assumptions turn out to be incorrect. This will also give you visibility into what data sources are truly valuable and help tune performance for end users.
Additionally, the execution of detection rules will consume Kibana resources. Elastic allows you to have granular Kibana monitoring and other cluster monitoring capabilities. For Kibana monitoring, you will get CPU, memory, and other Kibana metrics, and you can map those to detection rule execution resource consumption. Elastic also has an out-of-the-box detection rule monitoring dashboard that provides visualizations to help you monitor the overall health and performance of the rules. This dashboard provides a high-level view of whether your rules are running successfully and how long they’re taking to run, search data, and create alerts.
The principles above also apply to machine learning (ML) nodes on which ML detection jobs run.
Detections and alerting
Building robust processes around detections and alerts is crucial for maximizing the value derived from log data in a mature SOC. By developing structured approaches, organizations can ensure that collected logs are effectively analyzed, correlated, and acted upon to detect and mitigate potential threats, enhancing their overall security posture and incident response capabilities.
Detection as Code
Adopting Detections as Code (DaC) is a best practice that fosters security team maturity through the development of robust, repeatable processes and the maintenance of high-quality detections. As the number of security rules continues to grow, DaC provides a scalable solution for managing ever-expanding rule sets effectively.
To support DaC practices, Elastic is exposing DaC features in our open detection-rules repository. This functionality allows security teams to manage and maintain detection rules more efficiently, syncing updates with Elastic Security and leveraging a version control system. It also provides options for executing Red Team Automation tasks to test and validate detection rules.
Alert tuning
When you first roll out new detection rules, you're likely to face a flood of alerts and false positives, which can quickly lead to alert fatigue and potentially missed threats. While this might seem daunting, it's an opportunity to add context and filter out the noise. False positive tuning involves managing exceptions through techniques like whitelisting, blacklisting, and fine-tuning rule parameters. Additionally, suppression can be an effective method for quickly reducing noise from overly chatty alert sources or particularly noisy rules, improving the overall signal-to-noise ratio. By proactively addressing false positives, your security team can refine the detection rules, reducing alert fatigue and ensuring that the alerts you receive are accurate and actionable.
Again, refer to your list of Must haves and Nice to haves to first focus on what’s most important when filtering out the noise.
Conclusion
Implementing effective logging practices for security requires a well-structured and documented approach. This blog has given suggestions on approaches to take when deciding what data to collect for security logging and analytics purposes. Here are the three main takeaways from our discussion:
Prioritize and categorize visibility requirements: Start by identifying your SOC’s visibility requirements established through the threat profiling process, and categorize them into Must haves and Nice to haves. This helps in determining the essential detection rules and corresponding data sources needed for optimal security coverage.
Leverage prebuilt detection rules and frameworks: Make use of Elastic’s prebuilt detection rules and familiarize yourself with security frameworks like MITRE ATT&CK™. This will streamline your threat detection process and ensure comprehensive coverage of potential attack vectors.
Continuous reevaluation and documentation: Maintain thorough documentation of your security strategies and continuously reevaluate your use cases, data retention, and ingestion policies based on actual usage and evolving requirements. This will be an iterative process, as the threat landscape is continuously evolving as well as your IT estate. It also allows you to reevaluate your detection rules over time for rule efficacy and fine tune these to reduce over-alerting and false positives. Keeping a proactive approach ensures that your security posture remains robust and cost-effective over time.
By following these steps, you can enhance your organization’s overall security posture, ensuring that you have the necessary visibility and detection capabilities to address emerging threats effectively.
Learn how to accelerate your SOC with AI-driven security analytics.
The release and timing of any features or functionality described in this post remain at Elastic's sole discretion. Any features or functionality not currently available may not be delivered on time or at all.
Share
- Share on Twitter
Share on Twitter
- Share on LinkedIn
Share on LinkedIn
- Share on Facebook
Share on Facebook
- Share by Email
Share by Email
- Print this page
Print