Detecting Spectre and Meltdown Using Hardware Performance Counters
Editor’s Note: Elastic joined forces with Endgame in October 2019, and has migrated some of the Endgame blog content to elastic.co. See Elastic Security to learn more about our integrated security solutions.
For several years, security researchers have been working on a new type of hardware attack that exploits cache side-effects and speculative execution to perform privileged memory disclosure. Last week, a blog post by Jann Horn of Google and the release of two white papers by multiple researchers set off a frenzy of public panic and speculation. These new vulnerability classes consisted of two distinct flaws named Spectre and Meltdown. Given the impact and technical challenge inherent within these vulnerabilities, we quickly dove into the details to investigate potential detection and prevention strategies to ensure the Endgame product is robust against these new kinds of hardware attacks.
Over the years, our research in vulnerabilities has shaped our exploit prevention strategy. Inspired by the groundbreaking works of Yuan et al and Anders Fogh, CPU performance counters for security policy enforcement is at the core of this strategy. Based on their research and our experience in CPU performance, we hypothesized that many hardware and software flaws can be detected using a combination of heuristic-driven interrupts and instruction sequence verification based on these hardware counters. We then presented our work in 2016 at BlackHat USA.
This post summarizes our current research into detecting side-channel and speculative execution attacks, which remains ongoing as we continue to learn more about attacks like Spectre and Meltdown. Just as we are inspired by the number of researchers that have contributed findings on hardware attacks, we hope to similarly stimulate conversations about promising defensive measures for these new classes of vulnerabilities that are likely to exist for years to come.
Basics of Performance Counters
All processors affected by Spectre and Meltdown provide flexible mechanisms for counting hardware events such as cache flushes and branch mispredictions. There are dozens of events available and processors can be programmed from the kernel to monotonically count events with near-zero overhead. Additional features exist to generate an interrupt when counters reach a limit giving us the ability to perform additional analysis.
Because these resources are handled completely in the CPU, they are naturally cross-platform and fundamentally the same on Linux, Windows, and macOS. They also exhibit very low performance overhead. This is why we chose to use them for control-flow integrity, and why they are an exciting opportunity for detecting attacks like Spectre and Meltdown on all operating systems.
Basics of Spectre and Meltdown Defense
Spectre and Meltdown require two fundamental capabilities to work: speculative execution and cache side-channels. From a defensive perspective, we focus on each of these capabilities independently, breaking them down to determine if we can find strong correlations between an active attack and the hardware performance counters.
The table below adds additional context to each attack variant that we will reference throughout this post.
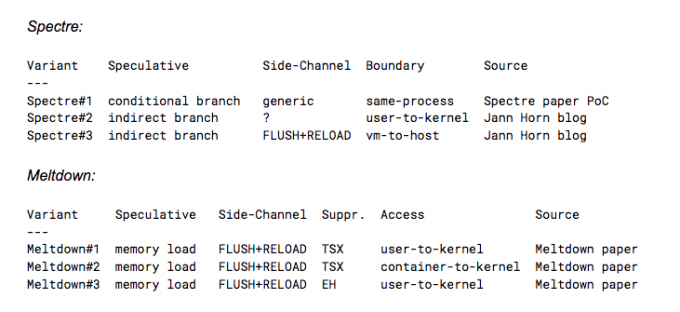
The ability to manipulate and measure various processor caches is critical to reliable exploitation. Speculative execution causes a side effect that enables memory disclosure when combined with these cache attacks. The remainder of this post details several of our initial findings for detecting these kinds of attacks.
DETECTING CACHE TIMING ATTACKS WITH TSX COUNTERS (MELTDOWN#1, MELTDOWN#2)
Transactional Synchronization Extensions (TSX) are a set of instructions provided on Intel processors for efficient synchronization of threaded execution. TSX has its own exception handling which eliminates the overhead of software exception handling performed by the operating system. These extensions are available in Skylake and newer microarchitectures and have proven to significantly speed up practical side-channel attacks. At BlackHat USA in 2016 Yeongjin Jang, Sangho Lee and Taesoo Kim presented a successful attack against Linux, Windows, macOS, and Amazon EC2. Our work leverages an example implementation of their work named kaslrfinder, that targets the Windows 10 kernel.
All cache timing attacks measure subtle timing differences between subsequent accesses to cache lines. Shorter access times imply that the CPU has recently worked with data belonging to that cache line. In most cases, the attack first records a start time using high resolution timers like RDTSC/RDTSCP, although these instructions are not strictly necessary. It then probes an unknown address and handles the exception. By measuring the time again, the attacker can discover differences in timing and identify unmapped/mapped/non-executable/executable pages in memory. The following code block demonstrates how to use TSX instructions to capture this temporal gap:
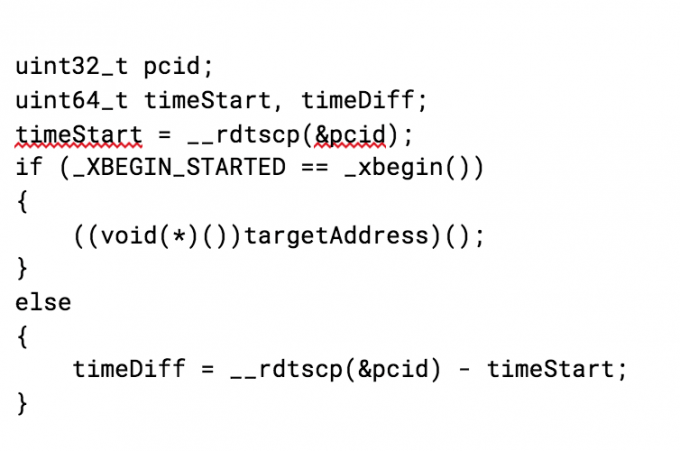
This compiles to the following instructions.

TSX bypasses traditional try/catch C++ exception handling making the timing faster with less jitter. Specifically, the attack relies on the transaction aborting due to accessing the unknown target address. In the above assembly, an access violation during the call will “silently” continue executing at the _xabort label. Fortunately, there are specific counters to track TSX execution and aborts such as RTM_RETIRED.ABORTED. The documentation defines the counter behavior as “the number of times RTM (Restricted Transactional Memory) abort was triggered”.
In our analysis TSX aborts do not occur normally, but do in this type of exploit. We see this clearly by counting RTM_RETIRED.ABORTED system-wide during normal activity and comparing the output to the same test with the kaslrfinder side-channel attack running. The output below is from Intel’s pcm tool.
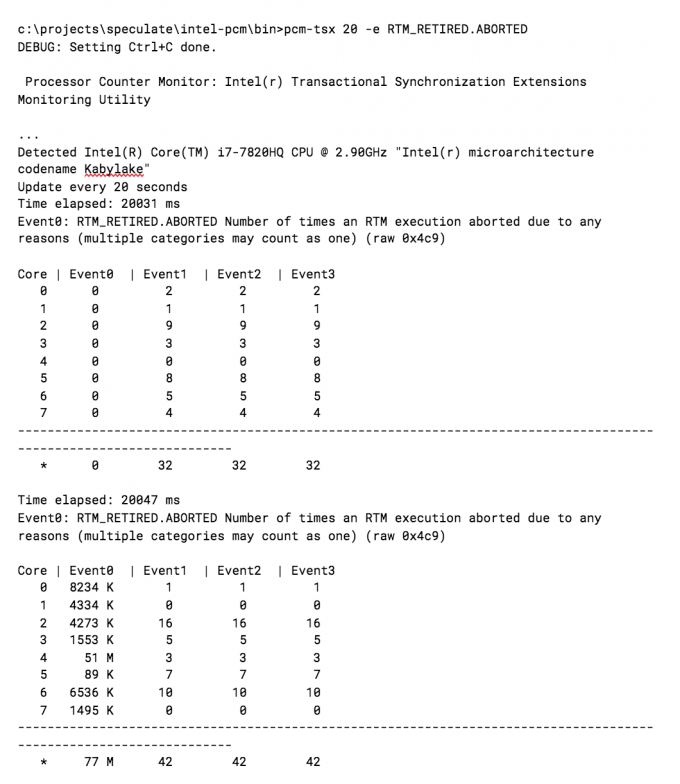
The results are clear. The RTM_RETIRED.ABORTED counter has a very high signal-to-noise ratio and looks promising.
In a practical implementation to prevent such an attack, you can also set the RTM_RETIRED.ABORTED counter to interrupt on overflow at a high TSX abort rate and compare the results based on process run-time. In initial testing, this is fairly reliable due to the high true-positive rates, eliminating the need for further noise reduction.
DETECTING CACHE TIMING ATTACKS USING PAGE FLUSH COUNTERS (MELTDOWN#3)
As the previous example demonstrates, attacks can discover memory locations using cache access measurements. With TSX extensions, this can be performed quickly without causing exceptions from the operating system, but TSX extensions are not always available. Without TSX, the attacker must rely on traditional exception handling to perform timing attacks. The following code demonstrates the same attack but instead uses traditional Structured Exception Handling (SEH) on Windows. This approach achieves the same result except much slower due to the additional overhead of handling the access violation by the operating system instead of hardware.
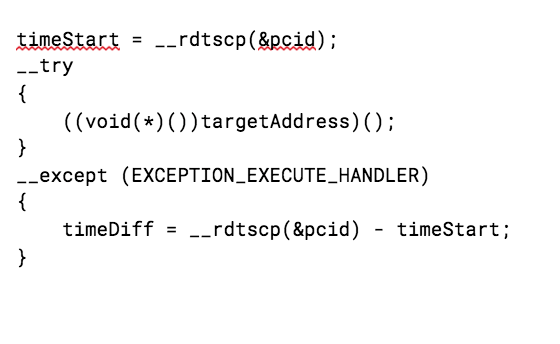
Unlike exceptions in TSX regions, traditional exception handling is serviced by the operating system and generates observable side-effects. We hypothesize that these side effects during an attack would appear anomalous. For instance, when an unprivileged user is attempting to discover virtual addresses in the kernel, the address being probed during the page fault will cross the protected virtual memory boundary between user and kernel memory pages.
We address this attack scenario on Windows by sampling the side effects from the beginning of an unprivileged process execution, and counting the number of times the faulting address is trying to access kernel virtual memory. The side effect we investigate is the ITLB_FLUSH that happens on context switches in the servicing of exceptions. Using the ITLB as our signal is noisy in practice, so we need to identify the kernel address being probed from the unprivileged process. Fortunately, the last branch record (LBR) stack can track interrupts and exceptions with little overhead. Section 17.10.2 of the Intel manual Vol. 3B notes:
"Additional information is saved if an exception or interrupt occurs in conjunction with a branch instruction. If a branch instruction generates a trap type exception, two branch records are stored in the LBR stack: a branch record for the branch instruction followed by a branch record for the exception. If a branch instruction is immediately followed by an interrupt, a branch record is stored in the LBR stack for the branch instruction followed by a record for the interrupt."
The possible steps using ITLB_FLUSH+LBR are as follows.
- Program the LBR MSRs to store the last exception records containing MSR_LER_TO_LIP.
- Beginning with process execution, set TLB.ITLB_FLUSH to generate and interrupt when the counter overflows after a threshold of N events.
- In the ISR, read MSR_LER_TO_LIP and MSR_LER_FROM_LIP records for branching entries attempting to access kernel virtual memory.
Keep in mind that this is a possible heuristic only when an attacker is attempting to disclose kernel memory from userland, and only when using a branch instruction. Unfortunately the Windows kernel does not provide powerful page fault analysis like Linux does so further research is required to use similar approaches for other vectors.
DETECTING FLUSH+RELOAD ATTACKS USING LAST-LEVEL-CACHE (LLC) UOPS COUNTING (SPECTRE #3, MELTDOWN#1, MELTDOWN#2, MELTDOWN#3)
Jann Horn uses a technique from Yarom and Falkner called FLUSH+RELOAD to target memory cache accesses using eviction and load timing. The FLUSH+RELOAD method is particularly powerful because it can be used to leak across execution cores and is necessary to attack cross-vm memory pages. While we did not reproduce Jann's specific attack of the KVM host memory space, we simulated cross-vm and same system attacks using different implementations of FLUSH+RELOAD from the original research paper. The major contribution from Yarom and Falkner is the abuse of the last level cache (L3) in an evict and reload loop to reliably determine memory locations and disclose data.
To determine a defensive solution for FLUSH+RELOAD, we investigated whether an abnormal amount of L3 cache misses could be observed globally across the system, and if the observation indicated a significant deviation from a baseline when performing the attack. Our developer desktop used for testing contains a lot of idle and active processes, which allows us to replicate the technique based on an approximation from the paper. Because we only care about detecting the cache eviction loop, we can simply run the spy program and measure it using performance counters.
Initially, several counters looked promising, but testing has shown MEM_LOAD_UOPS_RETIRED.L3_MISS to have the greatest potential. A UOP is a micro operation responsible for the building blocks necessary during instruction execution. These UOPs can be thought of as small jobs that are highly parallelizable. A retired UOP is one that was valid and finished its task. For MEM_LOAD_UOPS_RETIRED.L3_MISS we count every time the system was asked to load data from the cache but was missed in the LLC.
The suggested steps for using this counter are below. Remember that the LLC is system wide so context switching and rescheduling does not affect our experiment. The assumption in this scenario is that an attacker has crafted their own program that uses FLUSH+RELOAD and is not co-opting a long running process.
- On program execution, record the current count of UOPs retired with L3 misses.
- Register an ISR and program the PMU to overflow on a large threshold.
- In the ISR, measure the program start time against the threshold and terminate if out-of-range.
The easiest way to demonstrate the signal and noise is with a simple setup again using Intel's pcm tool. The experiment follows.
- Start the pcm tool displaying the counter results system wide for 30 seconds.
- Measure the baseline from the test system.
- Next run the FLUSH+RELOAD spy tool to execute the attack.
- Note the increase in L3_MISS UOPs.
Below are the results. The first measurement runs for 30 seconds on my fairly busy Haswell laptop. The second measurement is the same laptop while also running the FLUSH+RELOAD attack.
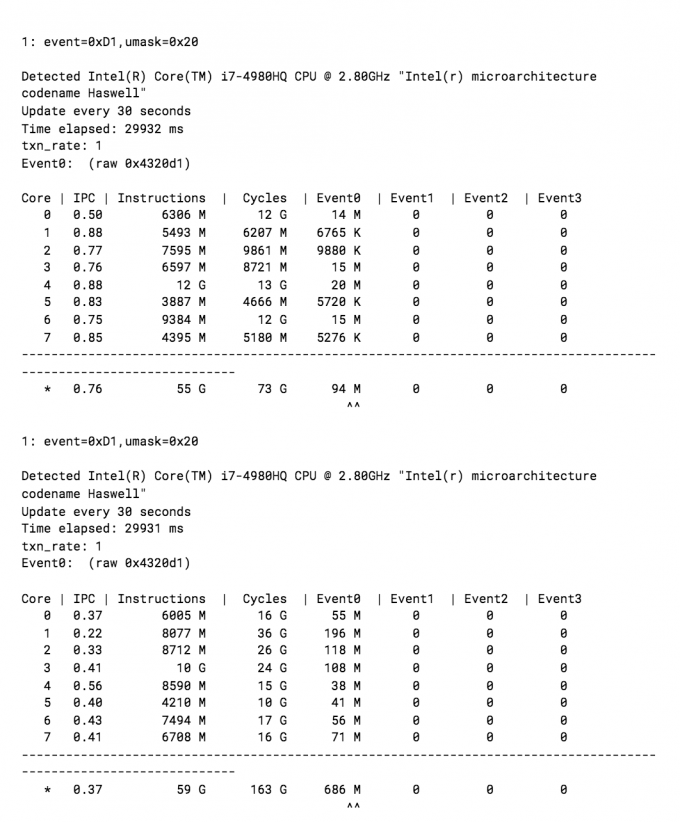
As the code above demonstrates, there is a large difference in the UOPs missing the L3 cache when performing the side-channel attack. In the future, we may be able to simplify the detection algorithm by calculating a deviation from cycles to l3_misses for a running program.
DETECTING SPECULATIVE BRANCH EXECUTION LEAKS (SPECTRE#1, SPECTRE#2, SPECTRE#3)
Speculative execution of branch instructions is part of the optimization core of superscalar architectures and applies to all modern CPUs. The Spectre attack abuses this optimization to cause branch mispredictions that load victim values into a cache the attacker can recover through a side-channel. The previous detection strategies focused on cache side-channels, so let's now look at trying to detect abnormal branch speculation. Based on our reading of the Spectre white paper and testing sample code we assume the following.
- Branch speculation is a constant,unlike TSX aborts.
- Spectre will correctly predict a target branch N times.
- Spectre will mispredict the same branch once causing the speculative execution to read out-of-bounds.
- Side channel measurements will determine the value of the byte using cache line indexing.
- Due to speculative execution, the mispredicted branch will execute but not retire.
Due to constant branch speculation we assume that we can't simply count events and expect to reduce the noise. We also know through our CFI work that we can cause an interrupt on the mispredicted branch. In that work, we leveraged the last branch records (LBR) to accurately determine the source and destination for CFI protections. We could possibly use the LBR to record the multiple successfully-predicted branches preceding the malicious one. One nice feature of the LBR is the ability to quickly determine if a record was mispredicted or not by testing the MSB or the LBR_INFO MSR.
We perform the four steps below to program the PMU for testing.
- Set the LBR_FILTER to only record conditional branches from userland.
- Set up interrupts on each BR_MISP_EXEC.NONTAKEN_CONDITIONAL which includes speculative branches.
- Install the ISR to analyze the full LBR stack at misprediction when the PMI is delivered.
- Analyze the LBR in the ISR to determine if a pattern of predicted and mispredicted victim_function locations exists.
Below are the experiment results using this approach when executing the PoC from the Spectre paper, modified to show the address of the targeted conditional branch in victim_function and using __mfence instead of the timing loop. An asterisk next to an address indicates the entry was mispredicted.
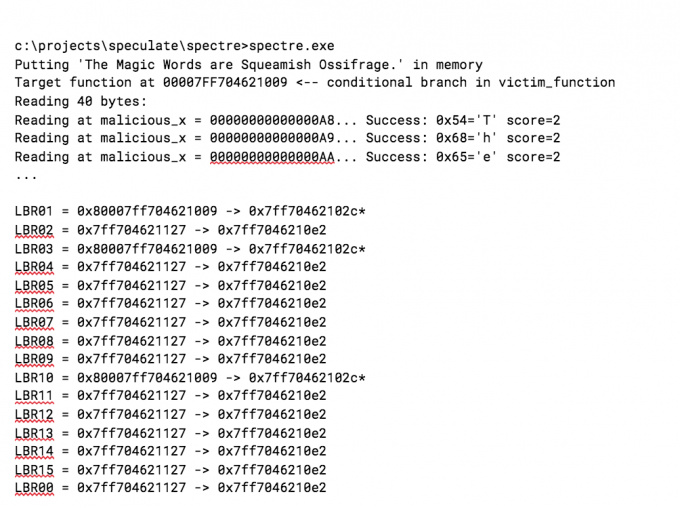
Our hypothesis was partially correct. We expected to see the victim function conditional branch alternate with the conditional training loop branch from the code. However, the LBR is not reliably recording the victim loop and we aren’t sure why. This type of monitoring may be better suited for Precise Event Based Sampling.
While this result needs more experimentation we are hoping for a stronger correlation from the indirect branch method used by Jann and also covered in the Spectre paper. With more exploits to test we are confident we can make more progress using a variation on this approach.
Conclusion
By sharing this information, we hope to further engage the research community and identify multilayered options for defending against Spectre and Meltdown. This initial research and solutions, while promising, are far from complete. This new class of vulnerability will continue to develop for several years.
We are committed to operationalizing our research as these attacks evolve, and maintain state-of-the-art protections in the Endgame platform. This situation is no different from investigating other types of exploits. The Spectre and Meltdown vulnerabilities clearly have significant reach. We feel strongly that our approach to protection - and focusing on classes of vulnerabilities instead of each specific CVE as it pops up - serves our customers well against these kinds of attacks and those in the future.
A special thanks to my ENDGAME colleagues Gabriel Landau, Nicholas Fritts, and Andrea Little Limbago for code, review, and thought provoking re-reading of the Intel manual.