Stream AWS metrics to Elastic using Amazon CloudWatch Metric Streams
.jpeg)
In today’s data-driven world, organizations need to harness the power of real-time monitoring and analysis. Amazon CloudWatch native monitoring service provides a robust platform for tracking metrics, logs, and events from various Amazon Web Services (AWS) resources. However, when you need to extend your monitoring and analytics beyond CloudWatch, integrating CloudWatch with Elastic can be a game-changer.
Elastic Observability unifies logs, metrics, and application performance monitoring (APM) traces for a full contextual view across your hybrid AWS environments alongside their on-premises data sets. Elastic Observability enables you to track and monitor performance across a broad range of AWS services, including AWS Lambda, Amazon Elastic Compute Cloud (EC2), Amazon Elastic Container Service (ECS), Amazon Elastic Kubernetes Service (EKS), Amazon Simple Storage Service (S3), Amazon Cloudtrail, Amazon Network Firewall, and many more.
Elastic Observability — in combination with the Elastic AI Assistant — enables the creation of a dynamic context window that enhances the quality of responses from a large language model (LLM). This powerful integration significantly improves the accuracy and relevance of answers. For example, when you ask the Elastic AI Assistant about a specific issue affecting your application, it collects all the pertinent details, such as current anomalies captured from metrics or insights from a related runbook stored in the Elastic AI Assistant’s knowledge base.
To simplify this process and reduce management overhead of agents, AWS customers can now use the new Amazon Cloudwatch Metric Stream to ingest metrics into Elastic Cloud in real time and view them in Elastic alongside other metrics for centralized analytics. This eliminates the necessity for time-consuming and expensive procedures, such as agent provisioning or data shipper operations.
In this blog, we’ll explore how to stream Amazon CloudWatch metrics directly to Elastic using CloudWatch Metric Streams. This integration offers real-time data streaming — enabling faster detection of anomalies, more granular insights, and better operational visibility.
What is CloudWatch Metric Streams?
Amazon CloudWatch Metric Streams is a feature that allows you to stream CloudWatch metric data to external destinations in real time. Instead of waiting for periodic CloudWatch API polling or pushing metrics to third-party services manually, Metric Streams allows for near-instantaneous delivery of CloudWatch metrics.
Why should you stream metrics to Elastic?
Elastic is a powerful search and analytics engine often used for logging, monitoring, and analyzing large data sets. By streaming CloudWatch metrics directly to Elasticsearch, you can take advantage of Elastic's powerful query, visualization, dashboard, and generative AI capabilities. Some key benefits of this integration include:
Real-time monitoring: Get real-time insights and alerts based on CloudWatch metrics.
Centralized analytics: Combine metrics with logs, traces, and other data sources for more powerful correlation and troubleshooting.
Custom dashboards: Use Kibana to create custom dashboards that combine CloudWatch metrics with other data points for richer insights.
- Scalability: Scale effortlessly, handling large volumes of data while providing low-latency querying.
Prerequisites
Before you begin, ensure that you have the following:
AWS account: A valid AWS account with appropriate IAM permissions
Elastic cluster: Set up Elastic Cloud (Hosted or Serverless) on AWS (if not already done)
CloudWatch metrics: Ensure you have CloudWatch metrics generated from your AWS resources
IAM roles/permissions: Permissions to create and manage CloudWatch Metric Streams and write data to your Elasticsearch
Step-by-step guide to stream CloudWatch metrics to Elasticsearch
Step 1: Set up an Elastic cluster
If you don’t have an existing Elastic cluster, create one:
Navigate to the AWS Marketplace and search for Elastic in the AWS Management Console.
Follow the detailed steps outlined in this guide to deploy an Elastic cluster on AWS: Getting Started with Elastic Cloud on AWS.
Set up access policies and ensure the right permissions are in place for CloudWatch to push metrics to Elastic.
Step 2: Create a CloudWatch Metric Stream
Now, let’s create a Metric Stream to send CloudWatch metrics to Elasticsearch.
1. Go to the CloudWatch console:
Open the CloudWatch dashboard in the AWS management console.
2. Create Metric Stream:
In the CloudWatch console, select Metric Streams from the navigation pane.
Click on Create metric stream.
3. Configure stream settings:
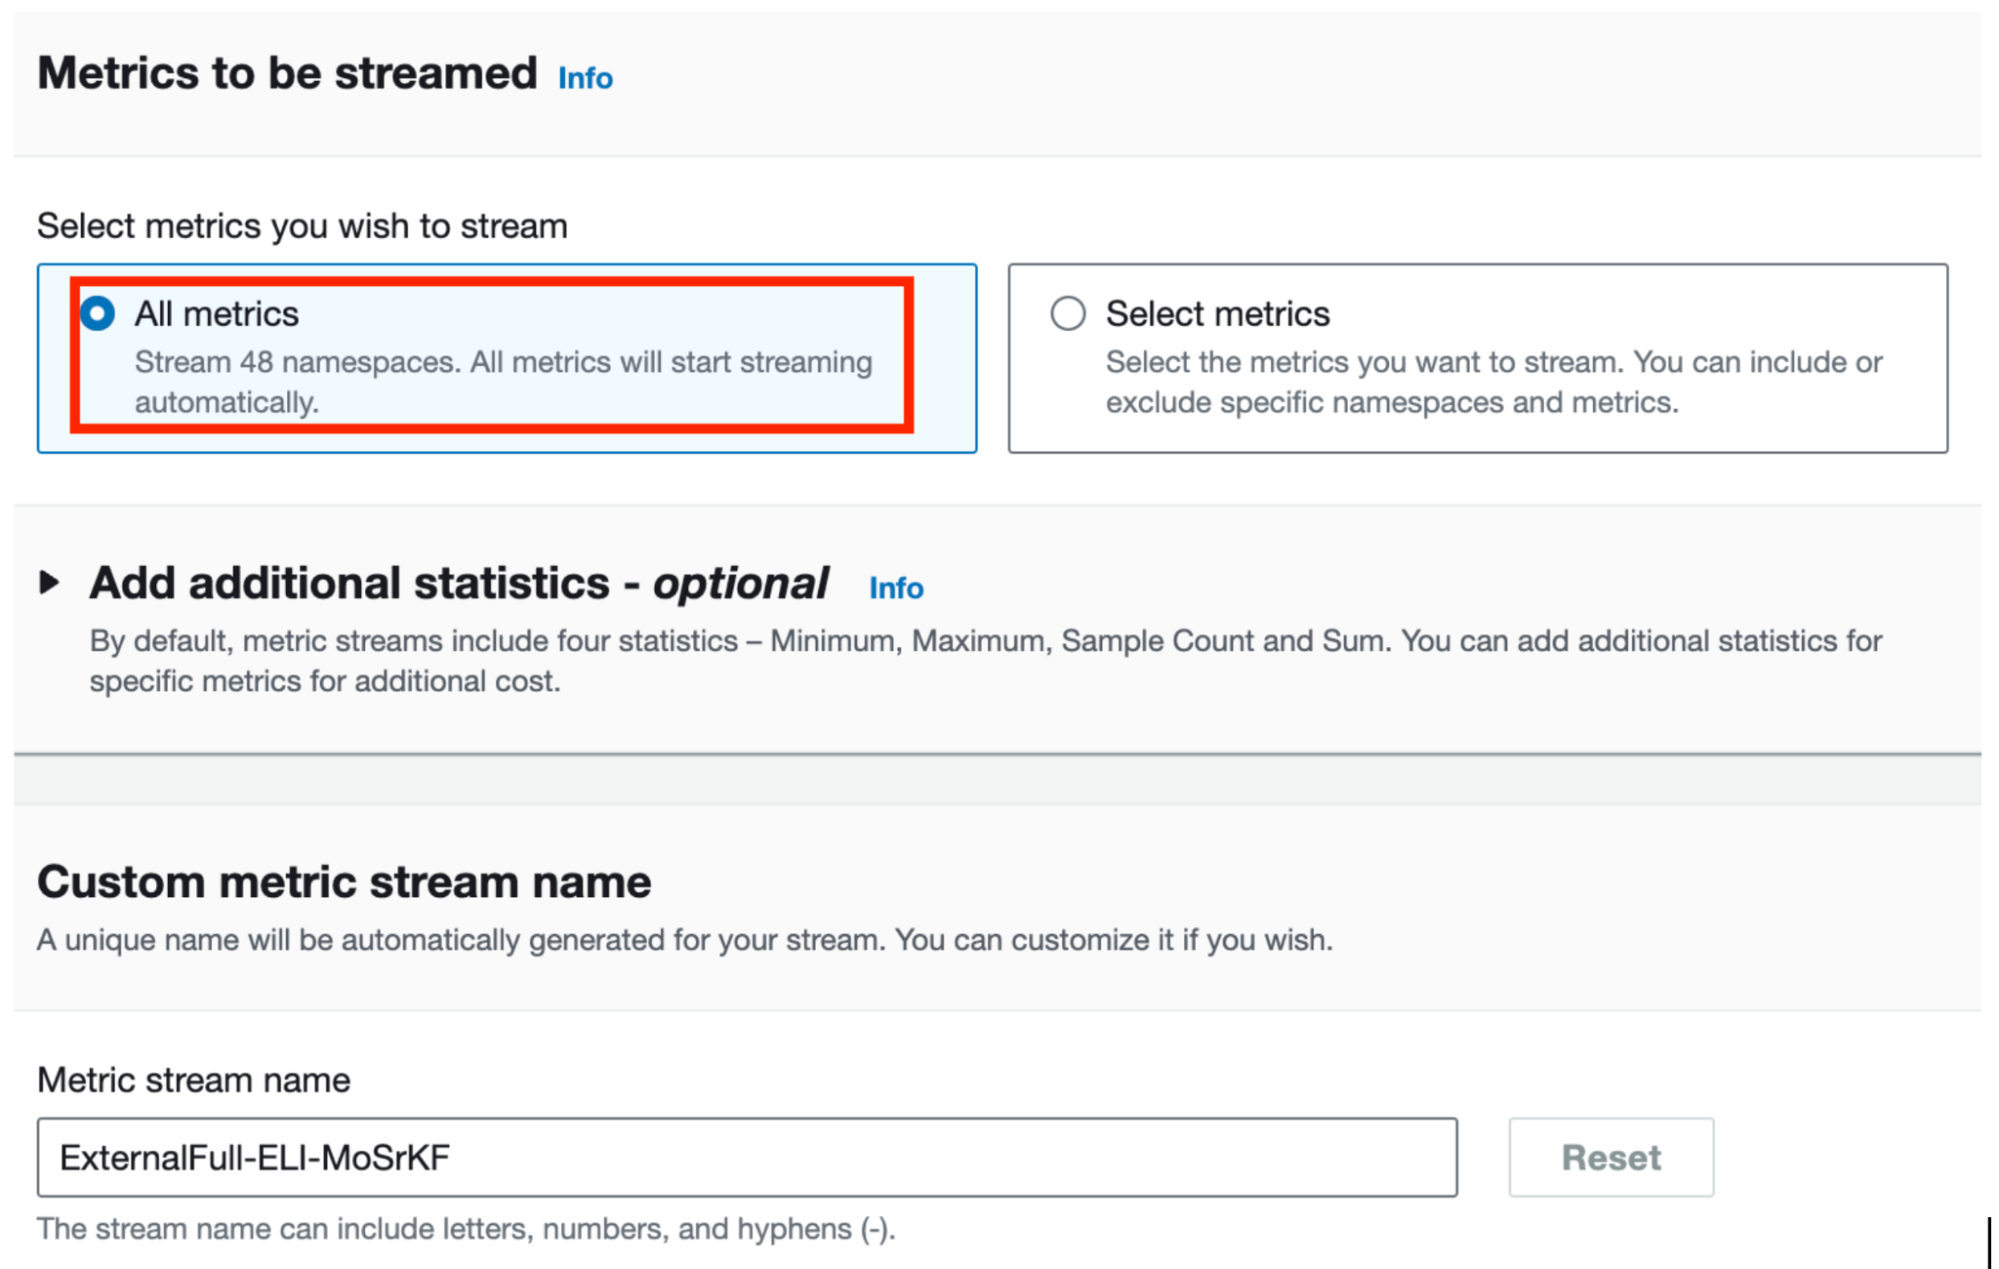
Choose the metrics to stream, such as specific namespaces or all available metrics.
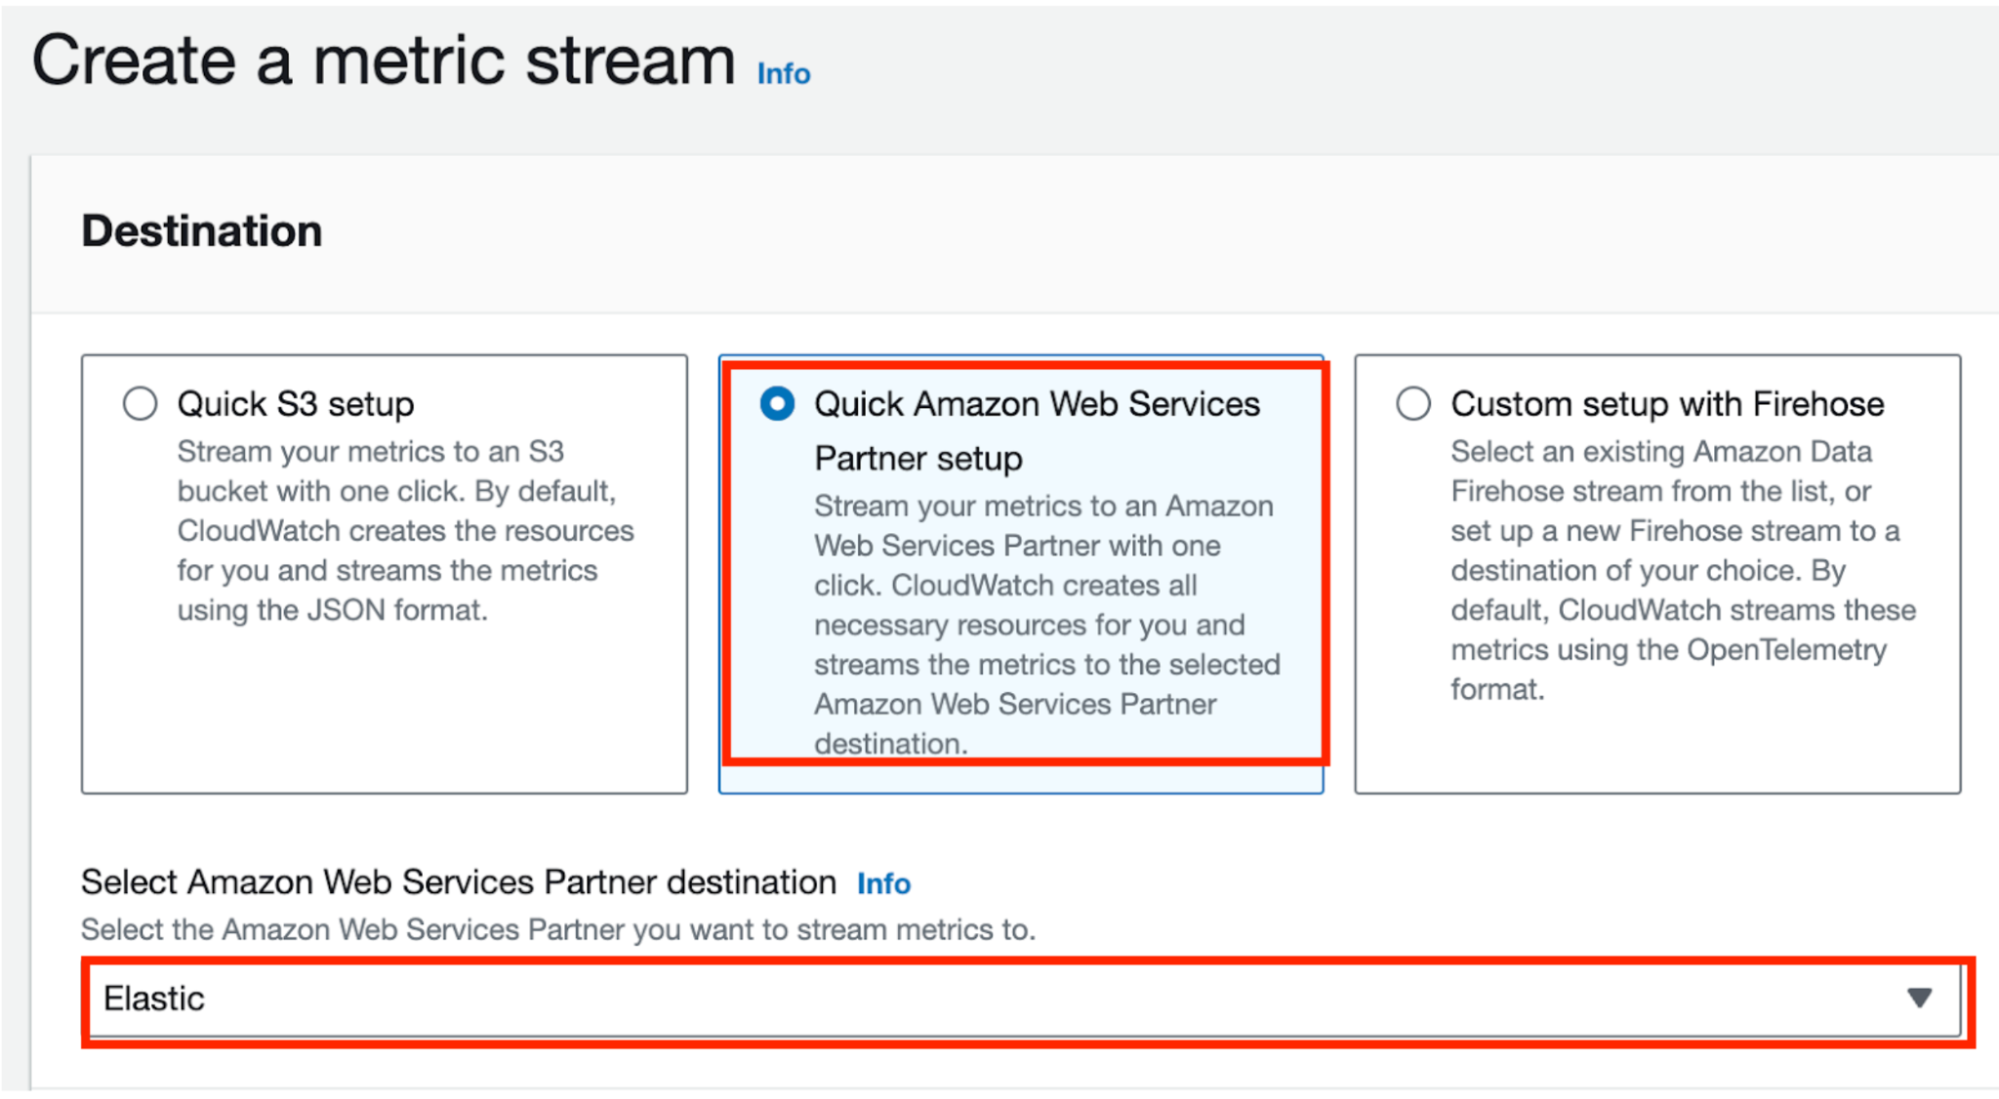
- In the Destination section, select Quick Amazon Web Services Partner setup as the destination for the metrics stream.
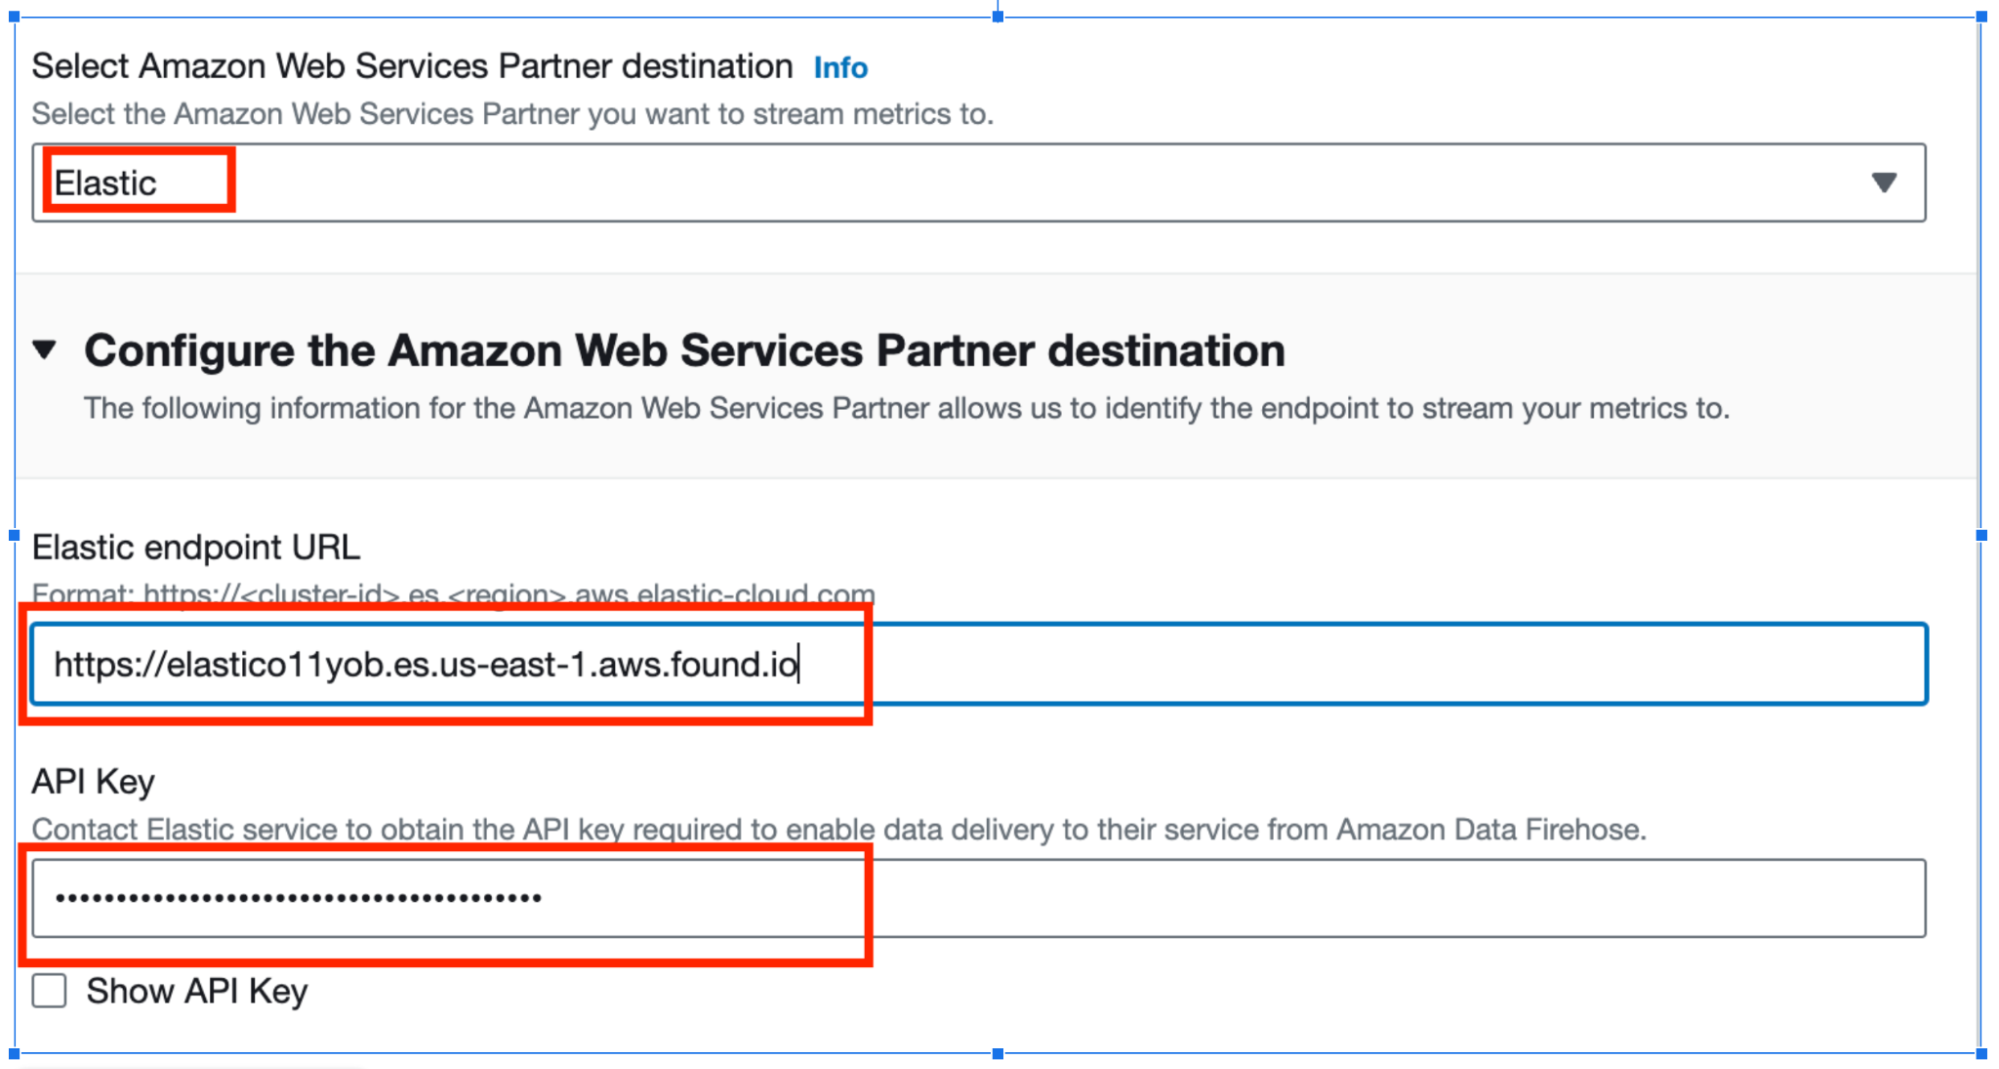
- Choose Elastic in the dropdown Amazon Web Services Partner destination and provide the Elastic endpoint URL and API key.
4. Stream settings:
5. Review and create:
- Review the configuration and click Create metric stream.
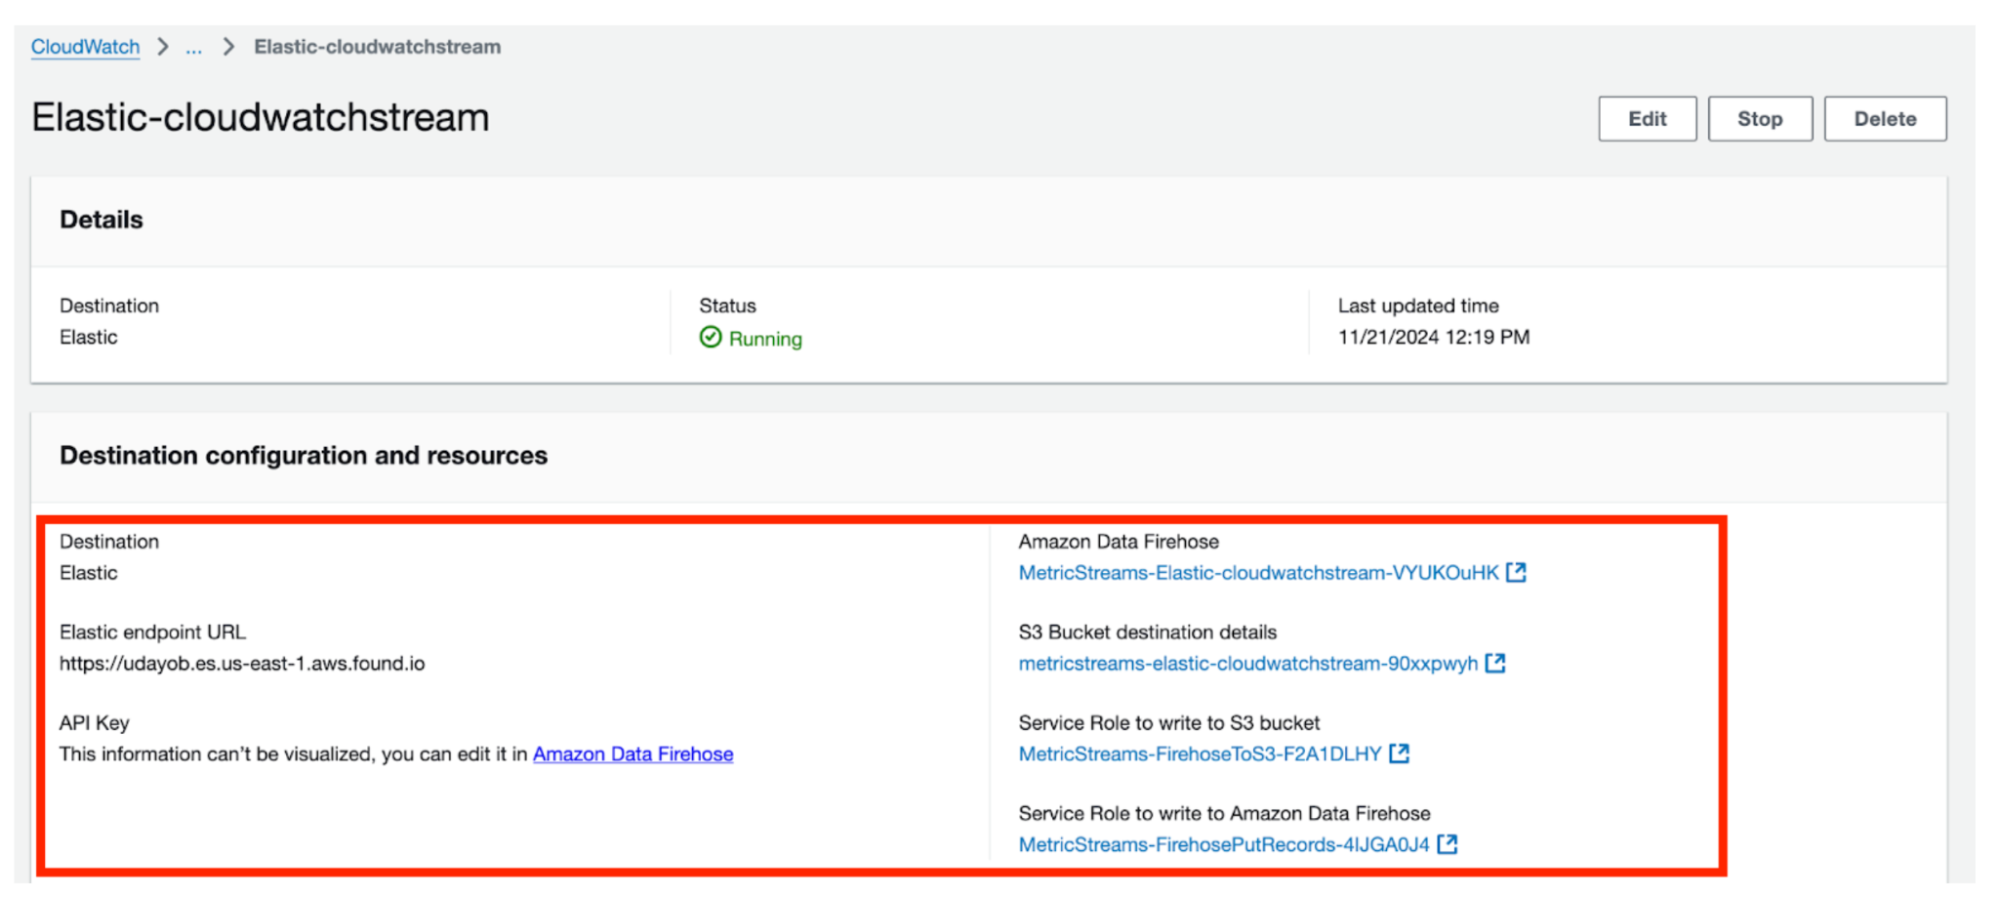
Once the metric stream is created, CloudWatch will begin streaming the selected metrics to your Elastic Cloud instance in real time.
Step 3: Execute a Lambda function to generate CloudWatch metrics
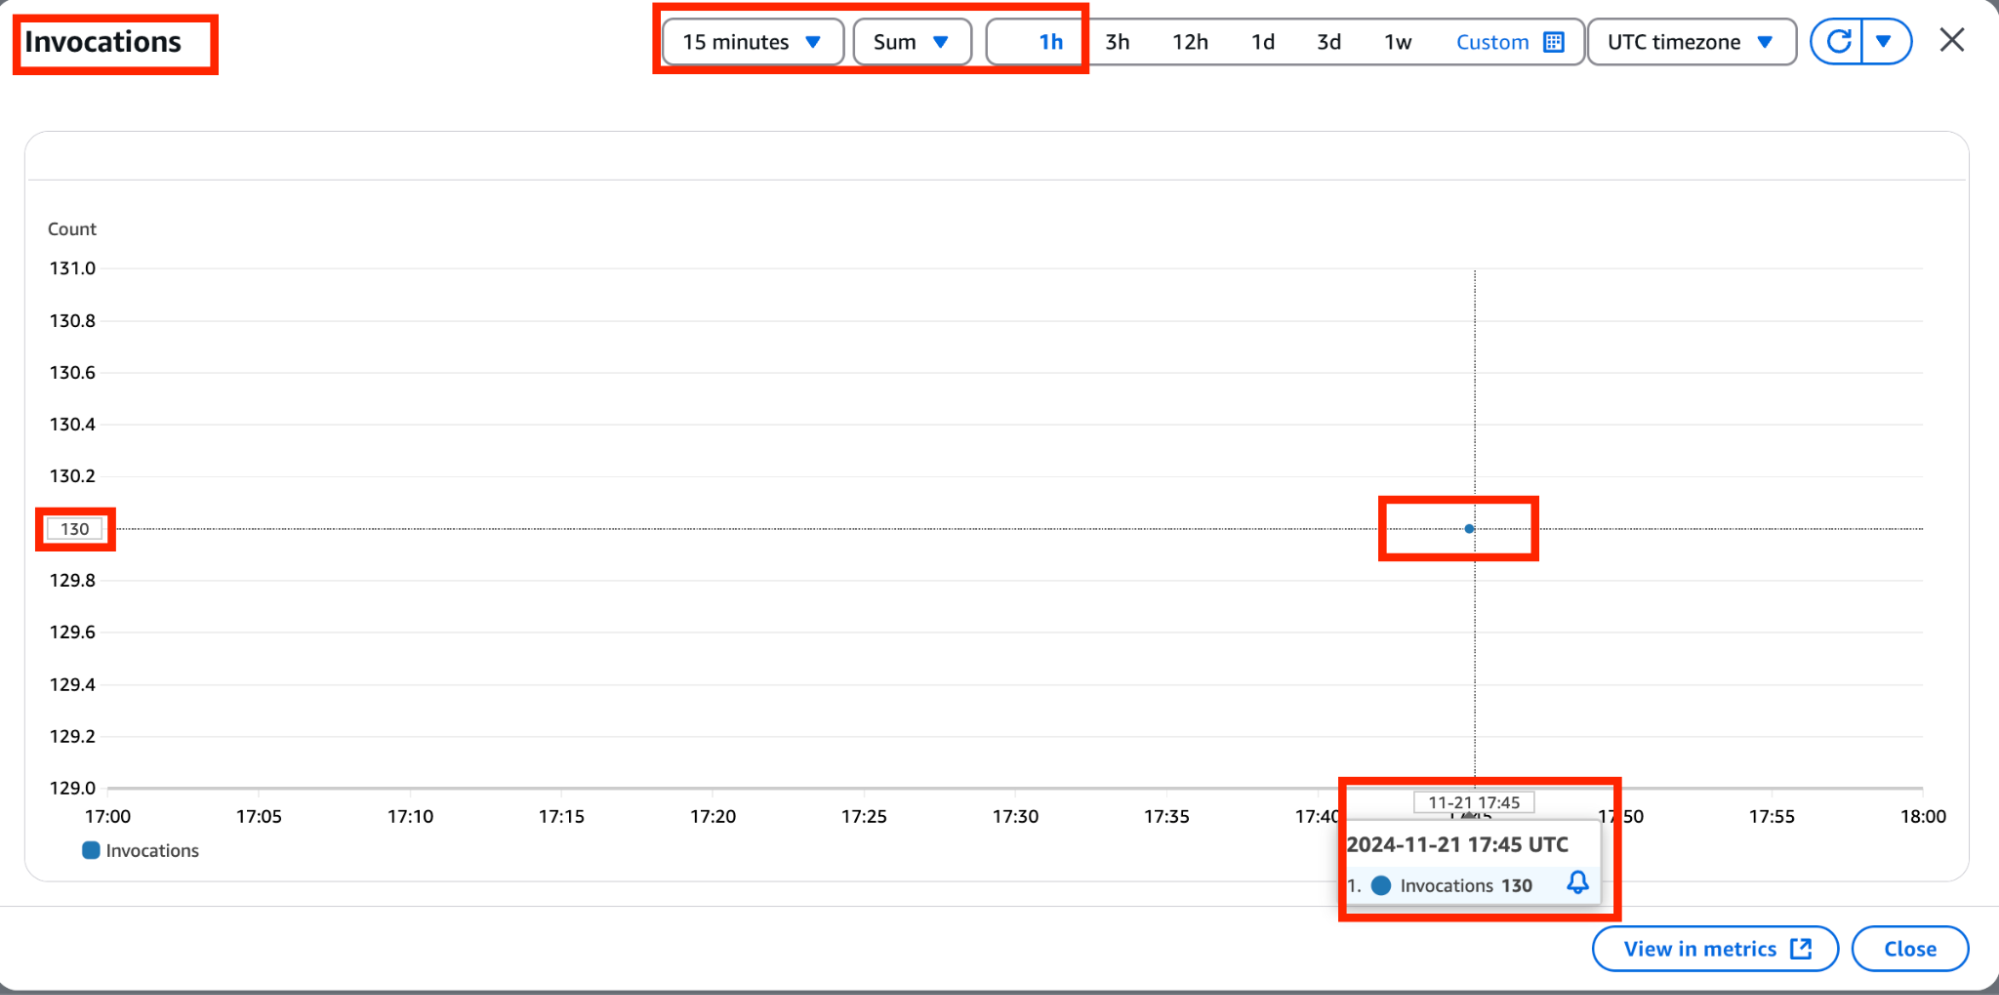
Execute an AWS Lambda function or run an EC2 compute instance that has your application code. You can now navigate to CloudWatch metrics to observe the current metrics being generated. For example, for AWS Lambda, you can see that the CloudWatch metrics are being generated, and here, you can see there are 130 invocations.
Step 4: Verify data in Elastic
After a few minutes, metrics should start appearing in your Elastic cluster. To verify:
Navigate within Elastic to Kibana
Navigate to Elastic integrations
Once you're in Kibana, go to the Management section in the left-hand menu. Under Management, click on Integrations.
Search for Amazon Kinesis Data Firehose
In the Integrations section, use the search bar to find Amazon Kinesis Data Firehose.
Select the integration
Click on the Amazon Kinesis Data Firehose integration from the list.
Go to integration settings
Once you've clicked on the integration, navigate to the Settings section where you can configure the integration.
Install necessary assets
Follow the on-screen instructions to install any required assets for the integration.
In Kibana, use the left-hand menu to select Management. Then, go to the Index Management section and verify the name of your CloudWatch metrics stream under data streams.
Use the left-hand menu to select Dashboards under Analytics to create and view all the dashboards for your AWS usage. Search for “Metrics AWS” and select the [Metrics AWS] Usage Overview dashboard.
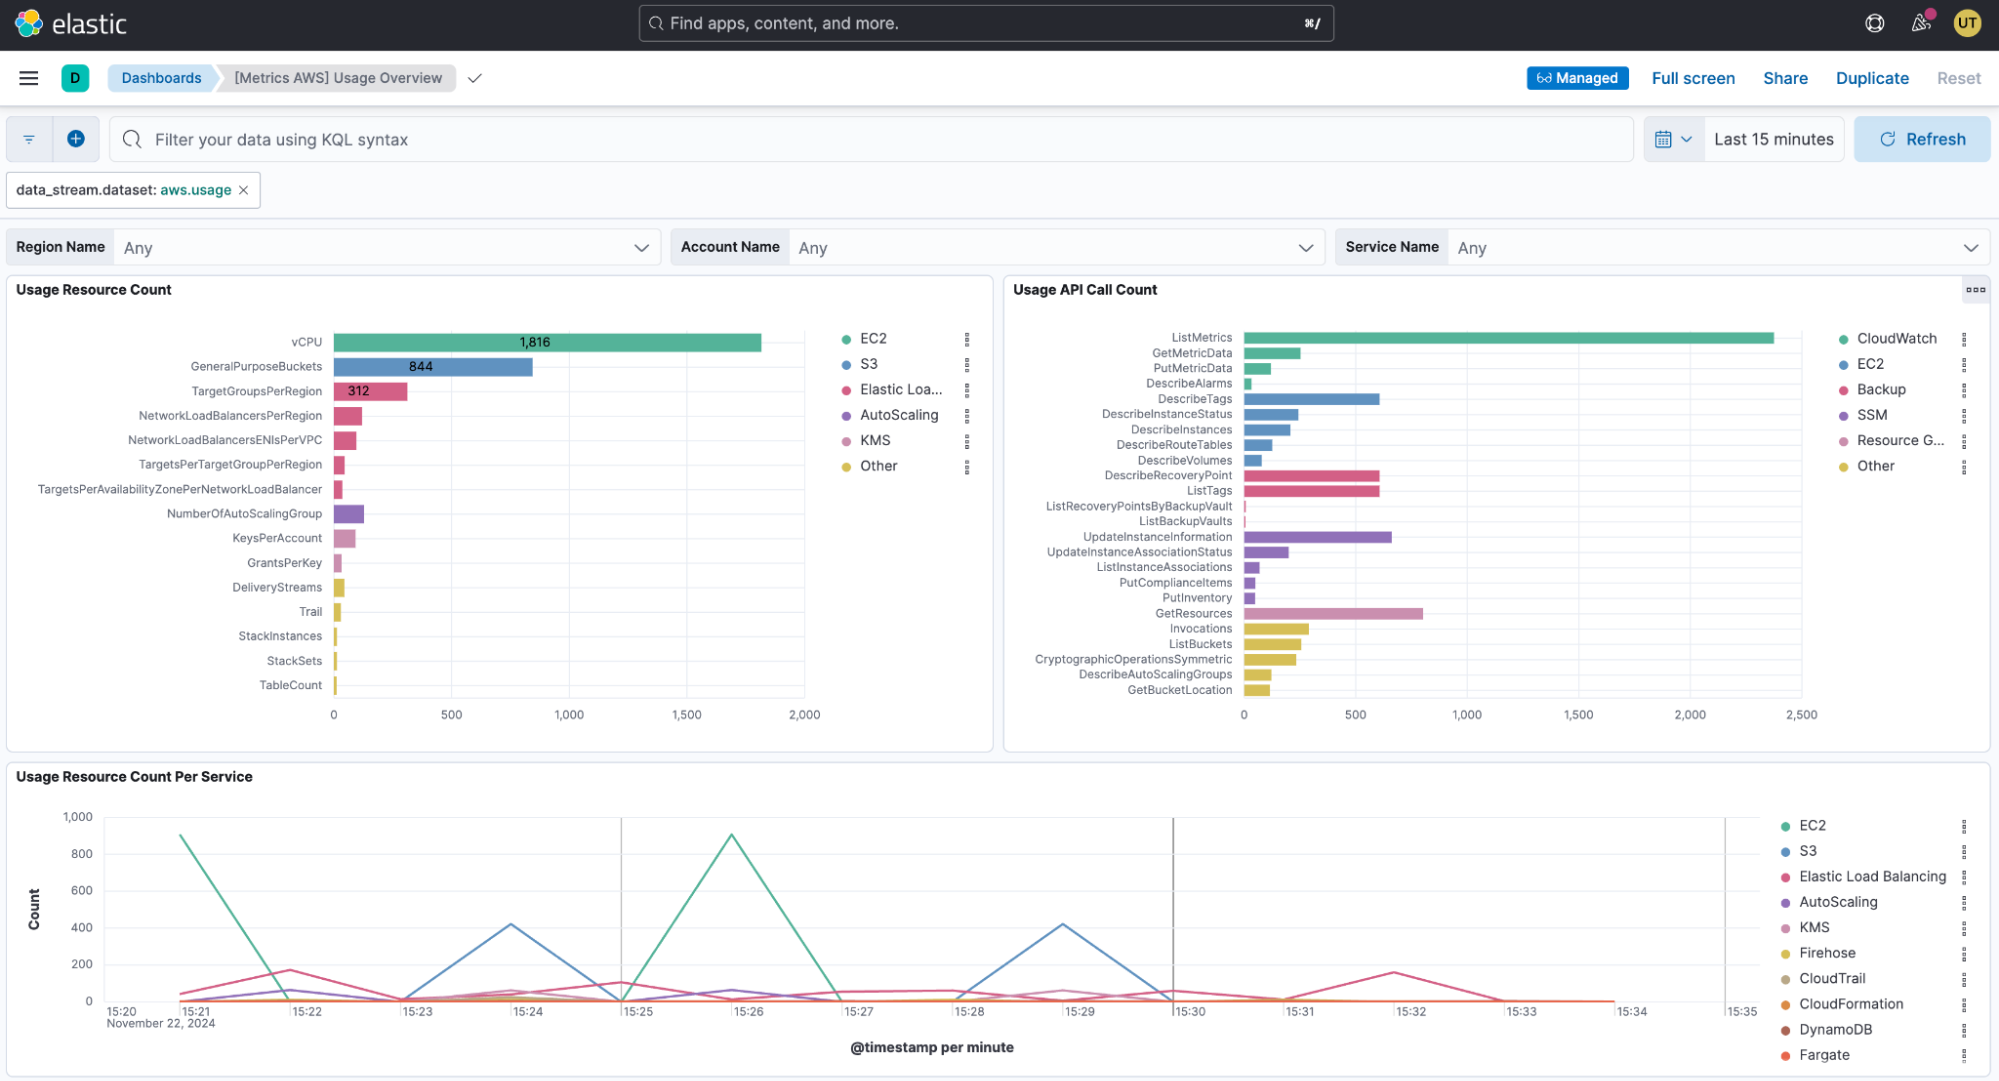
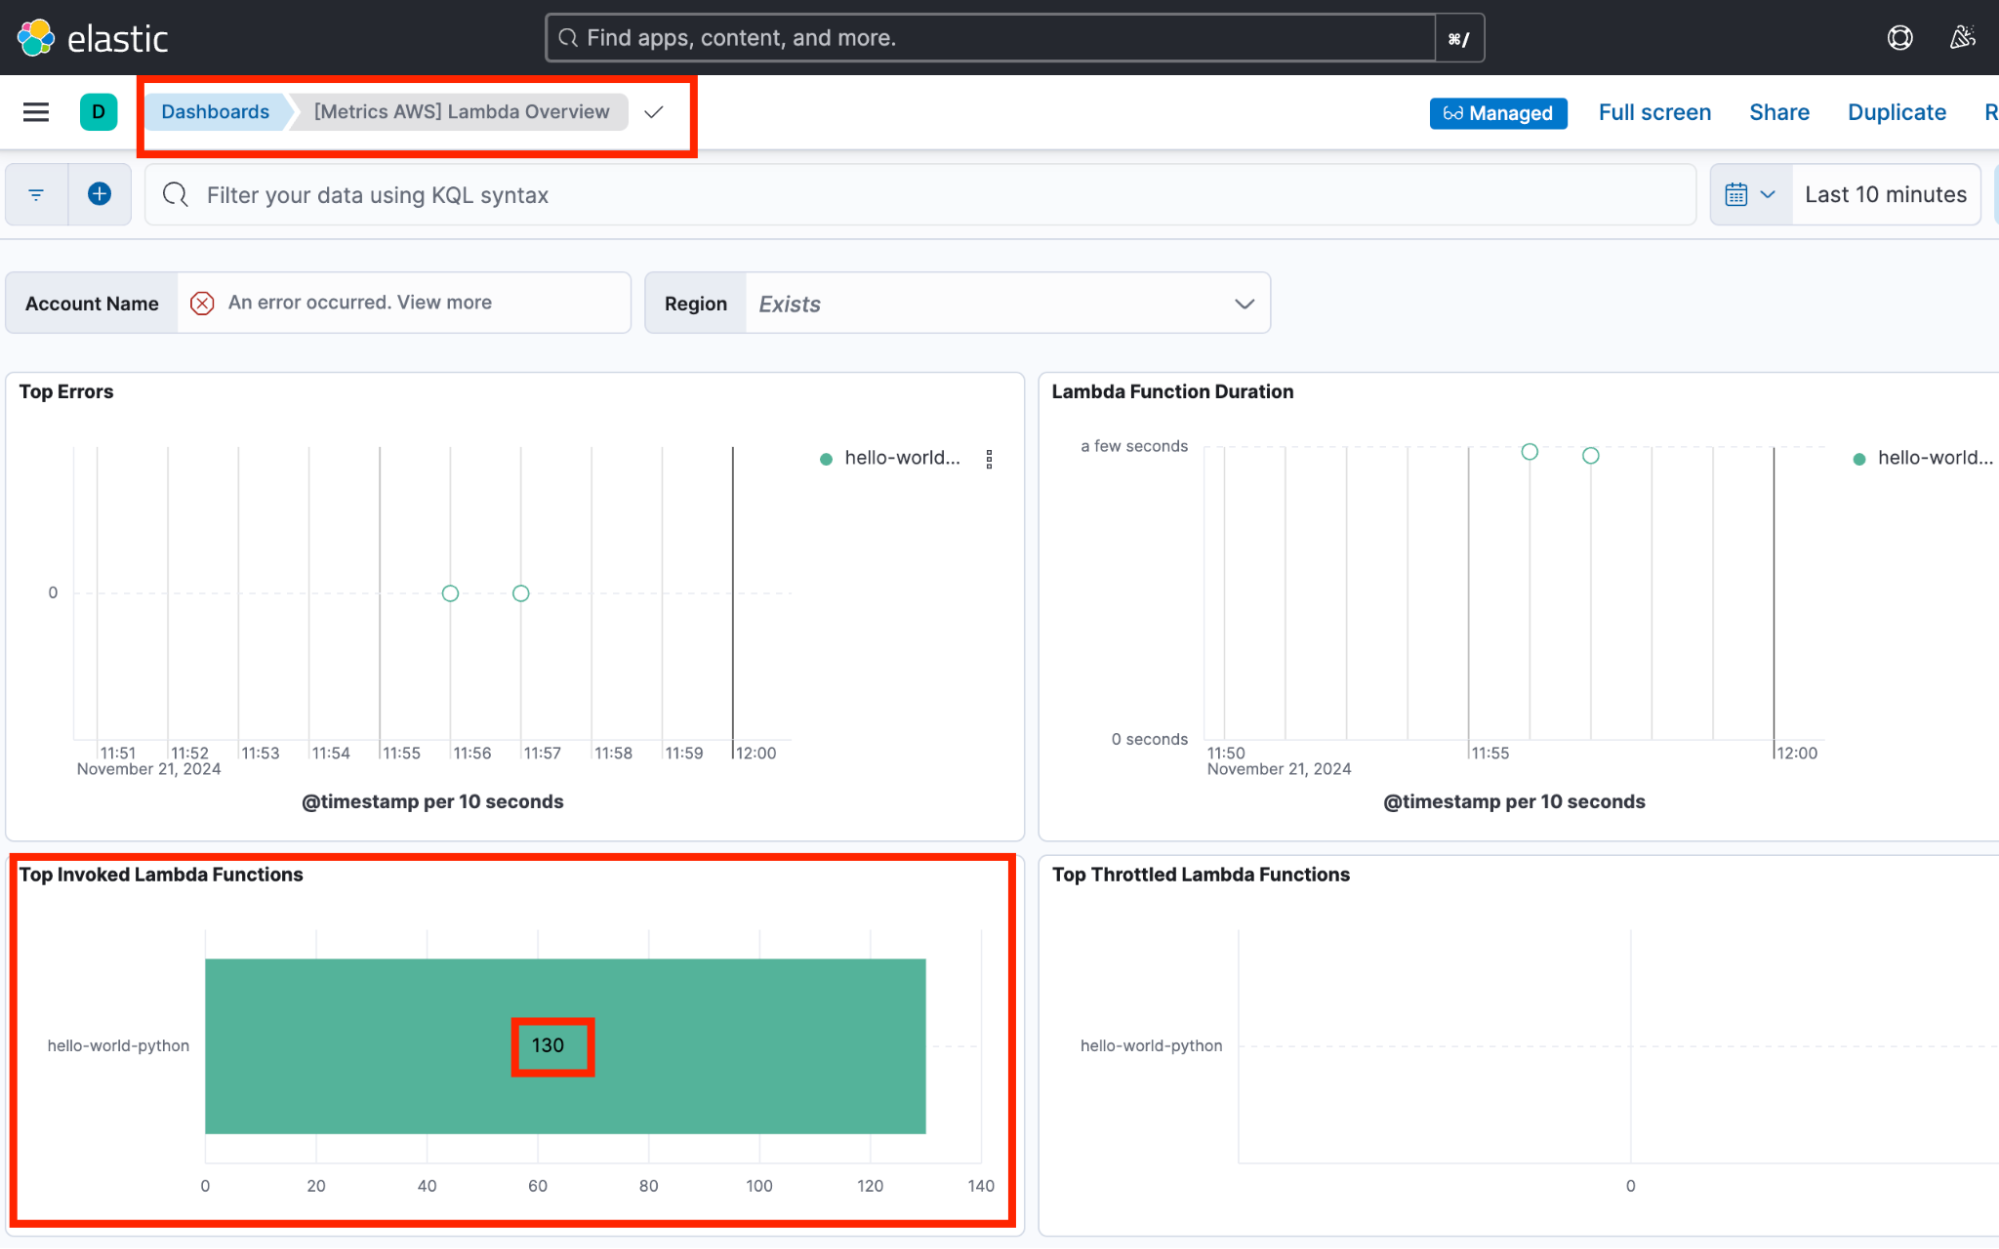
As you can see below, the same 130 invocations of the AWS Lambda function that you observed in the Amazon web console are streamed back into Elastic successfully.
Explore the metrics
Once the index is created, you can query and visualize the data in Kibana.
Use Kibana dashboards to create visualizations that combine CloudWatch metrics with logs or other data sources to gain better operational insights.
Step 5: Create dashboards and alerts
With your metrics now streaming to Elastic, you can:
Build custom dashboards in Kibana for visual insights into your AWS environment’s health.
Set up alerts for specific thresholds or anomalies detected in the data.
Use the Elastic AI Assistant to analyze alerts, such as high CPU usage in Amazon EC2 or Amazon Kubernetes Service (EKS) instances, to optimize and fine-tune your application workloads and to reduce costs.
Stream your metrics to Elastic
Integrating Amazon CloudWatch Metric Streams with Elastic unlocks the potential for real-time analytics, better operational insights, and seamless monitoring of your AWS resources. By streaming CloudWatch metrics to Elasticsearch, you can use powerful querying and visualization features to optimize your infrastructure and applications. Whether you are looking to identify performance bottlenecks, track resource usage, or set up automated alerts, this integration provides the flexibility and scalability to meet your needs.
The release and timing of any features or functionality described in this post remain at Elastic's sole discretion. Any features or functionality not currently available may not be delivered on time or at all.