Elastic Maps 7.5.0 released
Elastic Maps 7.5 is here and from uploading your own custom vector shapes to increasing the awesomeness of your tooltips, this release has lots of fun goodies you’re going to want to check out. We’ve been hard at work since our 7.4 release 5 weeks ago and we’re so excited to put new 7.5 Elastic Maps features in your hands.
Want to start playing with these (and so many more) new capabilities right now? Using Elastic Cloud to deploy Elasticsearch and Kibana 7.5 can have you there in the next 3 minutes. Interested in using your own self-managed environment or spinning something up on your laptop? The 7.5 versions of Elasticsearch and Kibana are ready for download.
GeoJSON upload is now Generally Available
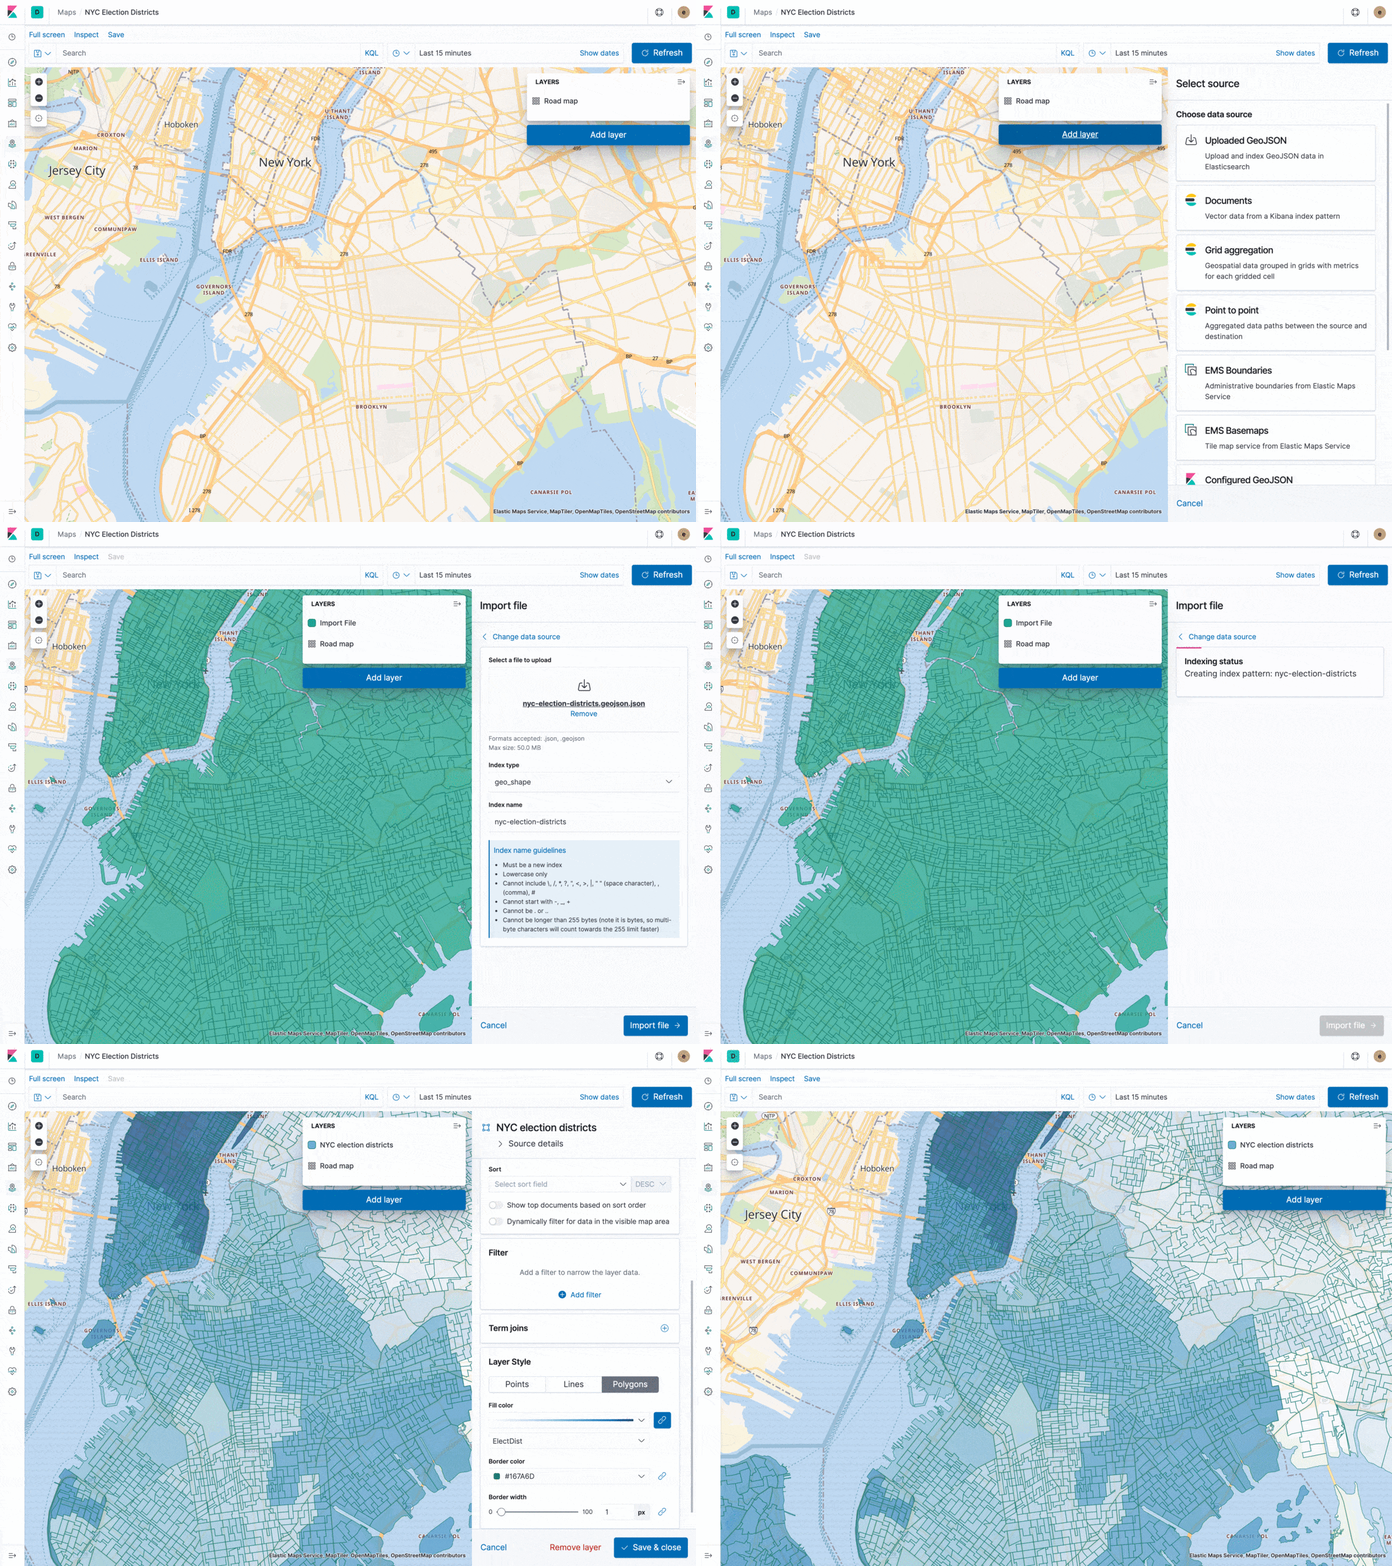
We first added GeoJSON upload as Beta in 7.3, and we’re happy to announce that this feature is now Generally Available with the release of 7.5. It’s the easiest and quickest way to get your own custom vector shapes into Elasticsearch and onto your Maps. Just drag-and-drop to add sales regions, service areas, or other polygon or line data -- then use term joins and filter by geometry to leverage them for analysis with your other map layers. As part of the GA release, we now use a streaming GeoJSON parser to ensure smooth, stable uploads from your browser.

Style documents by date and time fields
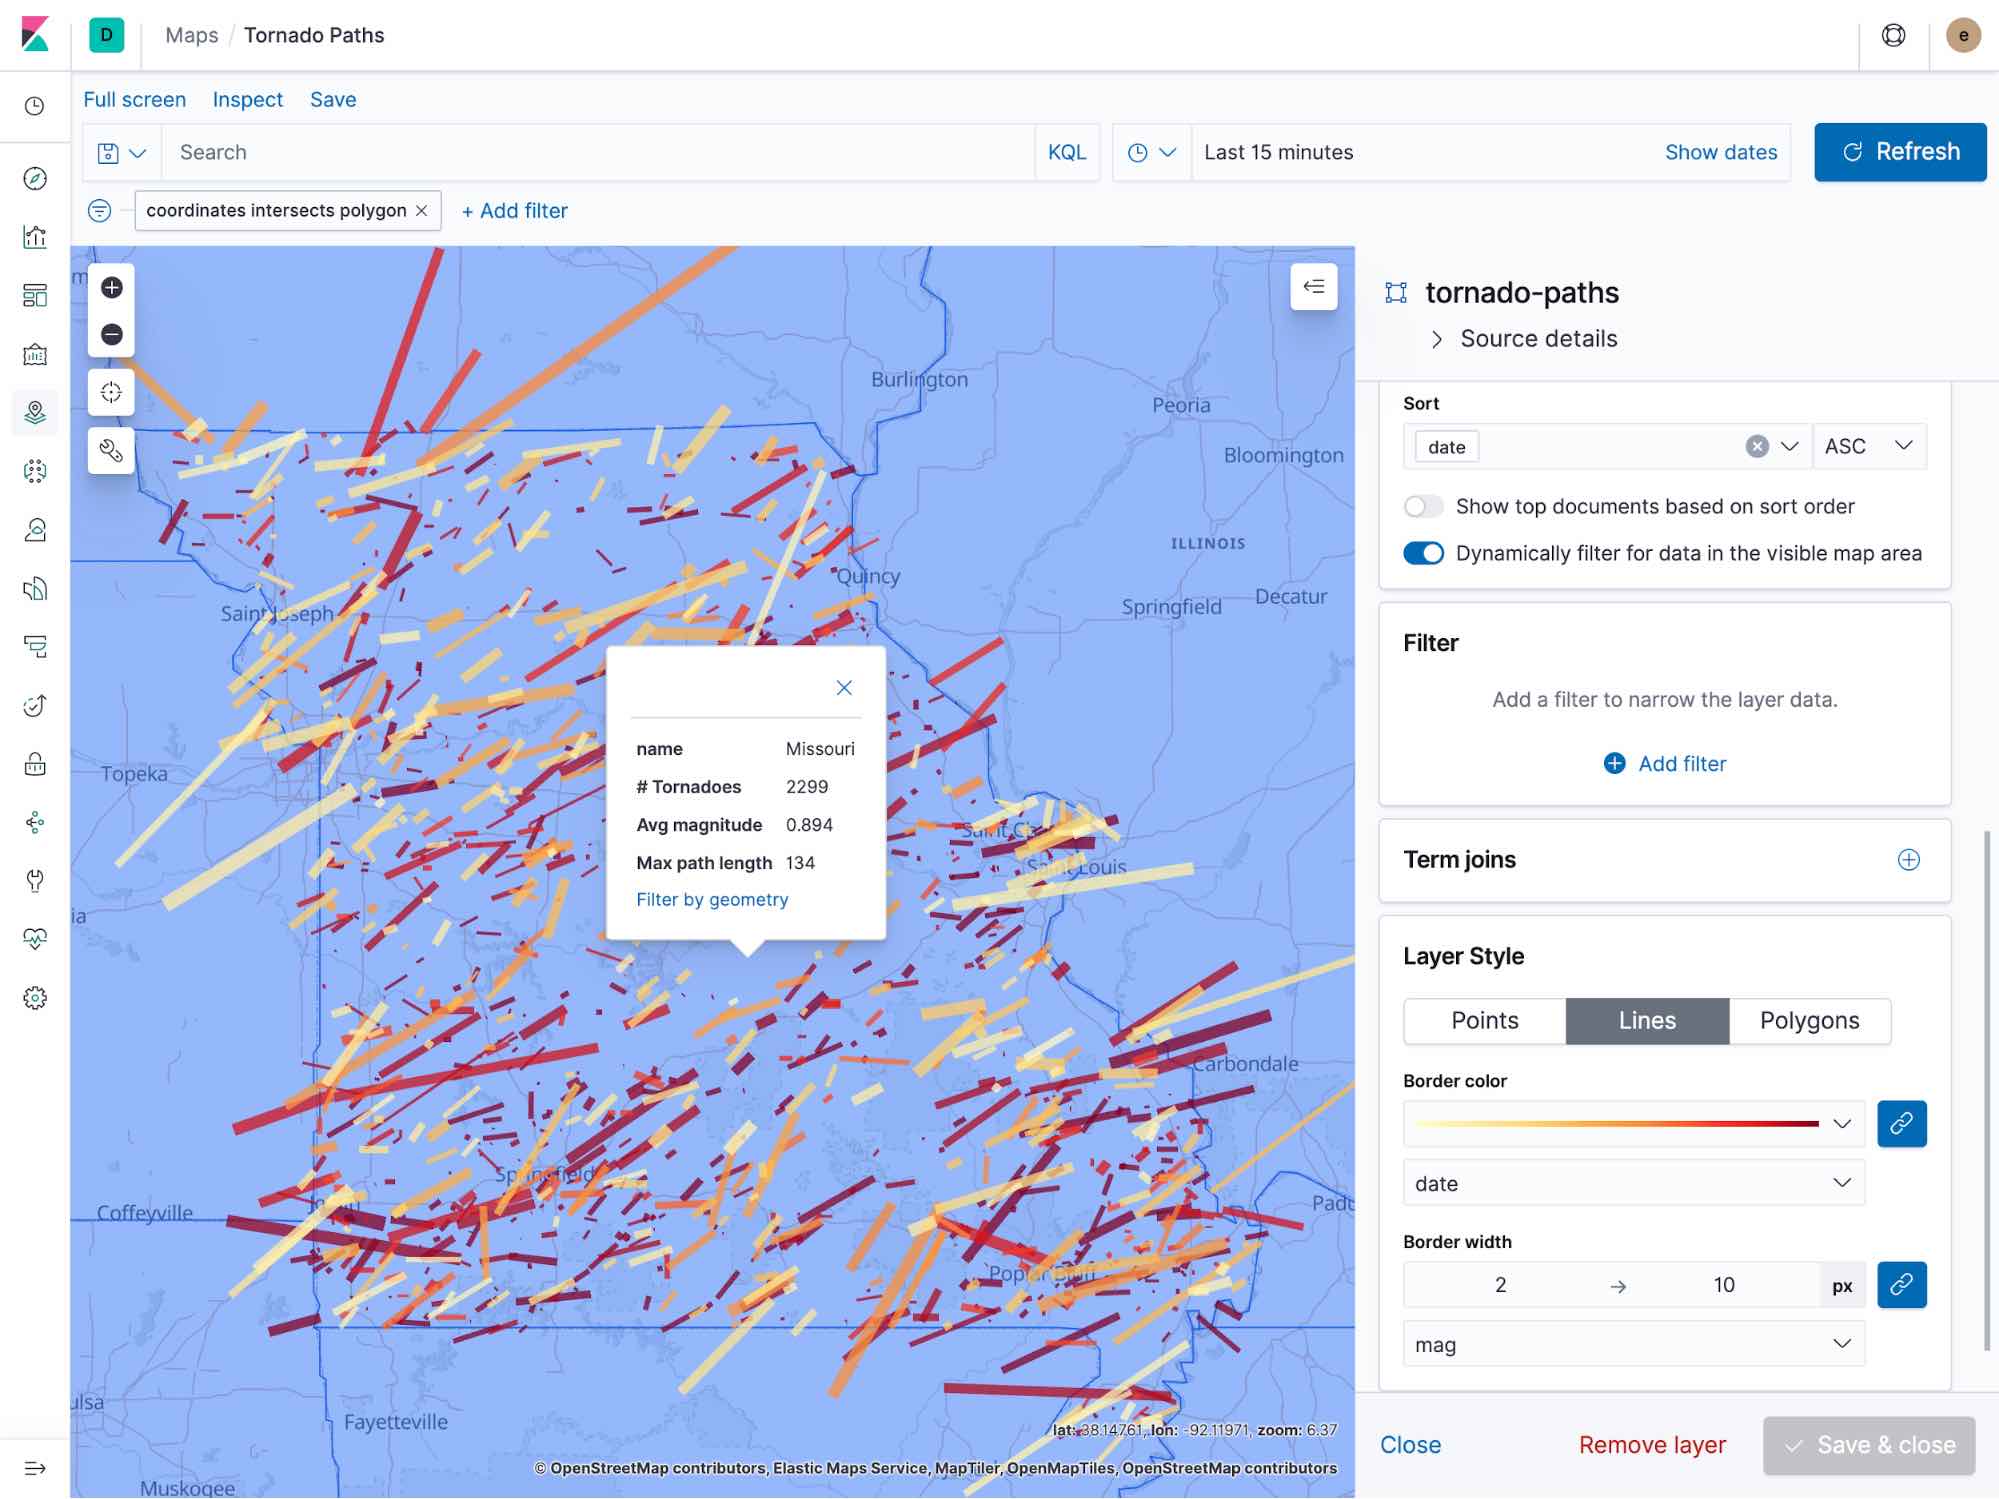
Map symbols and icons for Elasticsearch document layers can now be styled by date and time fields. This is a great option for asset tracking or other time series data. For instance, you could use color or size to emphasize the last 5 locations of a vehicle, or to highlight newer data points over older ones.

Put your most important data on top
Often times, you may be more interested in certain data points than others, like higher severity incidents, or recently updated documents. To support this we’ve added the ability to order the results for Elasticsearch document layers by any sortable field (numeric or date), giving you more control over how and which data is displayed, and ensuring your most important data is on top of the map and most prominent. It also avoids cases where critical data points are cluttered or hidden in a dense map, or dropped if the whole result set is too large to display at once.

Customize your tooltips with a fresh design
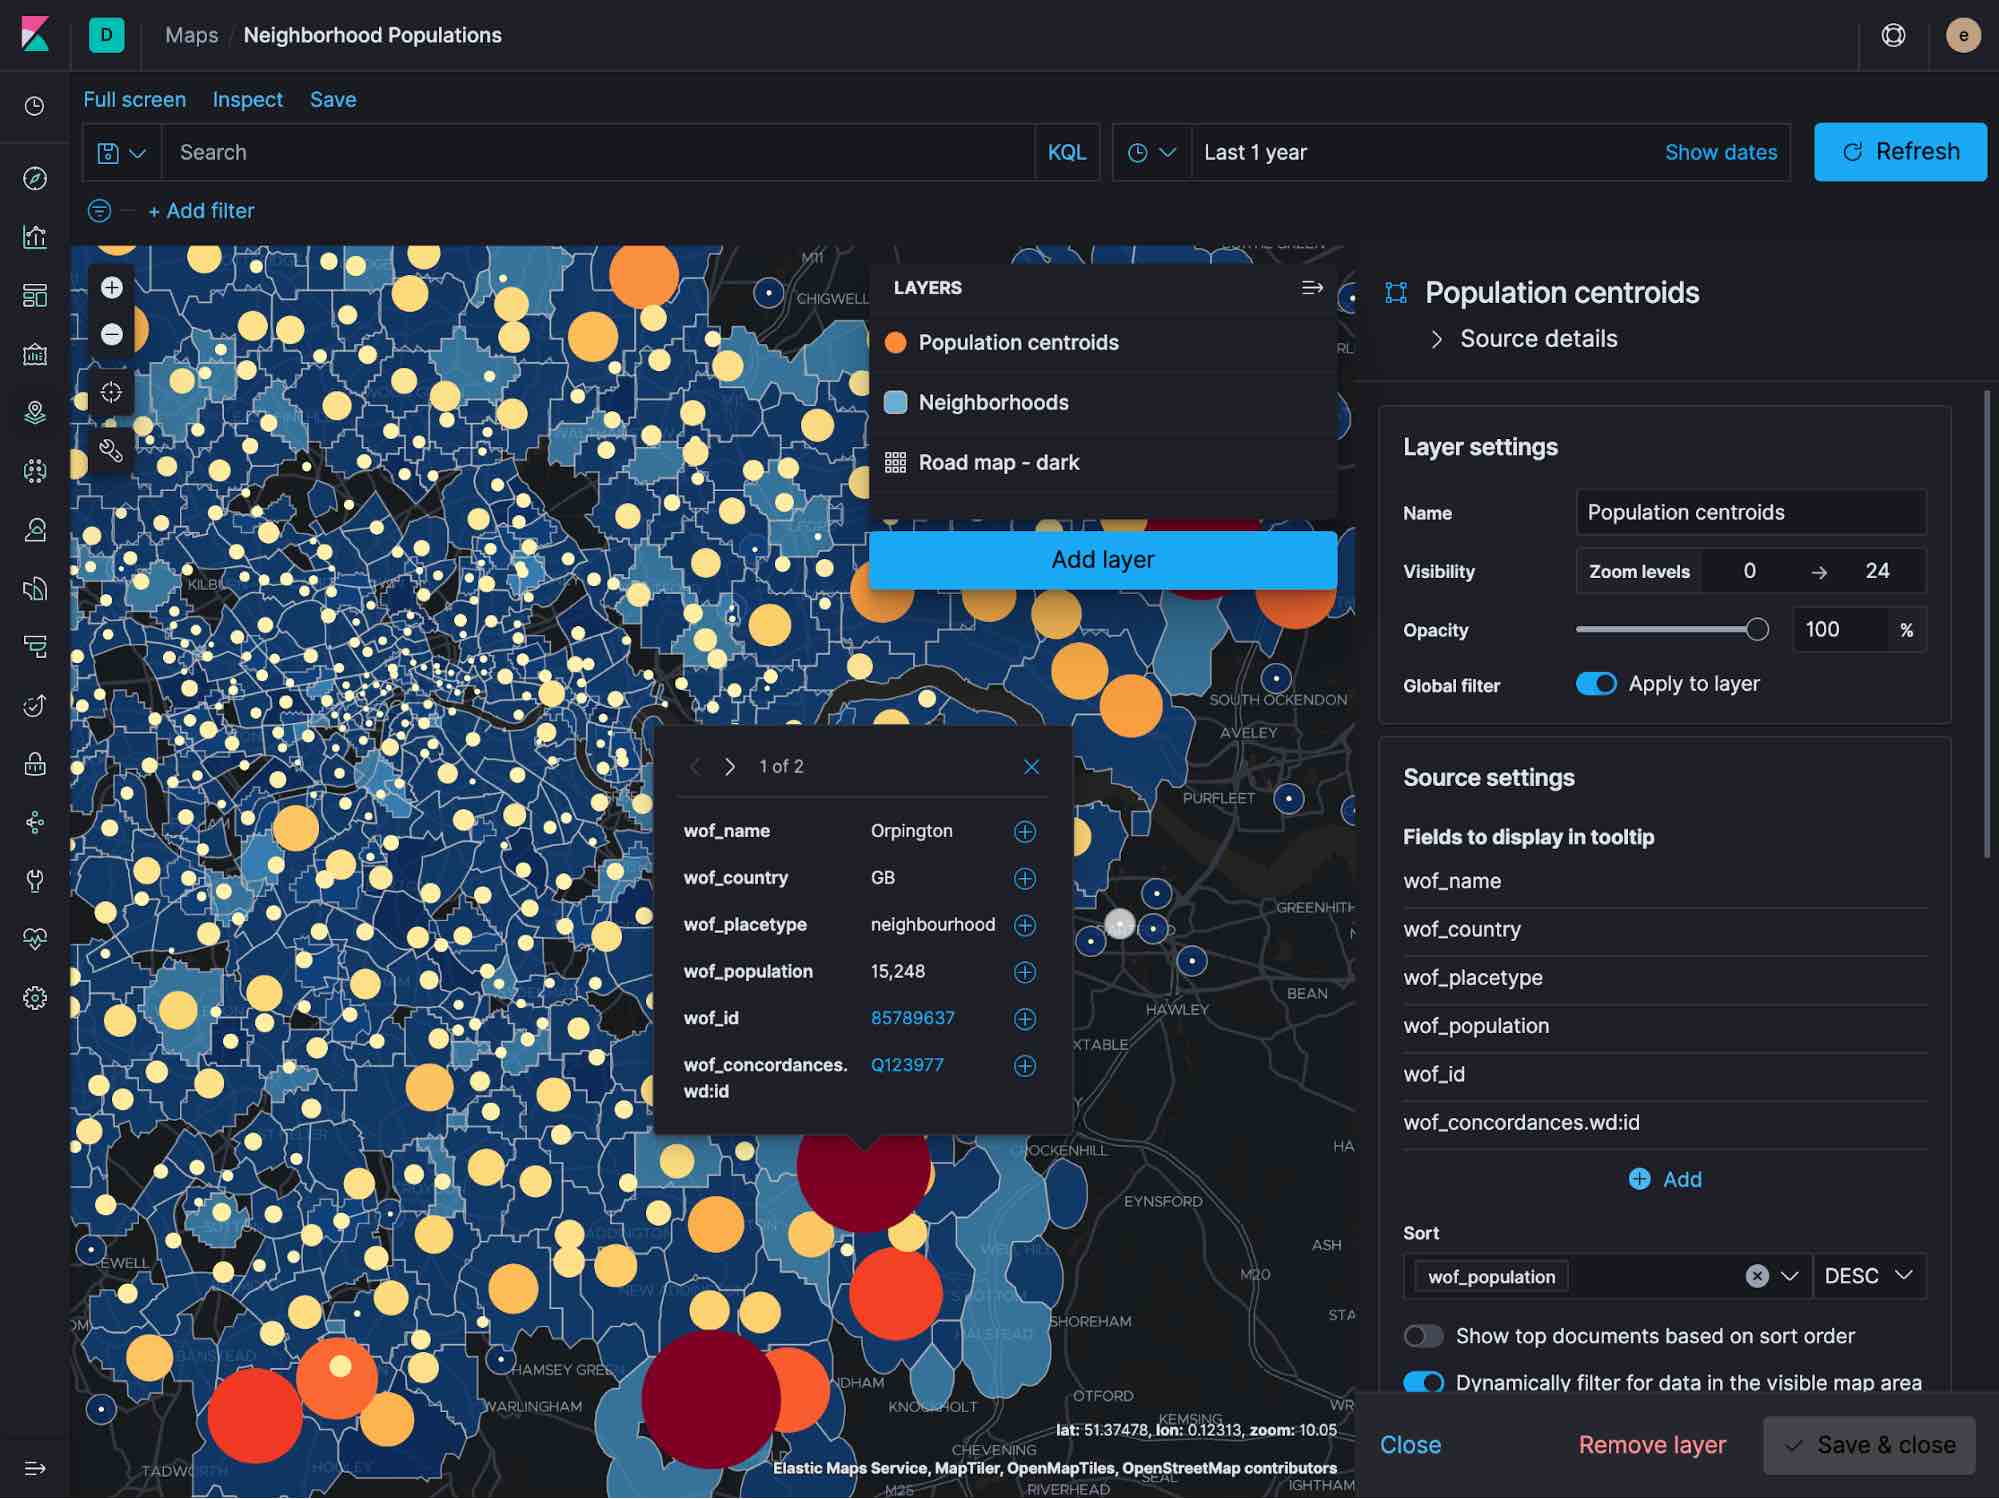
We’re always looking for ways to bring geo data to life and richer tooltips are a perfect example of how we see customers adding incredible depth to their maps. In 7.5 we’ve made several updates to our tooltip experience, with fine-grained controls including:
- Drag-and-drop to reorder your tooltip fields to aid in layer consistency
- Layout improvements to show more of your data, with more compact UI controls
- A new UI for quickly searching and adding tooltip fields
Mapping glory awaits you!
Ready to plot some points and style some layers? Spin up an Elasticsearch cluster on Elastic Cloud or download the Elastic Stack today. Be sure to let us know what you think on Twitter (@elastic) or in our discuss forums. Also, don’t forget to take a look at all the other great things getting released today by checking out the 7.5 Release Highlights blog post.