Elastic Metrics 7.5.0 released
Good news everyone! A new release of Elastic Metrics (formerly Infrastructure) 7.5.0 is now available on the Elasticsearch Service, or as part of the default distribution of the Elastic Stack. Debuting in this release is the brand new and powerful Azure integration for collecting metrics and logs from Azure workloads. We’ve also improved our curated Metrics app and added many handy features to existing integrations.
Infrastructure app is renamed to Metrics
Our Infrastructure app is evolving at a very fast pace, and it now covers more than just infrastructure monitoring. With every new release of Elastic Stack we’re adding more cloud and service integrations resulting in a wider range of collected metrics. Today the app is more than just preconfigured resource-centric views — it provides ad-hoc metrics exploration and support for service monitoring.
As part of this growth and the expanding scope, in 7.5 we decided to rename the Infrastructure app to Metrics. Some of these changes have already been reflected on our website.
Azure Cloud monitoring
We’re excited to add Azure to our library of cloud integrations! Azure is one of the largest public cloud providers, and adding its support to Metricbeat is crucial not only for monitoring Azure workloads but also for enabling hybrid cloud observability. The Azure module automatically collects all metrics from multiple Azure accounts and workloads into Elasticsearch where they can be further used for analysis, visualization, and alerting. It also provides a set of preconfigured Kibana dashboards that make monitoring Azure resources a smoother experience. Under the hood, the module connects to Azure Monitor and retrieves all metrics, tags, and other relevant metadata via the Azure APIs.
The central metricset in this module is monitor, which can be used for querying metrics from any types of resources available with the Azure Monitor’s metric pipeline. The strength of monitor is in its rich set of configuration options for setting the interval of retrieving metrics, metric names, aggregation lists, namespaces, metric dimensions, and more. The metricset offers multiple ways of defining what resources it should monitor, such as the following:
- resource_query: "resourceType eq 'Microsoft.DocumentDb/databaseAccounts' and name eq 'databaseAccount'"
  metrics:
  - name: ["DataUsage", "DocumentCount", "DocumentQuota"]
    namespace: "Microsoft.DocumentDb/databaseAccounts"
This example tells the metricset to collect only three metrics for all resources whose type is database accounts.
While the monitor metricset can be used for monitoring any resources in Azure cloud, it still makes sense to have a predefined configuration for commonly used resource types, such as virtual machines. For that we’ve added two additional metricsets for monitoring Azure virtual machines and virtual machine scale sets. (Note that if guest metrics are enabled on Windows machines, they will be automatically picked up by these metricsets.) We will be continuously growing our list of resource-specific metricsets in the future releases.
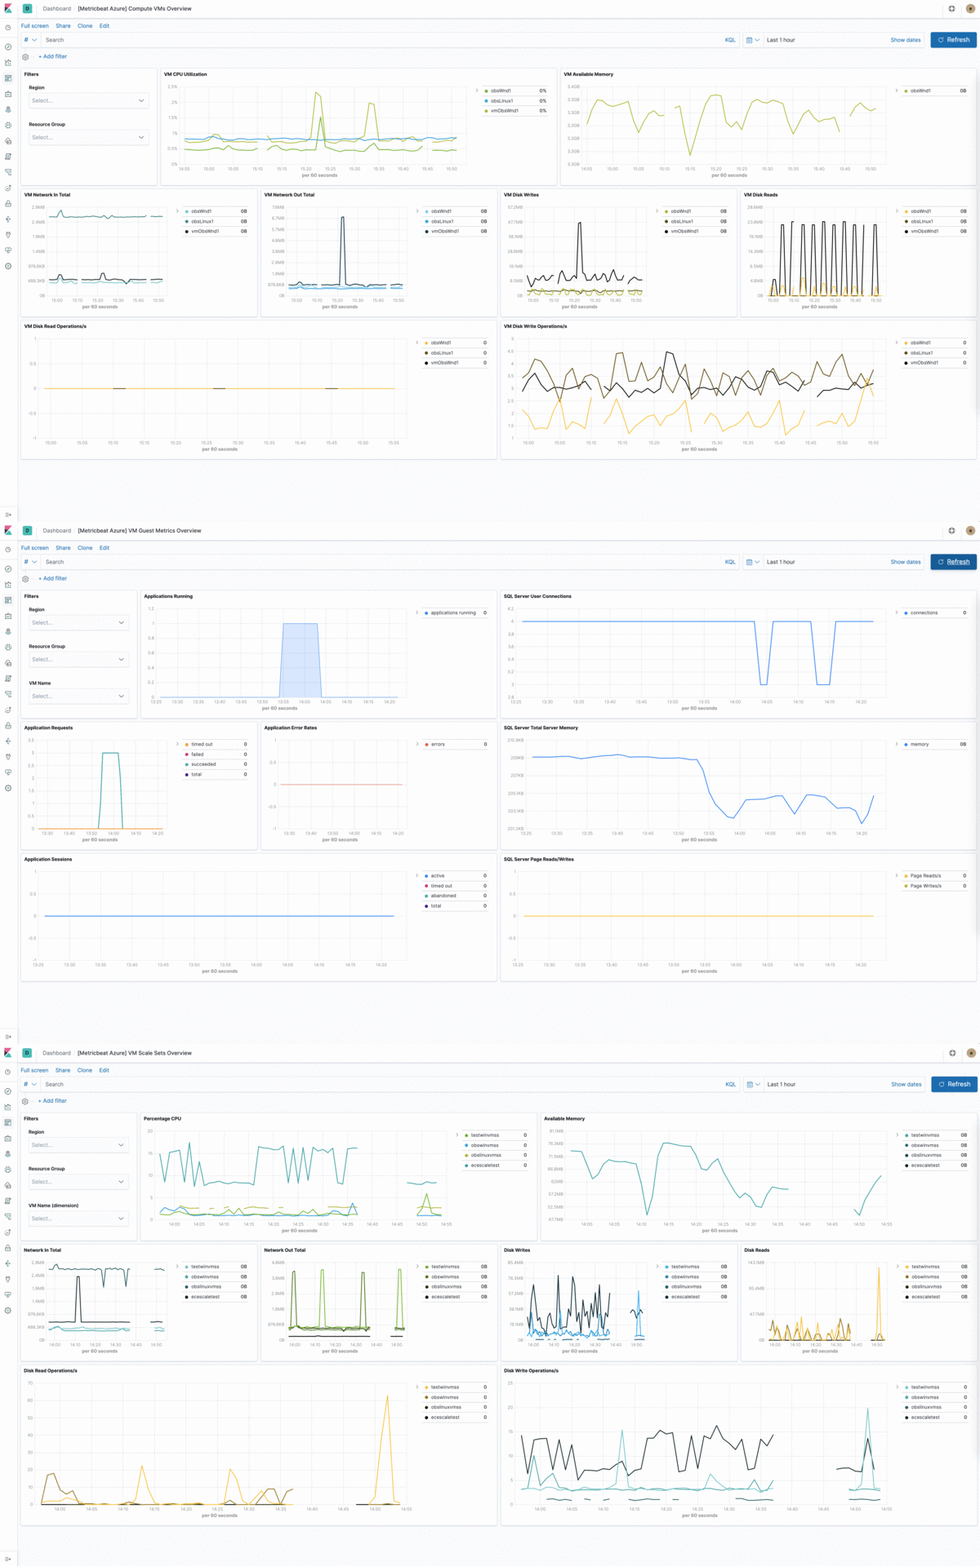
The Azure module comes with several predefined dashboards for virtual machines: VM Guest Metrics and VM Scale Sets. The VM overview dashboard shows information about CPU, memory, and disk usage, as well as operations per second. The three available filters help narrow down the dashboard to specific regions, resource groups, and resource names. If VM guest metrics are enabled, then the Guest Metrics Overview dashboard can help with monitoring ASP.NET applications and SQL Server metrics. The VM Scale Sets dashboard is similar to the VM dashboard and shows relevant health information about running VM scale sets.

Wait, what about my Azure logs? Glad that you asked. In 7.5 we’re also making available the new Filebeat module for Azure logs to help you keep track of any infrastructure changes and authorization activities in your Azure cloud environment. For more details, check out our Elastic Logs release blog.
Persistent views in Inventory and Metrics Explorer
Inventory and Metrics Explorer provide powerful and flexible views for browsing your physical or virtual resources, services, and metrics. Previously, when working with multiple metrics and resource types, users had to manually change filters, groupings, and selected metrics — a repetitive and time-consuming exercise that begged for improvement.
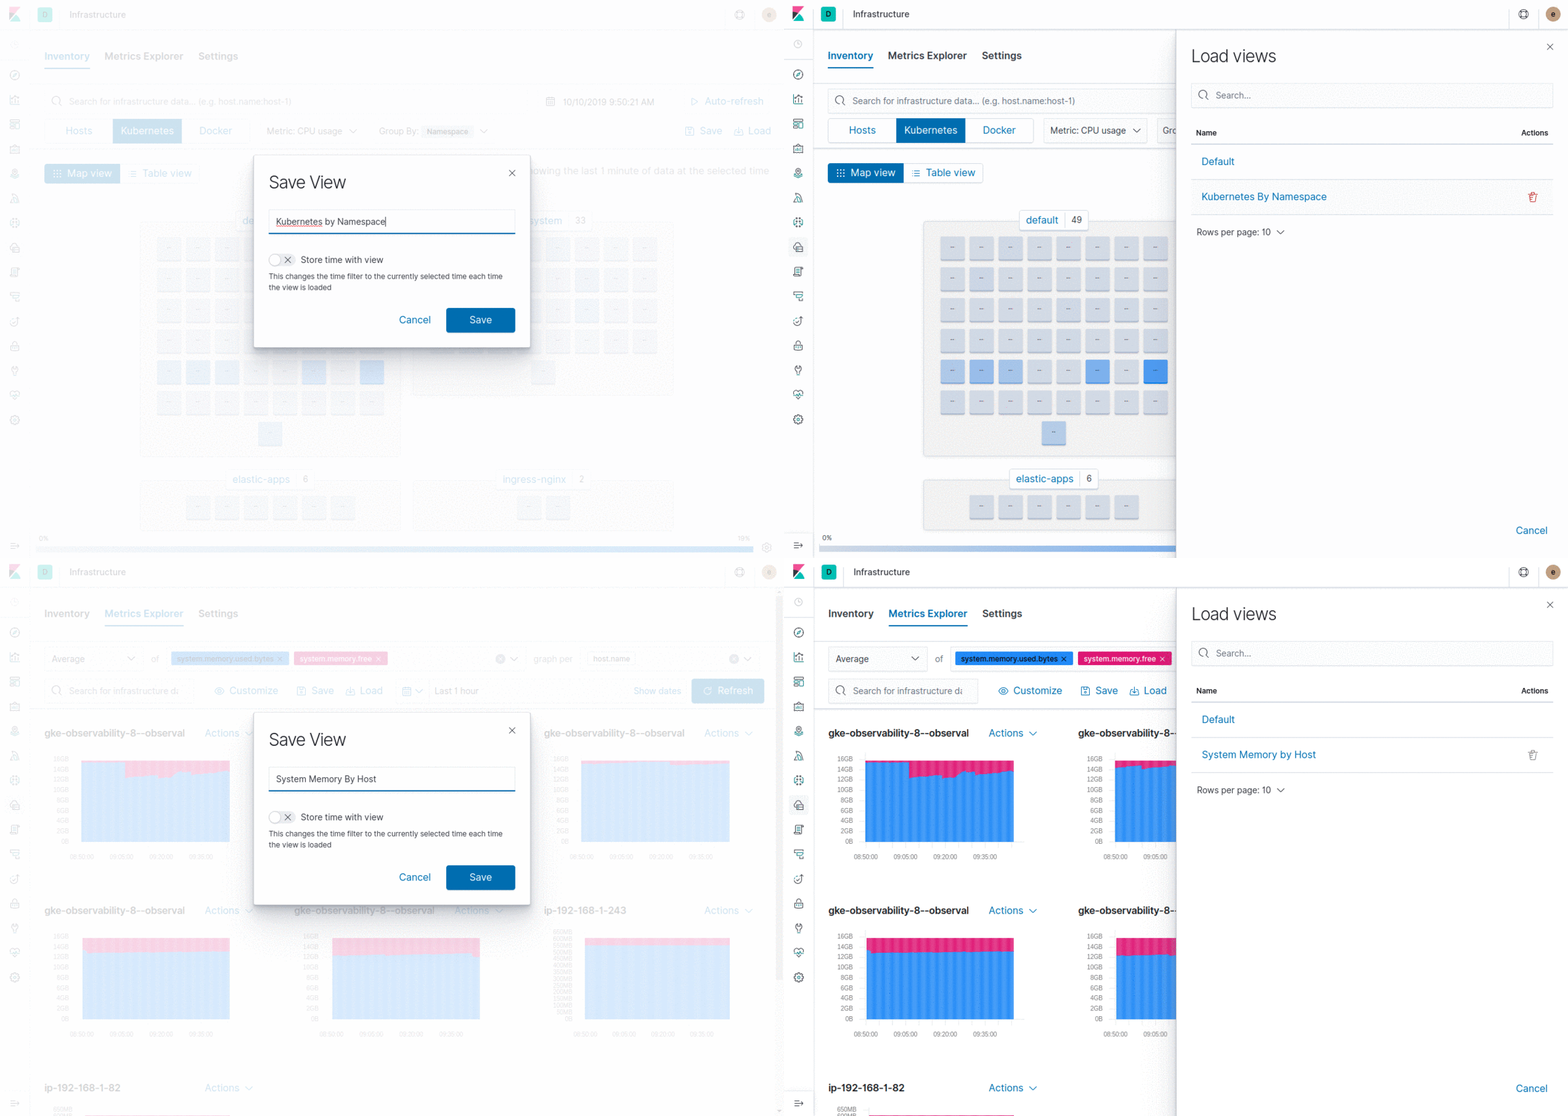
In 7.5 we’ve added the ability to save and load user-defined states of these views. Now users can store multiple configurations for Inventory and Metrics Explorer views and load them at any time.

Bar charts in Metrics Explorer
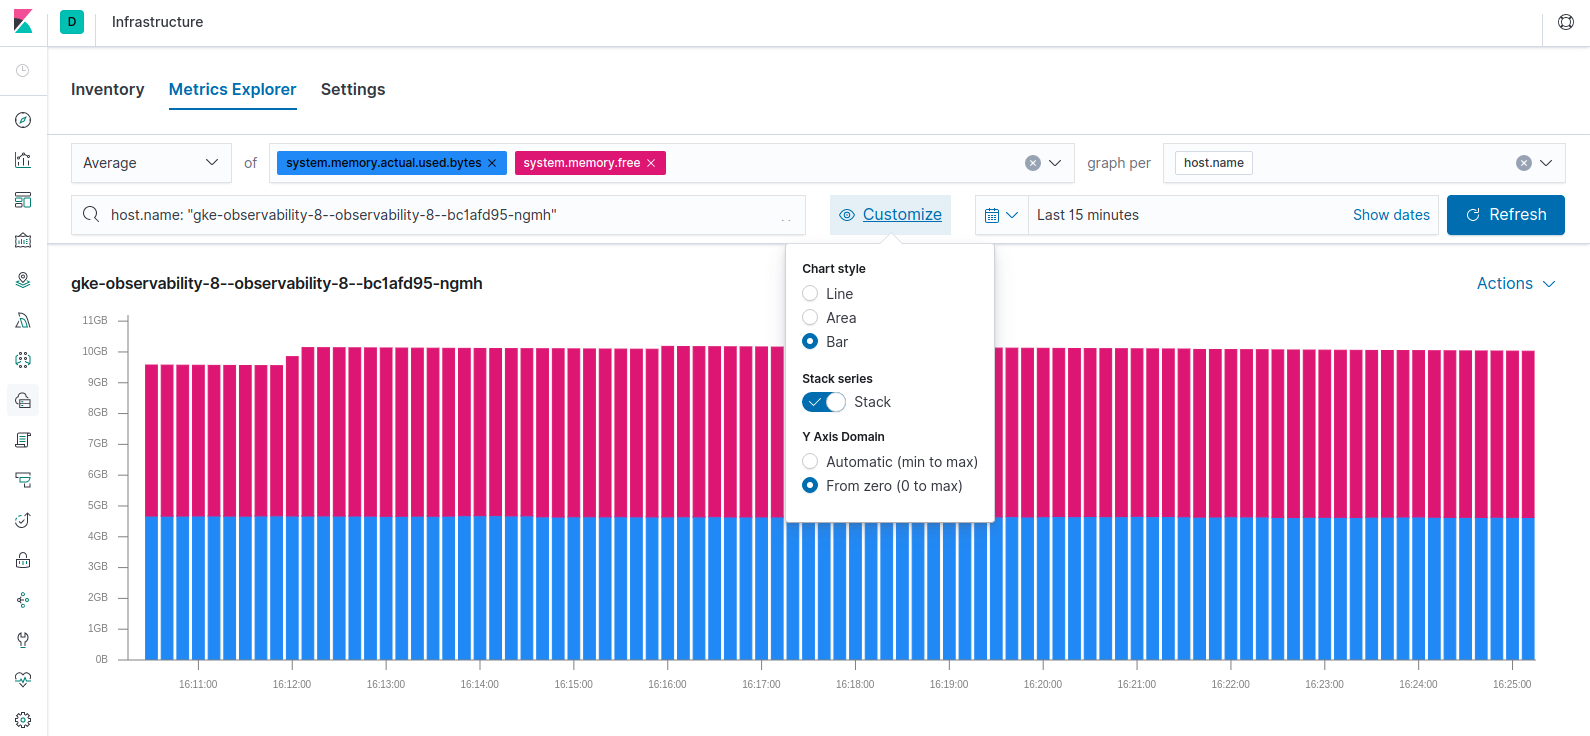
Some types of metrics are better visualized using bar charts, such as when metrics are collected at irregular intervals or when metrics represent counts rather than gauges. For such cases we’ve added support for bar charts in Metrics Explorer to visualize sparse measurements and counters in a more meaningful way. They can also be useful for comparisons of data with stacked charts (such as memory free vs. memory used):

AWS tags and metadata
AWS tags provide a useful way of adding user context to workloads running on AWS. Almost all types of AWS resources support tagging. Many organizations define special tagging policies that help them distinguish between departments, production vs. lab environments, or application deployments. Resource tagging can also be used for many other purposes, such as reporting, permissions, filtering, and automation.
In 7.5 we’ve added support for tags as filters to the cloudwatch metricset configuration, which allows users to only collect metrics from instances/services that have the tags specified in the config. A simple configuration might look like this:
- module: aws
  period: 300s
  metricsets:
    - cloudwatch
  metrics:
    - namespace: AWS/EC2
      tags.resource_type_filter: ec2:instance
      statistic: ["Average"]
      tags:
        - key: "Name"
          value: "ECS Instance test"
        - key: "Organization"
          value: "Engineering"
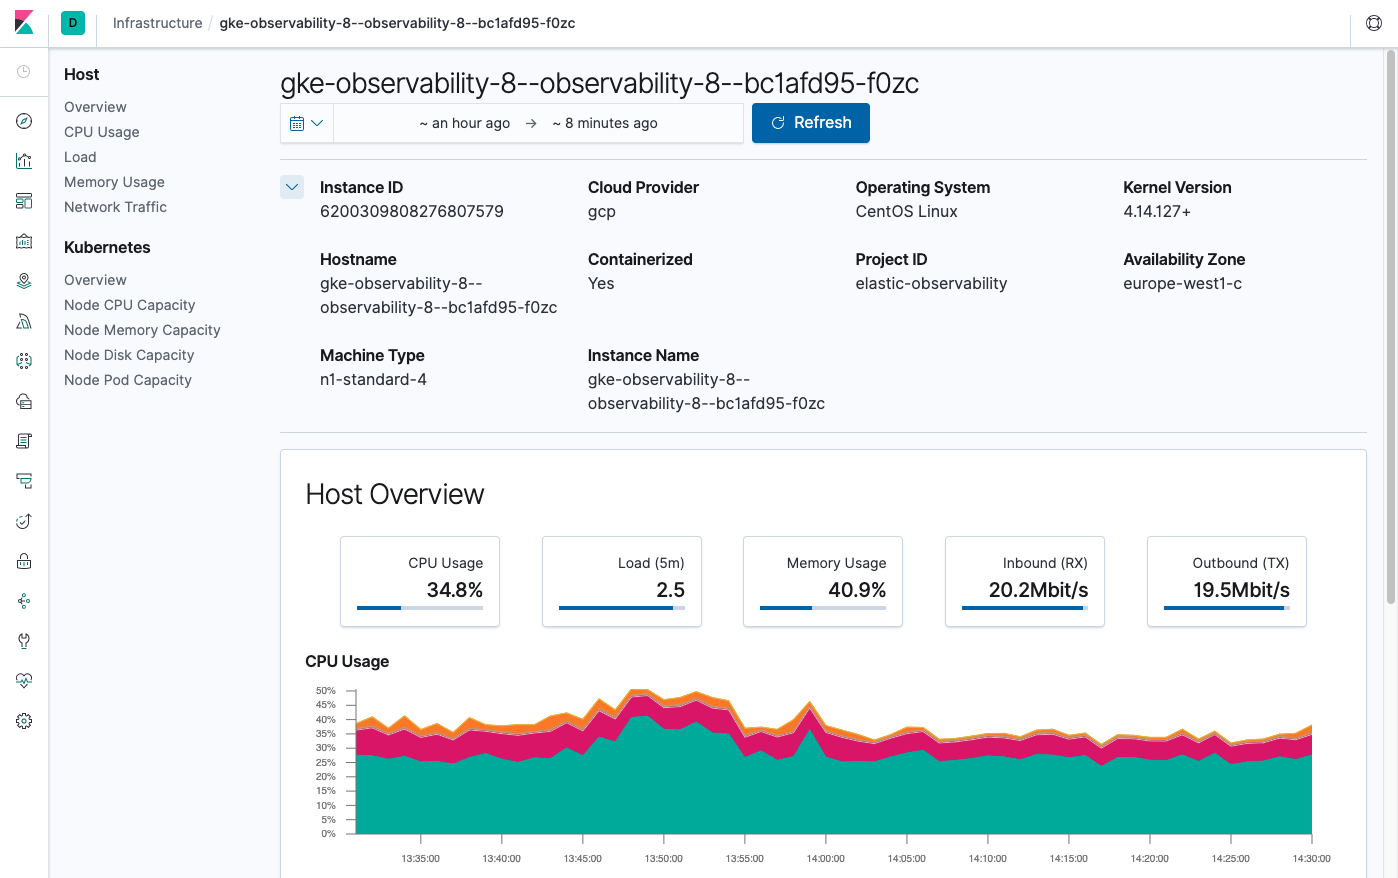
We’ve also updated the Node Details sections in the UI with non-metric-related resource metadata, such as instance id, instance type, operating system, availability zone, cloud provider, and others.

Improved Kubernetes observability
Kubernetes resource quotas are a tool for a Kubernetes operator to help enforce fair usage of a limited-node cluster shared across multiple teams. Now this information is part of our Kubernetes integration.
This release continues expanding our observability capabilities of Kubernetes environments by adding support for the resource quotas metrics of the excellent kube-state-metrics agent. This new resource quota metricset supports all fields exposed by the kube-state-metrics agent with the kubernetes.resourcequota.* prefix.
Additionally we’ve added two ECS fields — container.id and container.runtime — to the state_container metricset, which improves correlation between Docker metrics and Kubernetes logs.
Make it yours
You can access the latest version of the Elastic Metrics application on the Elasticsearch Service on Elastic Cloud by creating a new cluster, or upgrading an existing cluster the day of release, or you can download it as part of the default distribution of the Elastic Stack.
Related blogs: