Know your tools: The full range of Elastic Security’s detection engineering capabilities
Learn about our features and see if you know all the detection tooling Elastic Security has to offer.

Modern security teams face an ever-evolving threat landscape where the ability to detect and respond to attacks quickly is more important than ever. Elastic Security is designed to help detection engineers — and anyone else responsible for security operations — build, manage, and optimize detection rules at scale so that you can focus on what matters most: protecting your organization.
With powerful features like customizable prebuilt rules, alert suppression, automated response actions, and AI-driven assistance, Elastic Security streamlines detection engineering workflows and empowers teams to stay ahead of threats, reduce alert fatigue, and continuously improve their security posture. This blog covers the detection engineering toolset available in Elastic Security.
First, let's briefly go through the recently added detection engineering capabilities in Elastic Security.
Prebuilt rules customization allows you to seamlessly modify any prebuilt rule parameters without the need to duplicate the rule and provides the ability to merge your changes with the incoming rule updates from Elastic.
Alert suppression is available for all detection rule types. With suppression, you can reduce the volume of similar alerts (per rule run or window of time), resulting in decreased alert fatigue and time-efficient alert triage. Suppression capabilities require a Platinum or higher license tier.
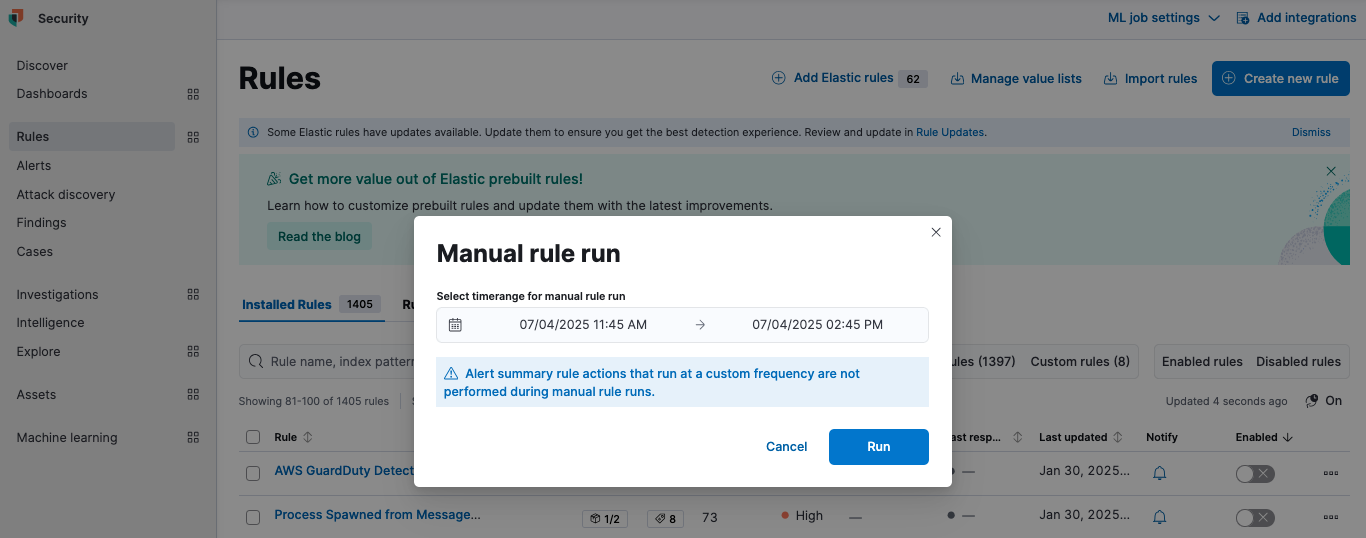
- With manual rule runs, you can now test your rule or rerun it over the selected period up to 90 days in the past, which helps detection engineers assess the quality and noise level of the newly designed rule using historical events. This functionality is available at the Standard tier.
- Security teams can now automatically create a case for Elastic Security alerts to streamline investigations with aggregation capabilities that combine multiple alerts into a single case.
Now that we’ve highlighted these new features, we’ll dive deeper into all of the threat detection capabilities.
Getting started with the prebuilt Elastic rules
If you just started using Elastic Security, we got you covered with initial detection rules selection.
Out of the box, Elastic provides more than 1,300 SIEM detection rules across 54 different data sources and over 70 machine learning jobs — both trained models and anomaly detection jobs — to get started.
You can choose which rules to install and preview their content to understand the logic and additional details.
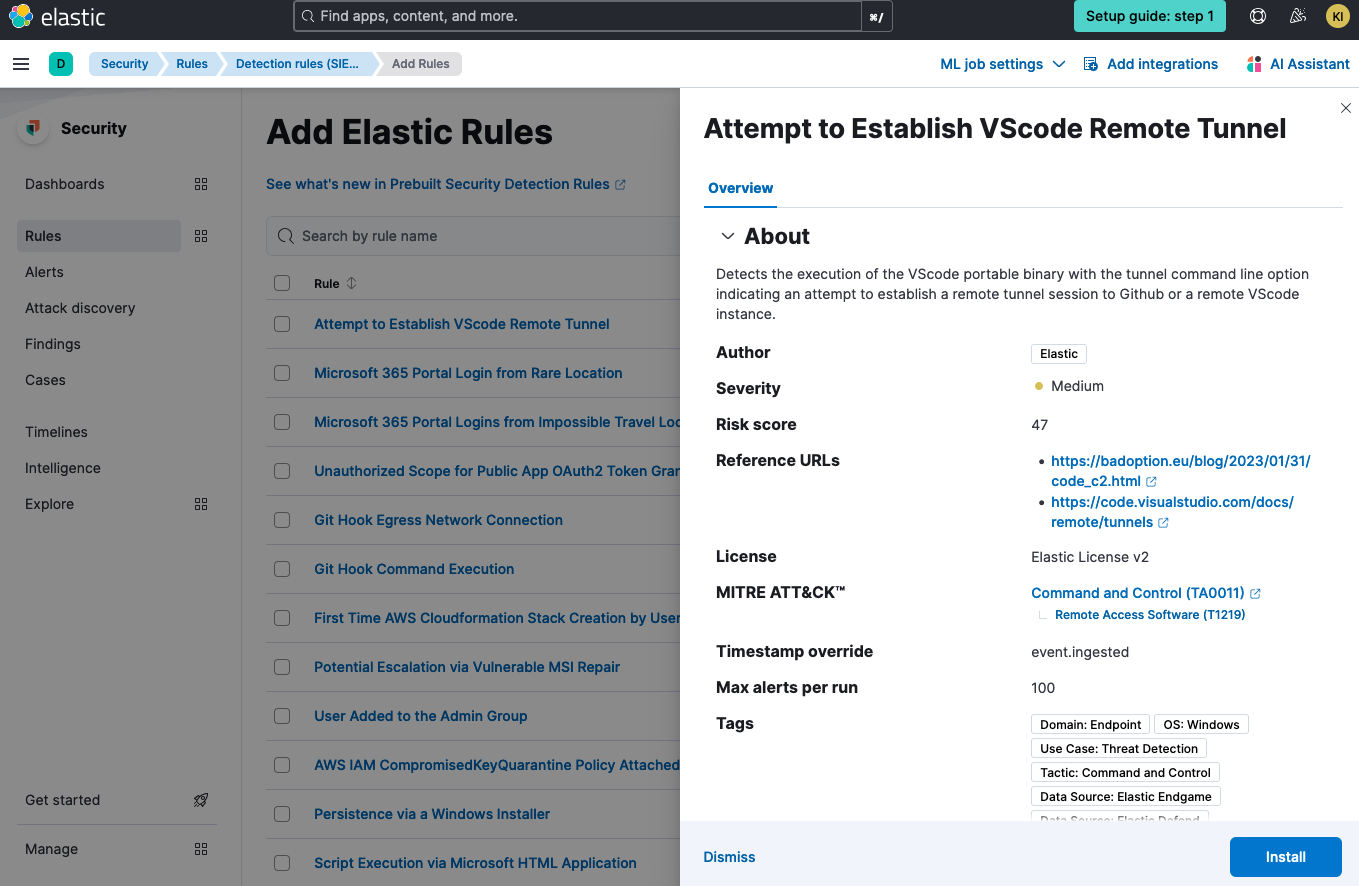
When you are installing the rule, you can immediately enable it at the time of installation.

Rules shipped by Elastic provide additional context explaining the rule prerequisites and providing advice on alert investigation — users can check the required data source integrations, setup, and investigation guides for this information. Our rules are mapped to the relevant MITRE ATT&CK tactics, techniques, and subtechniques, where those can be clearly defined.
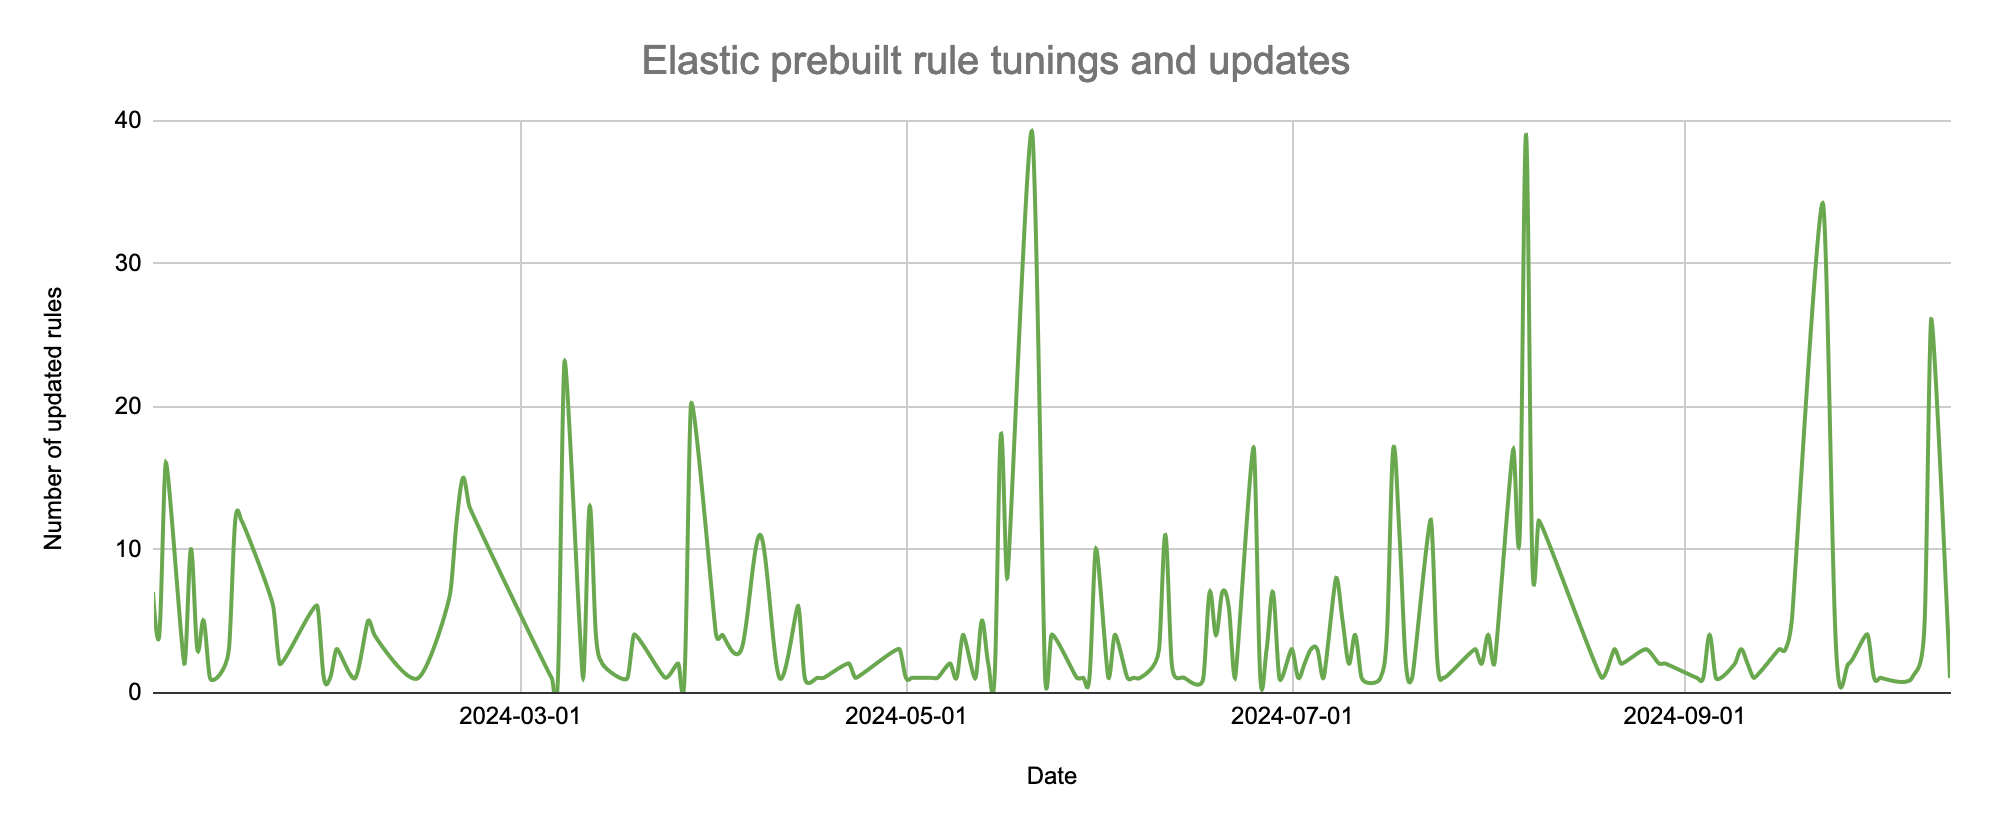
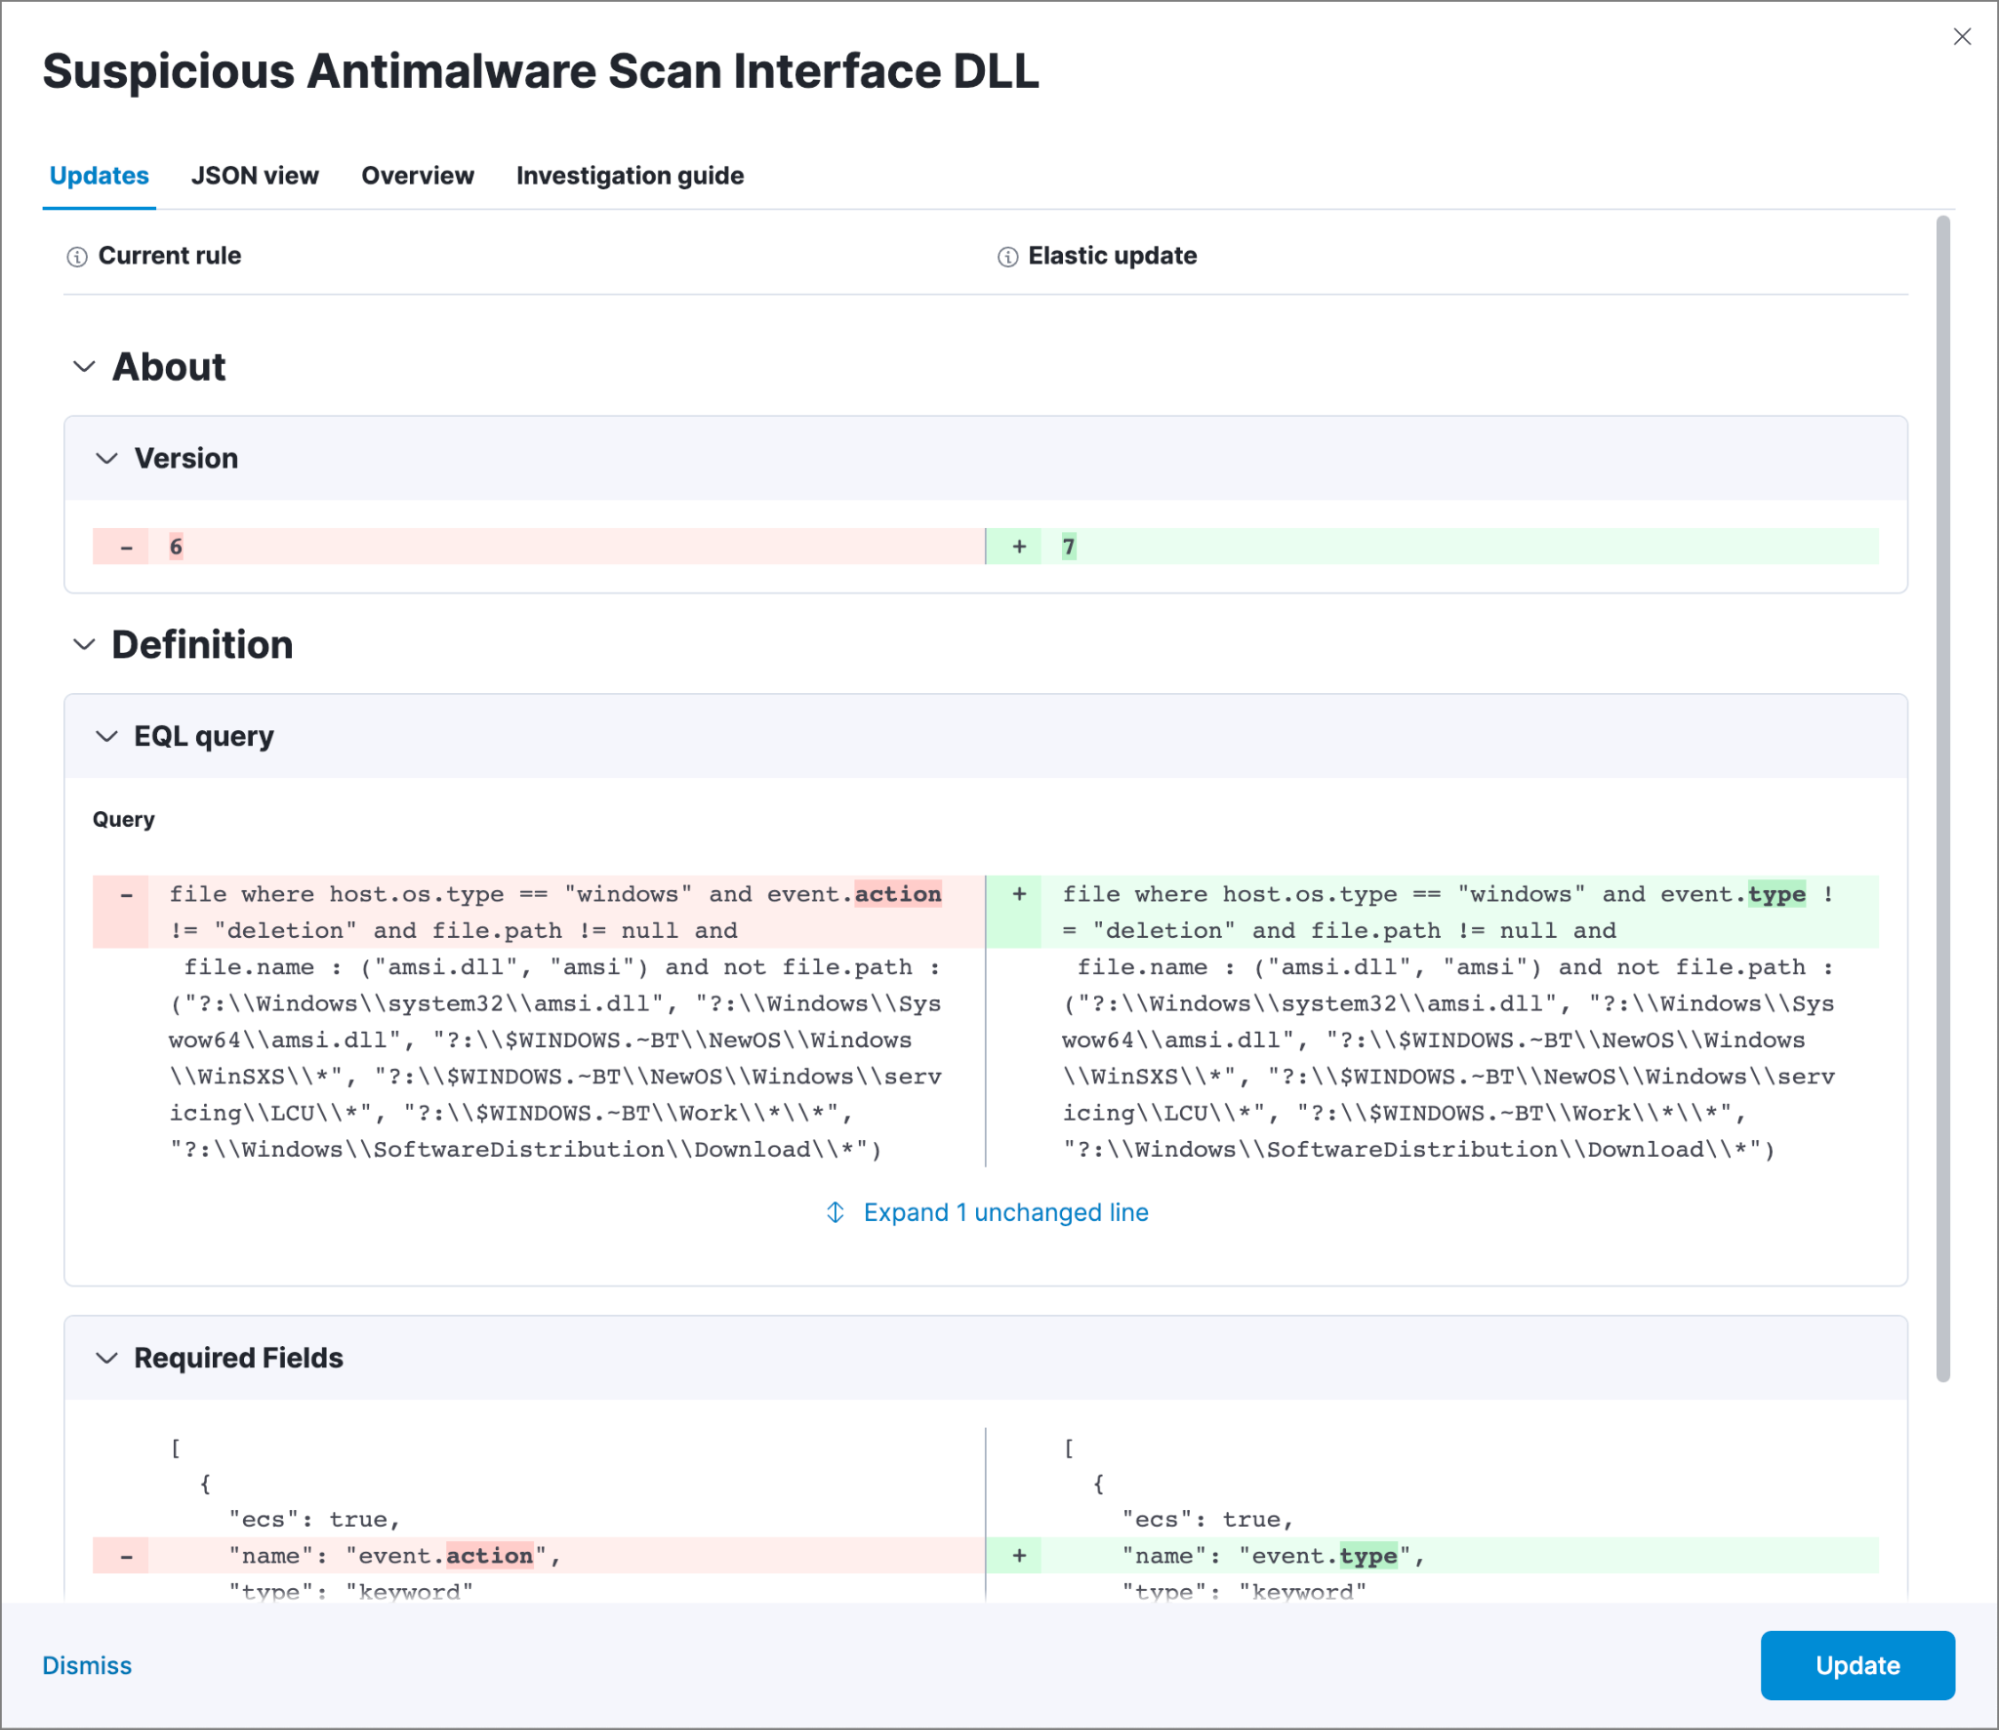
With Elastic Security’s prebuilt rules, we continuously research threats, update and tune existing rules, and add new ones. We listen to our community’s feedback and constantly look for the false positive reduction possibilities and performance improvements, which are reflected in the rule query updates.
With biweekly updates, you can always see what exactly has changed in the rule in a convenient side-by-side view as shown below.
If you have suggestions or feedback or want to contribute, you can always open an issue in the public detection rules repository and follow our development process there.
Using detection rules, you will notice that some rules mark alerts as building blocks, which means they are not meant for triage and/or investigation and will not show up in the default Alerts view.

Building block rules (BBR) are there to elevate atomic activity for threat-hunting purposes and influence risk scores of entities. You can build more robust rules on top of such building block alerts.
If you are interested in more threat-hunting use cases, read this article and visit the threat hunting folder of the detection rules repository to check out the hunting library.
Customizing prebuilt rules
Elastic Security allows editing of the out-of-the-box detection rules to suit your needs without duplication and additional maintenance burden. Customized rules keep receiving Elastic updates, and the curated upgrade experience allows you to merge your changes with incoming tunings.
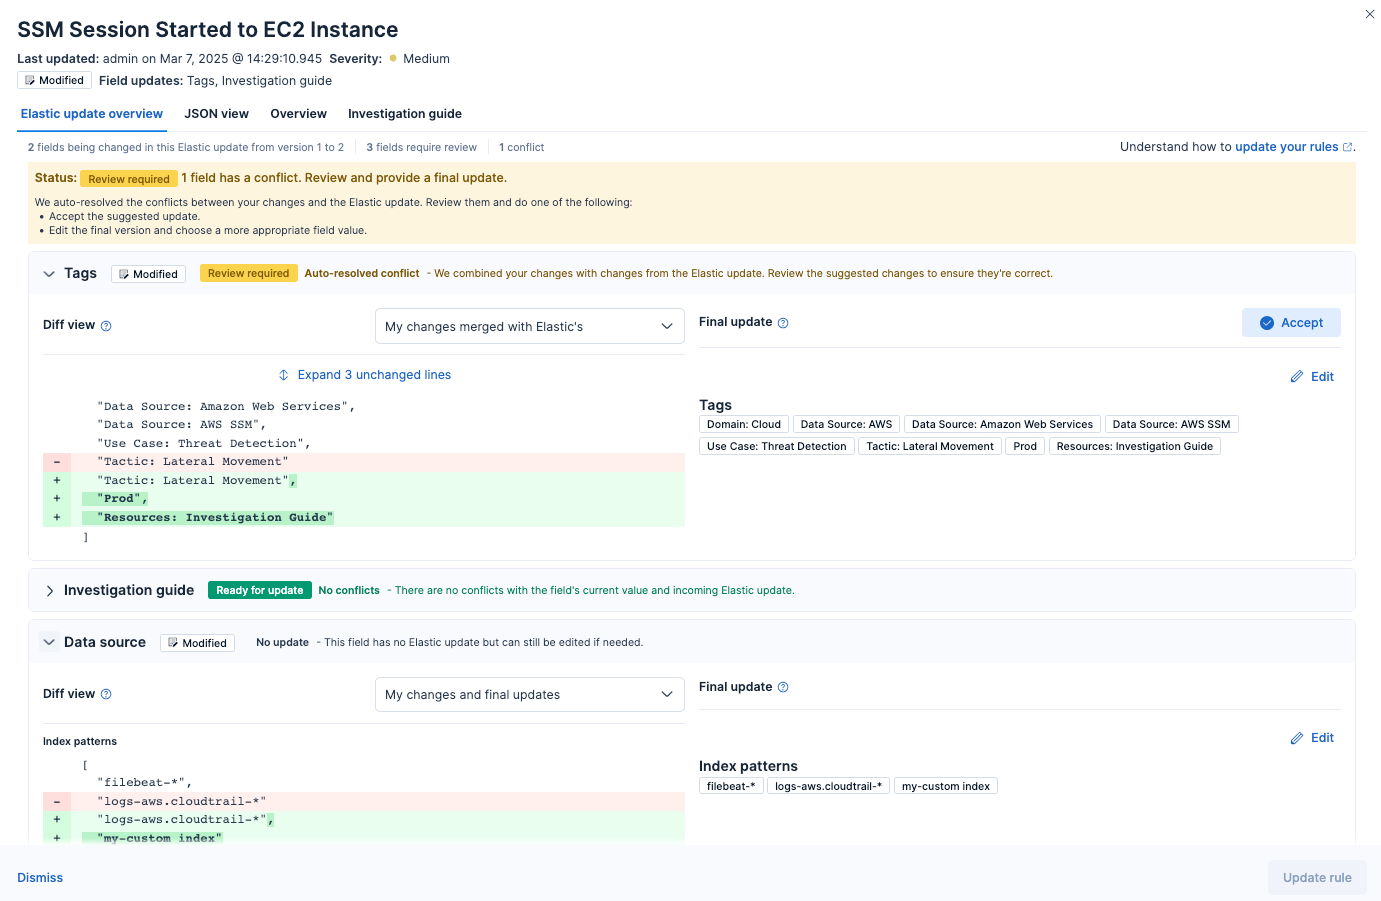
Expanding detection coverage with custom rules
With the basic coverage provided by Elastic Security’s out-of-the-box rules, you will typically need additional rules to accommodate your specific use cases or the technology that you need to monitor. This is where our advanced correlation capabilities come in handy to find threats and anomalies.
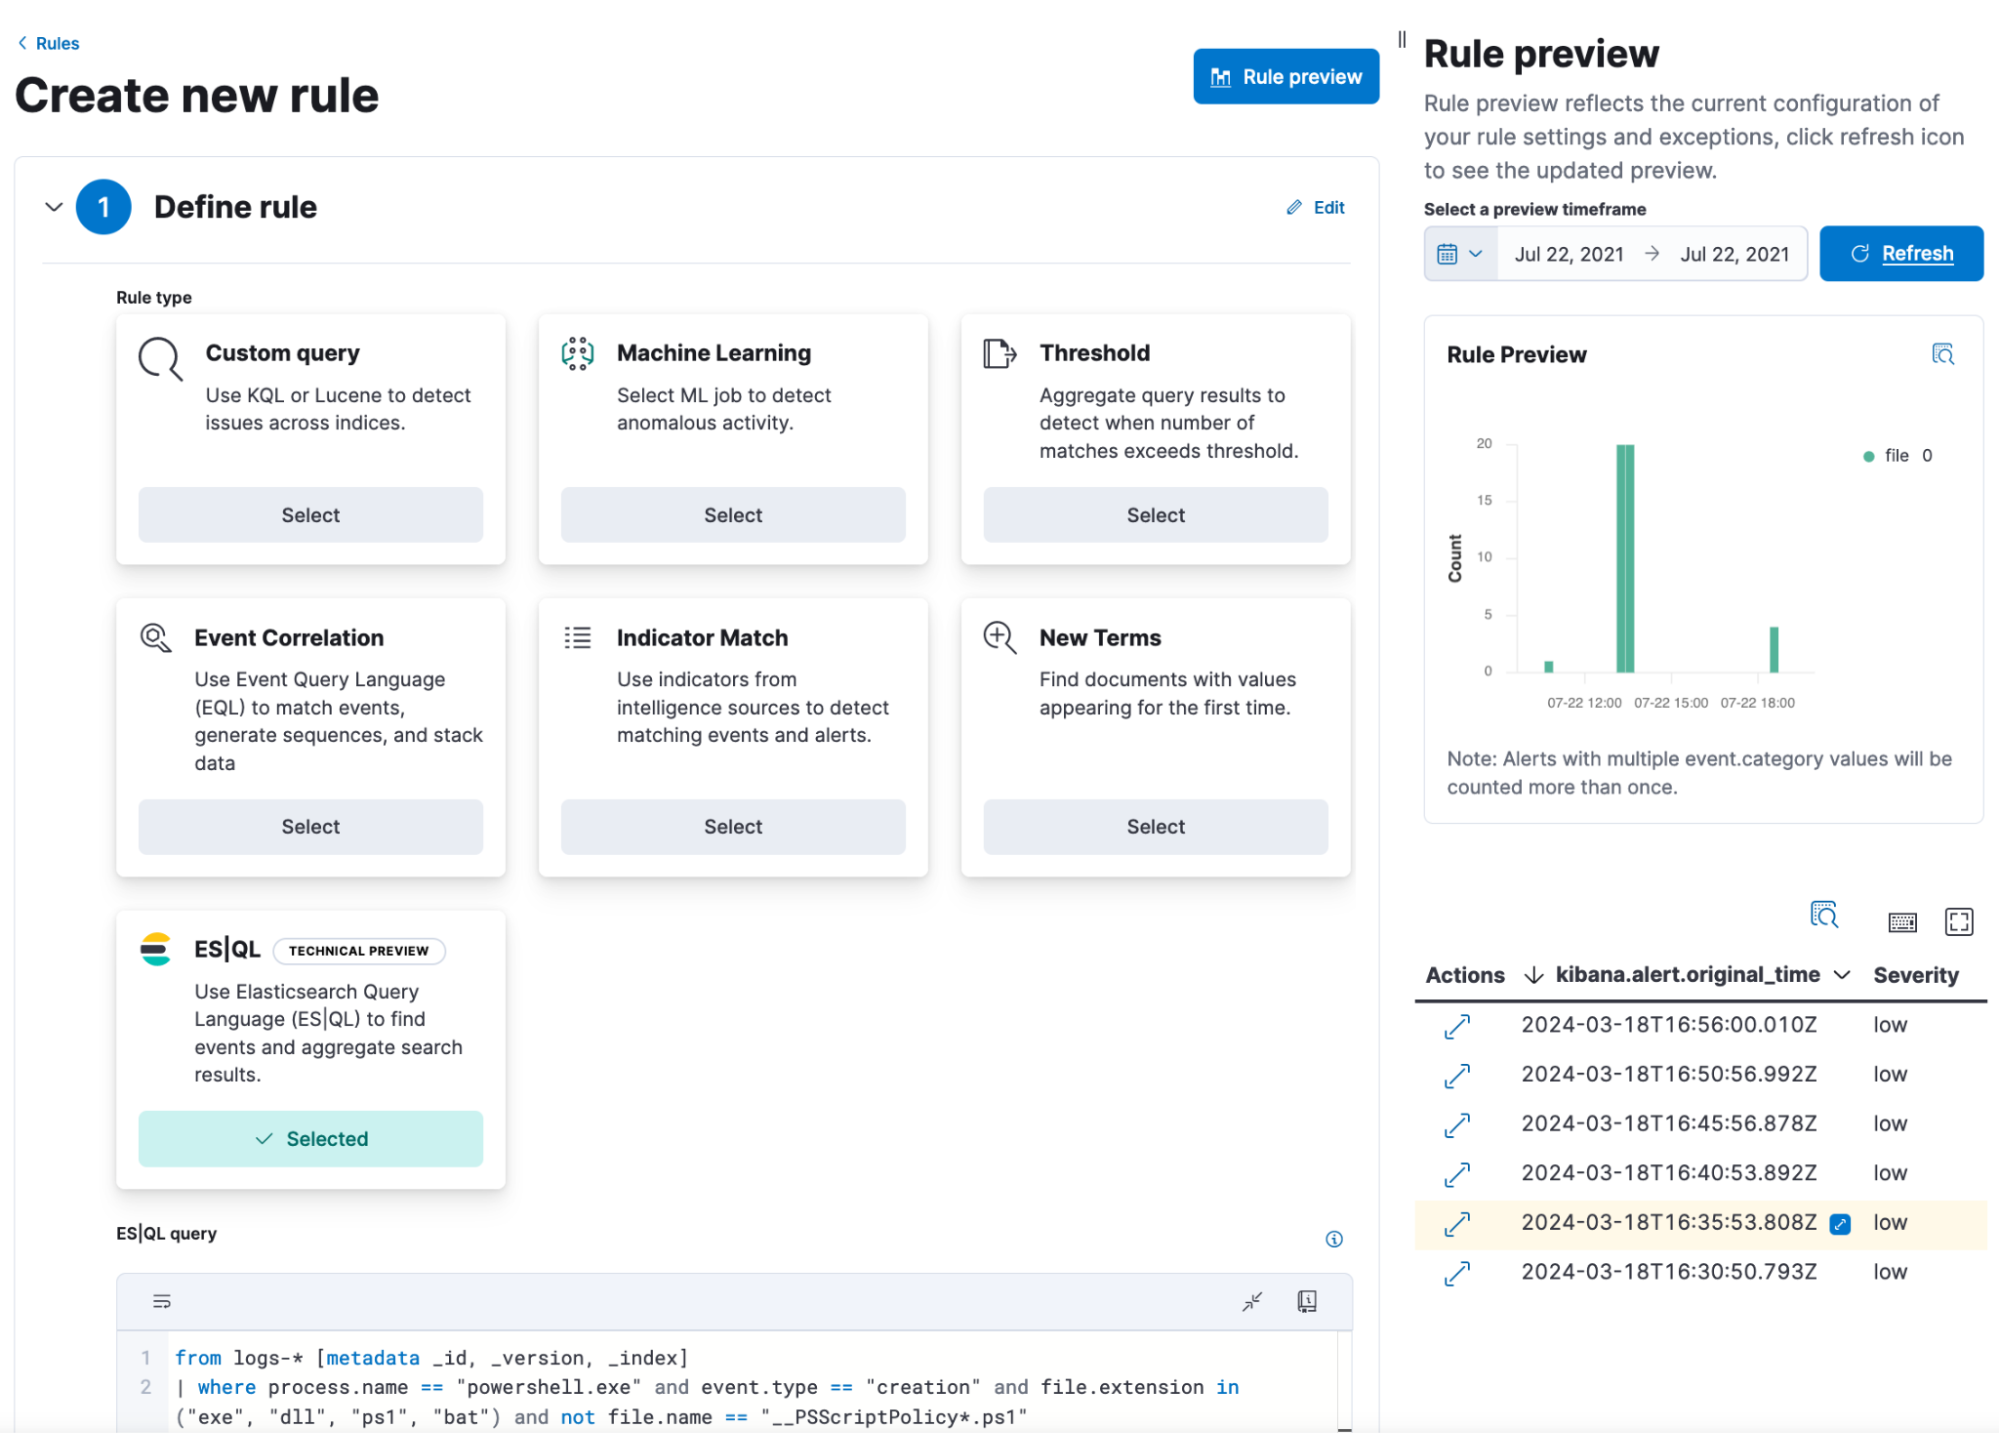
Depending on the use case you are trying to detect, you’ll begin by choosing one of the available rule types.
Detection methods
Elastic security provides a number of detection rule types. You can write your detection logic in ES|QL, Kibana Query Language (KQL), Lucene, or EQL.
The ES|QL rule type allows you to write a very flexible detection logic, passing data from one part of the query to the other and manipulating it in the query itself. ES|QL is the newest of Elastic query languages and is in active development, so keep an eye out for new capabilities that will be useful in detection use cases.
The custom query rule type is useful for the single event match — queries can be written in KQL or Lucene. For example, a custom query detection rule with this logic event.dataset:gcp.audit and event.action:google.iam.admin.v*.CreateRole and event.outcome:success will detect custom role creation in GCP (Google Cloud Platform).
The event correlation rule type is great for event sequence detection and can be written in EQL. You can also use this rule type to detect if an event is missing in a sequence.
For example you can detect creation and deletion of a scheduled task within a short time interval with this query:
sequence by winlog.computer_name, winlog.event_data.TaskName with maxspan=5m
[iam where event.action == "scheduled-task-created" and not user.name : "*$"]
[iam where event.action == "scheduled-task-deleted" and not user.name : "*$"]
To detect anomalous behaviors in your events, use the ML rule type. This rule type creates alerts for anomalies and outliers identified with ML jobs, where severities exceed the predefined threshold. There are many ML jobs available out-of-the-box with their respective SIEM rules that you can enable directly from Elastic Security, or you can create custom ML jobs and rules.
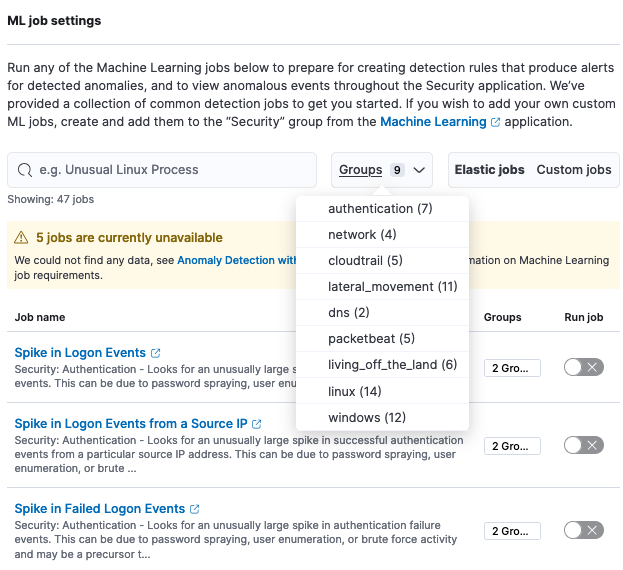
Use the threshold rule type to alert when the volume of events aggregated by a specified field exceeds the threshold and multiple unique values are observed, such as multiple failed logins from the same username and 10 different source IP addresses.
New terms rules find a new term that was not seen before in the historical time window, such as successful authentication from a new user to a critical server.
Indicator match helps detect matches between incoming threat intelligence and logs or logs with the predetermined list of indicators. For example, a user requesting access to a known malicious domain or url (a known bad) can be an indicator of compromise.
You can also create so-called higher order rules to search through the alerts created by other rules.An example of a higher order rule indicating an attack chain is the detection of an alert sequence that spans multiple tactics and techniques.
Level up rule creation with AI assistant
If your rule query has errors, Elastic AI Assistant is ready to help and provide an improved query that can be instantly updated right from the assistant view. Elastic AI Assistant is available at the Enterprise license tier.
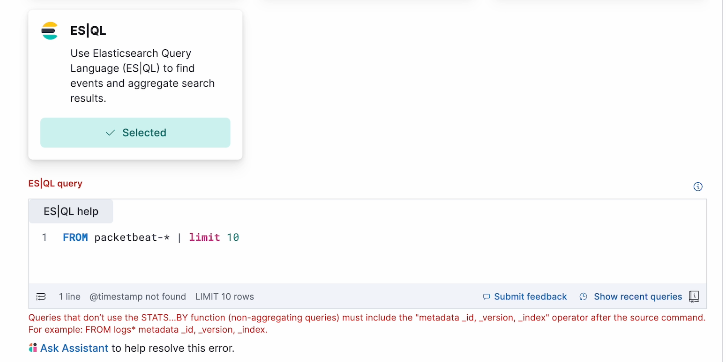
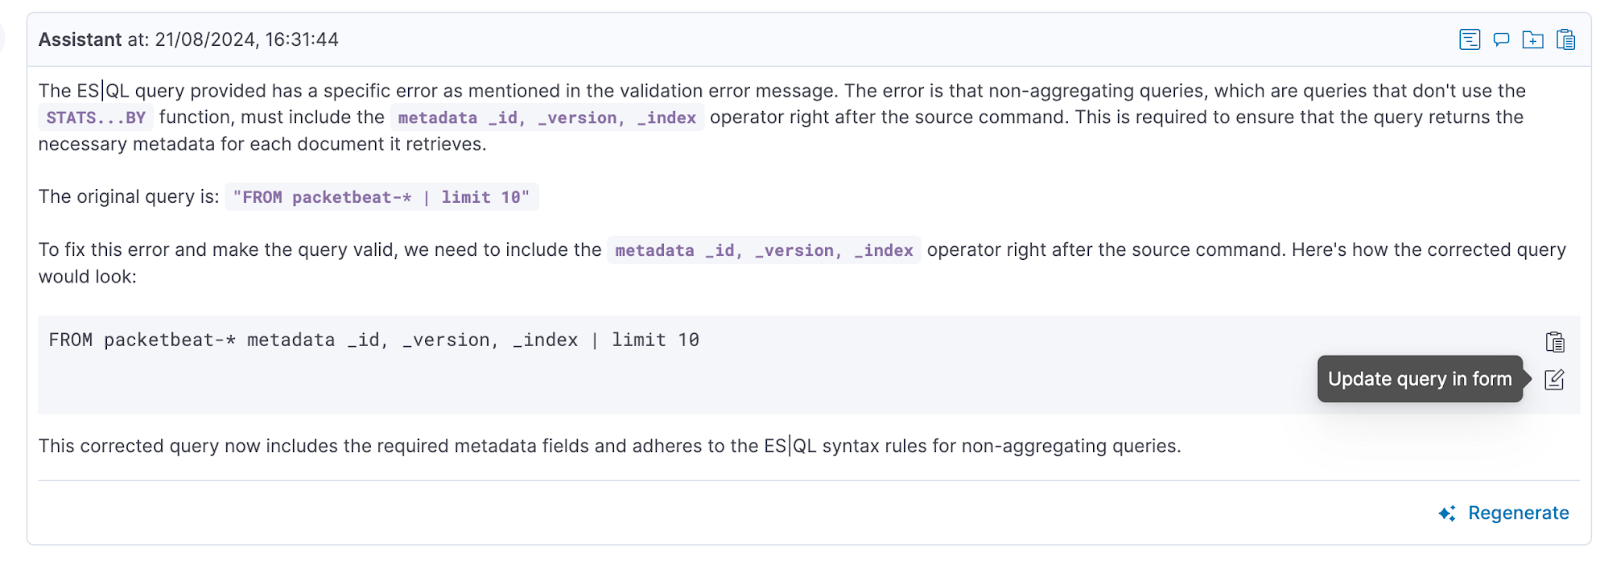
Furthermore, Elastic AI Assistant can help create a rule query from scratch if given the specific use case you want to detect.
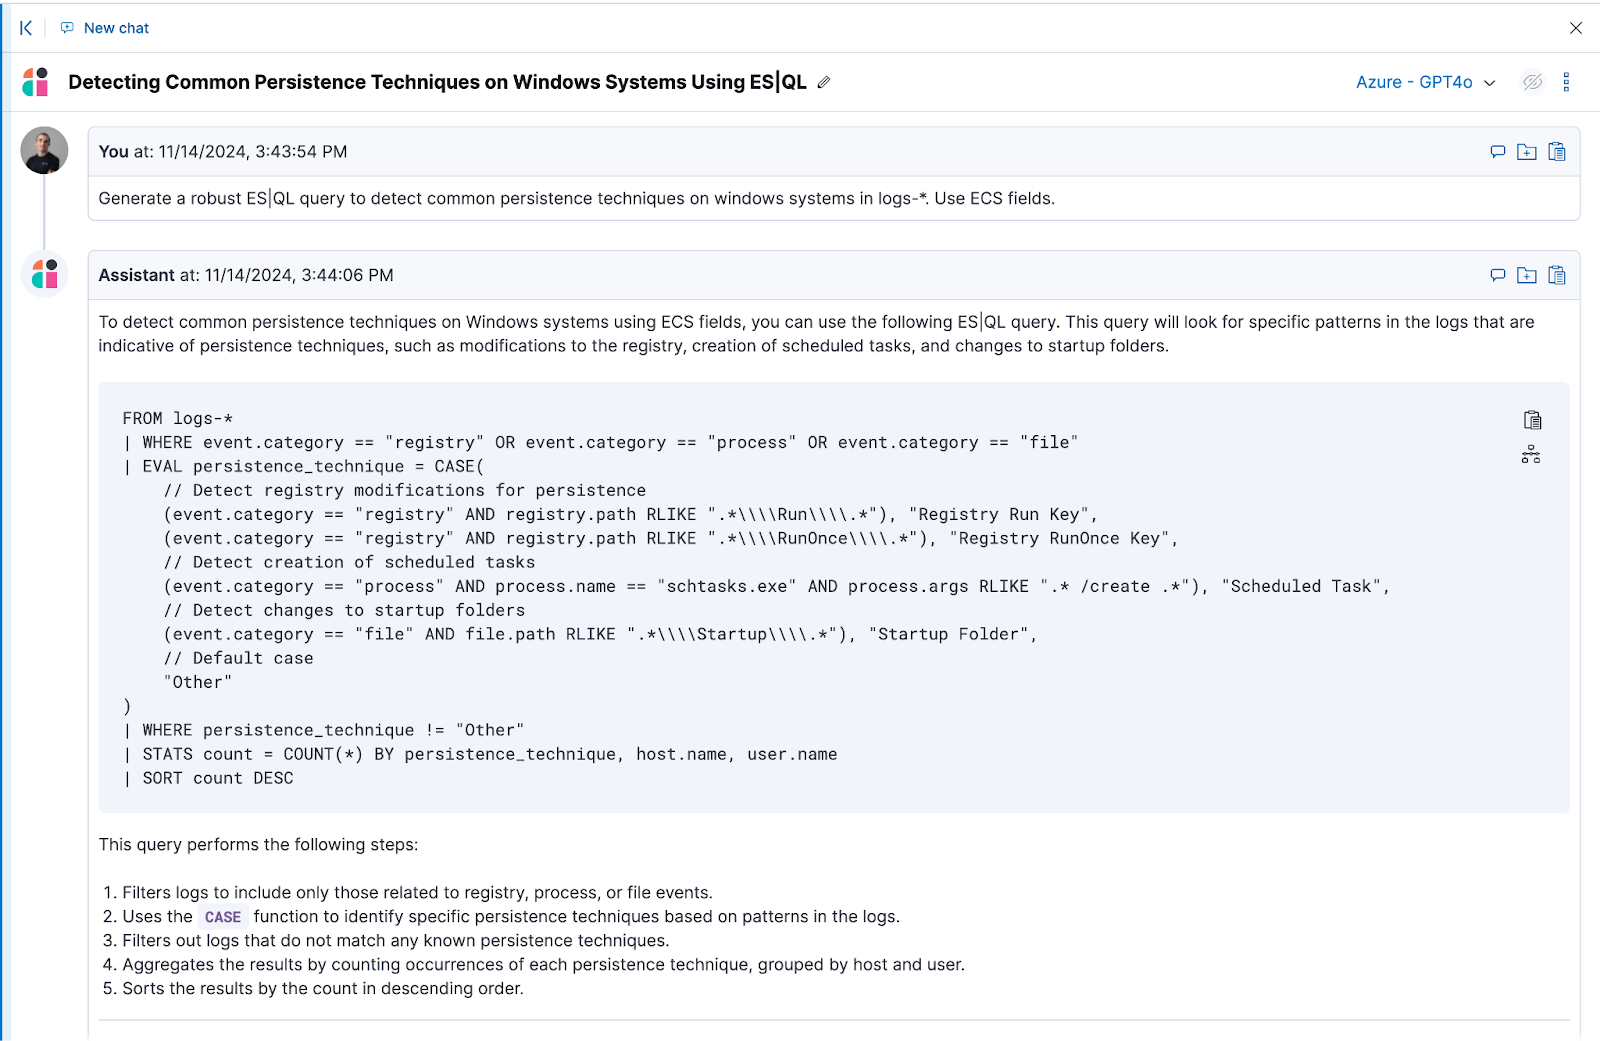
Elastic AI Assistant can be used in all security workflows and is especially helpful in alert analysis, streamlining workflows, and automating triage and remediation.
Pro tip!
Make sure to use the custom knowledge base within Elastic AI Assistant for Security to get the most relevant and on-point answers to your questions.
Keep an eye on developments in this and other generative AI capabilities in Elastic Security as they become more and more powerful. While working on the rule, it is important to check if it behaves as expected! You can do this using the preview functionality.
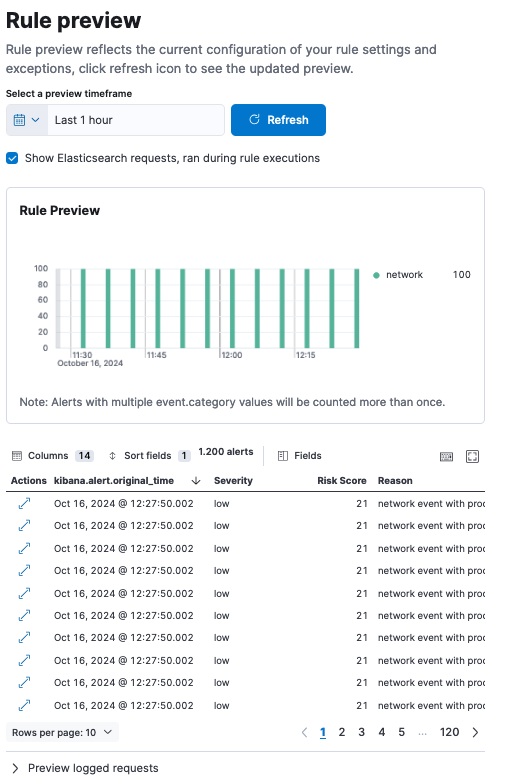
Deduplicate alerts with alert suppression
Alert noise can be reduced by using alert suppression. When tuning for suppression, you can select up to three fields to suppress by and choose whether to suppress alerts per each rule execution or for a specified period of time.
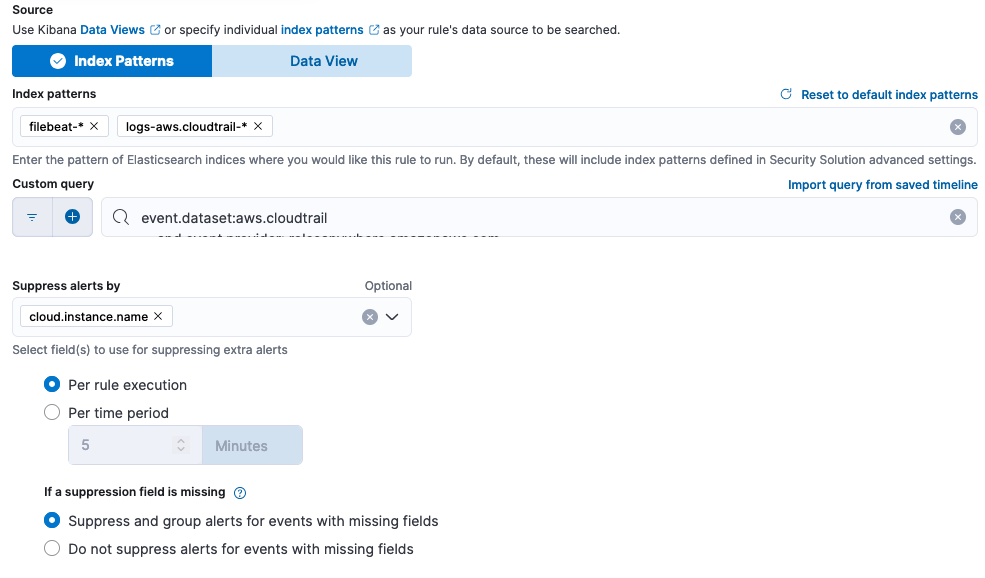
During rule execution, alerts with matching suppression fields are grouped and only one alert is created — this includes the counter of grouped alerts. Analysts can see the number of detections with the same suppression fields, the suppressed values, and the suppression start and end time range but are not flooded with a huge number of duplicate alerts.
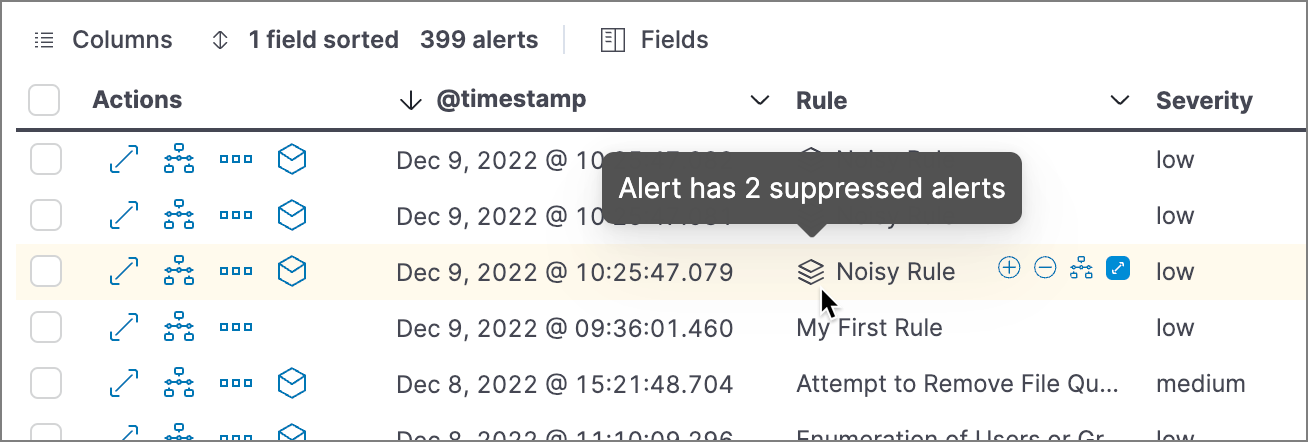
If you need to view the original events for the suppressed alerts, you can copy and run the rule query for a needed time frame in Discover or Timeline.
Reduce mean time to respond (MTTR) with additional alert context
We recommend adding information to each rule to help analysts investigate alerts faster. Adding information could be mapping to MITRE ATT&CK, adding a timeline template, guiding responses with the interactive investigation guide, or setting up actions to send notifications and respond to alerts.
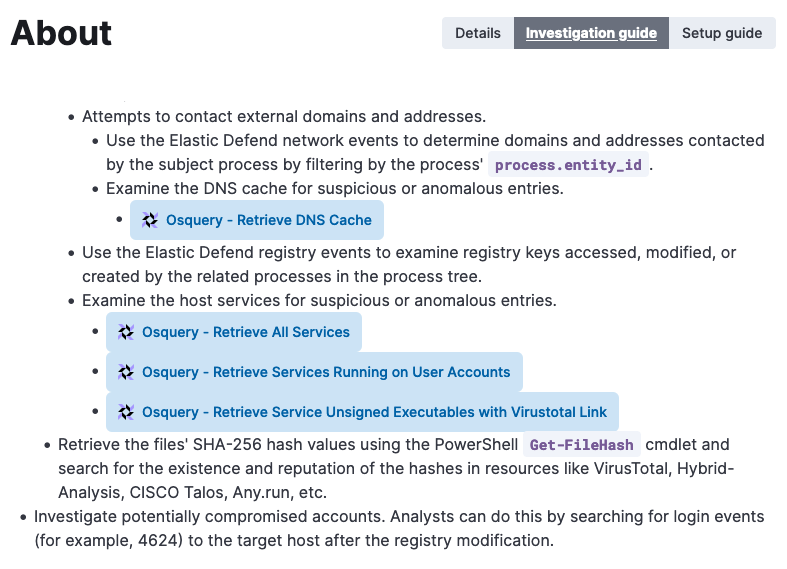
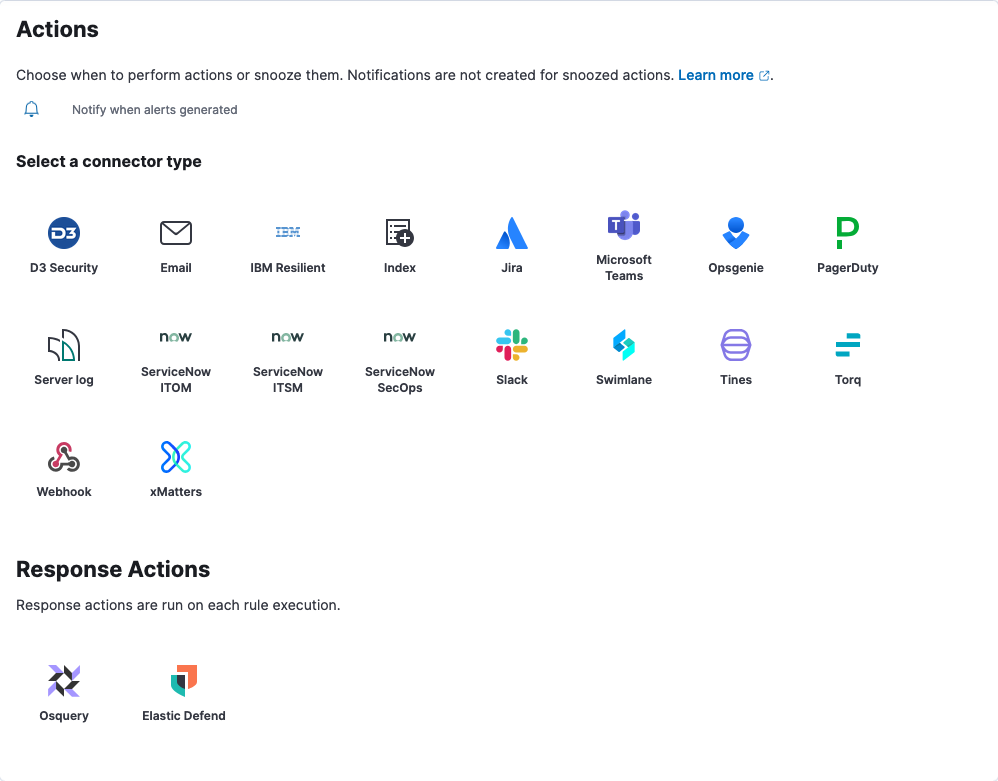
To further streamline analysis, you can set up custom highlighted fields.
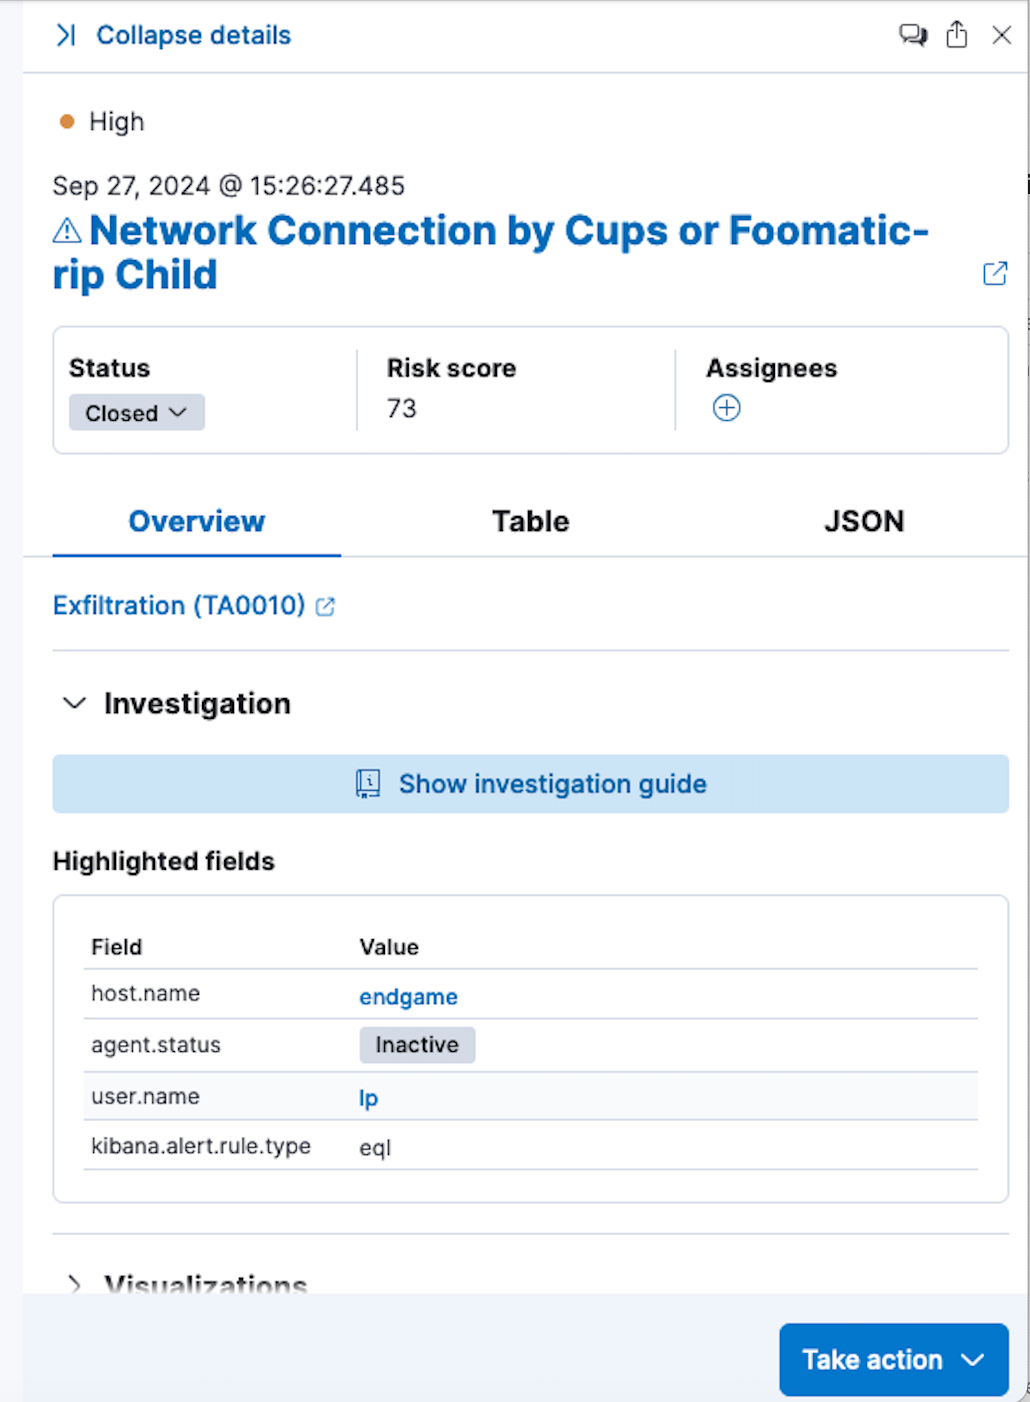
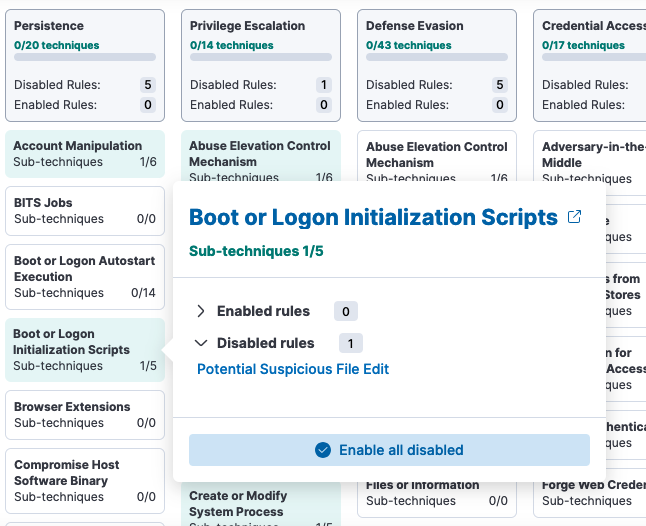
Explore and analyze detection coverage through MITRE ATT&CK
Get a high-level overview of your detections using the MITRE ATT&CK coverage page to analyze and plan your detection coverage and focus efforts on threats that matter to your organization.
You can filter on Elastic or custom rules — enabled or disabled — and see if there are opportunities to improve your coverage. For example, if you have detections focused on later attack stages, consider adding more early-stage detections.
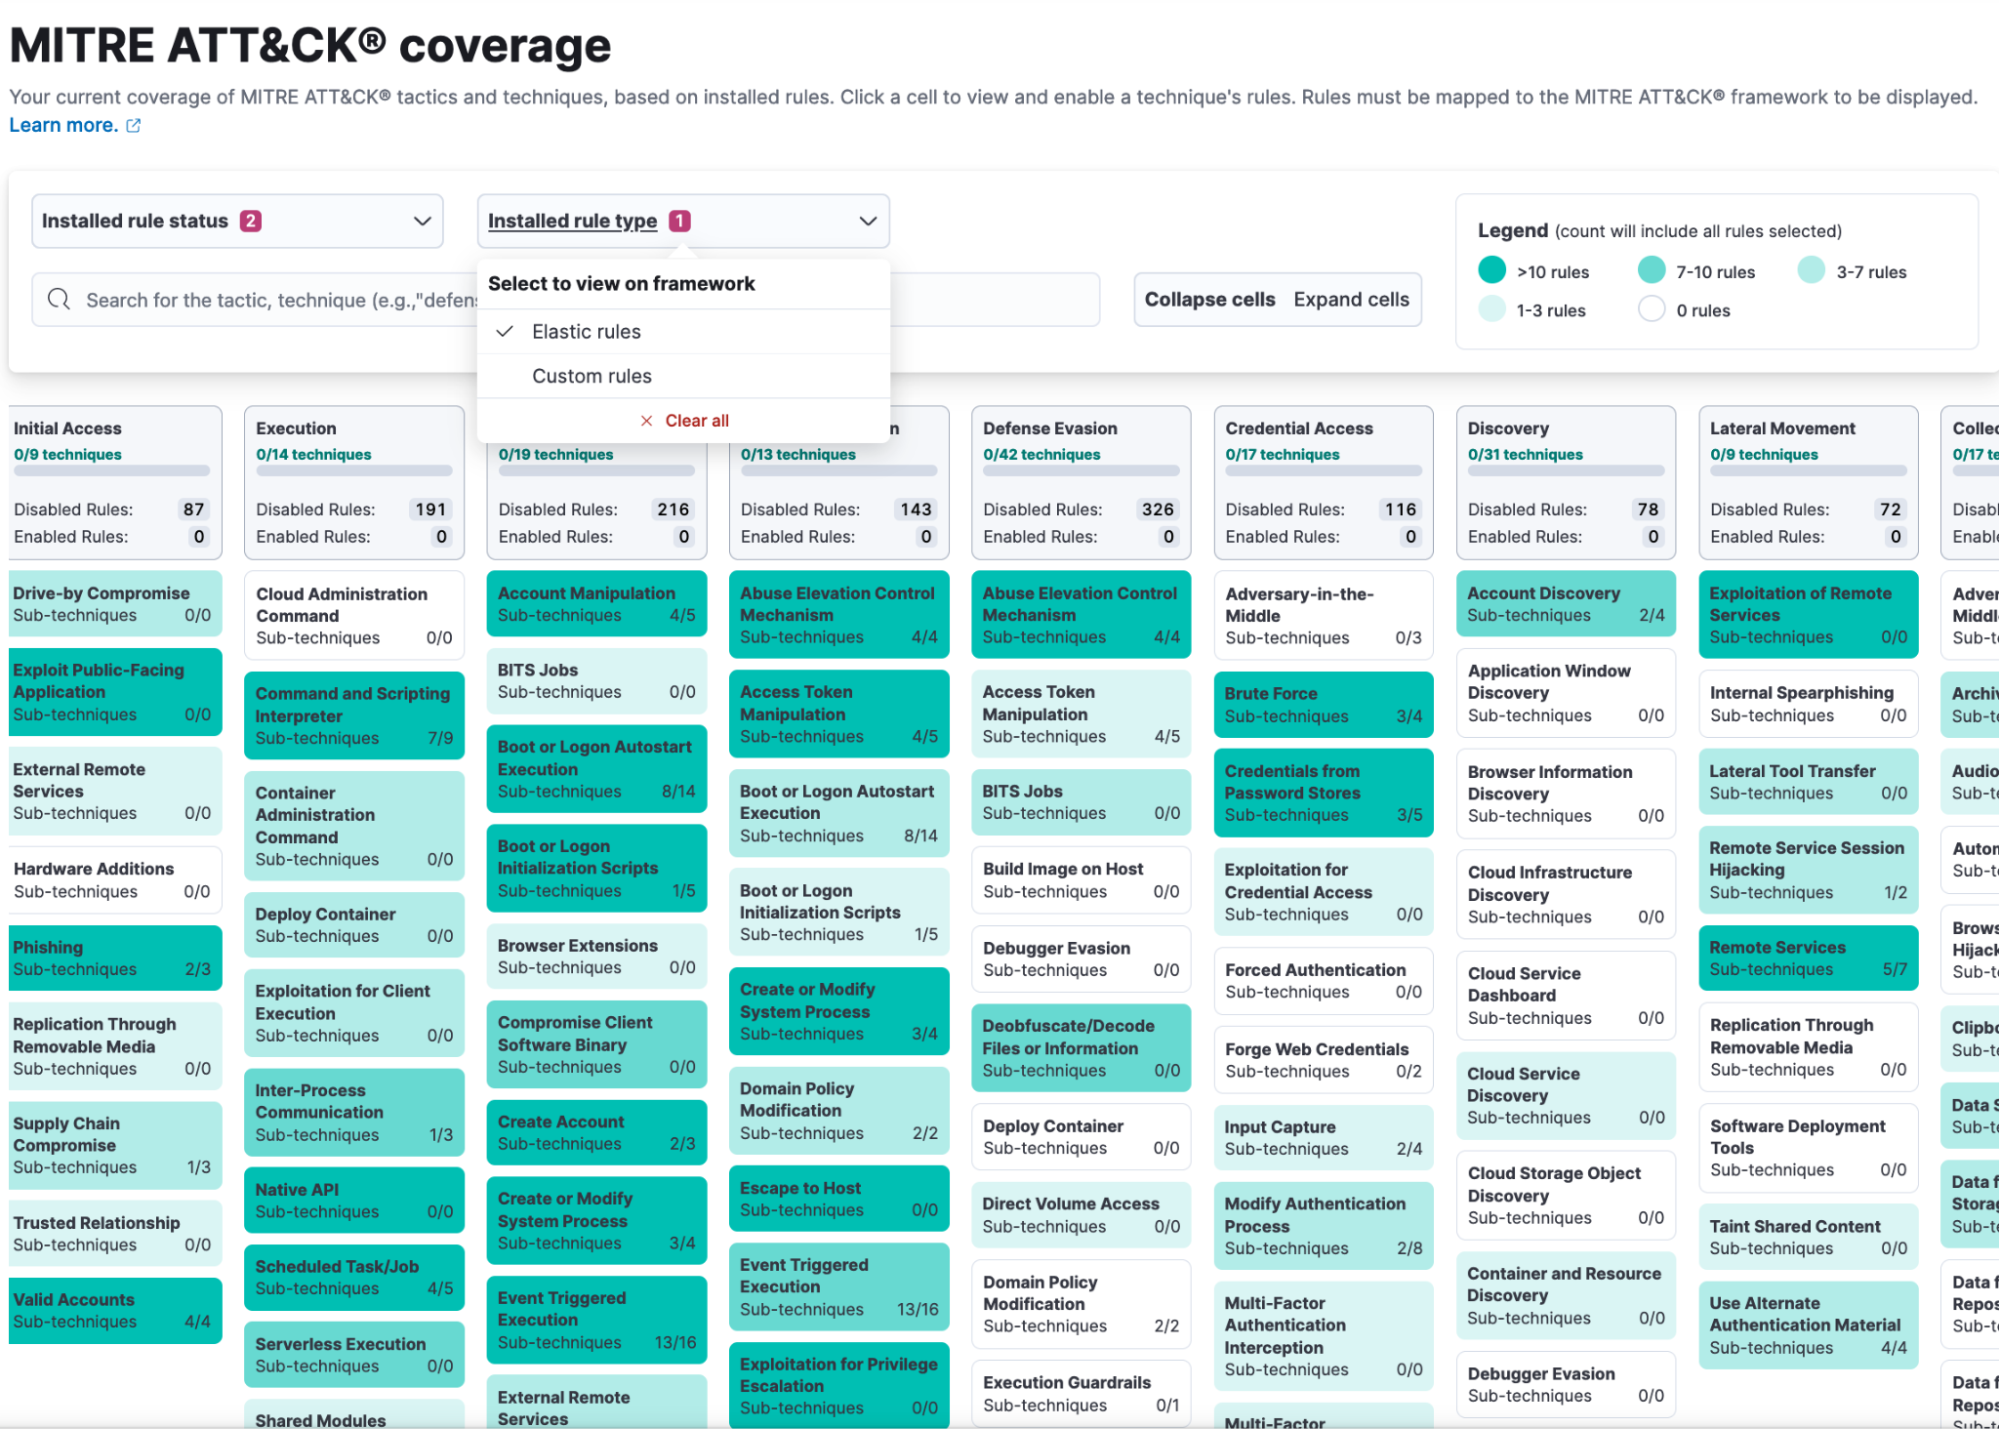
You can quickly enable all rules for a specific technique that you've installed but not yet activated right from the technique cell you are looking into.
Tuning rules in Elastic Security
As part of standard practices, detection engineering teams should regularly review particularly noisy rules or rules that are unusually quiet.
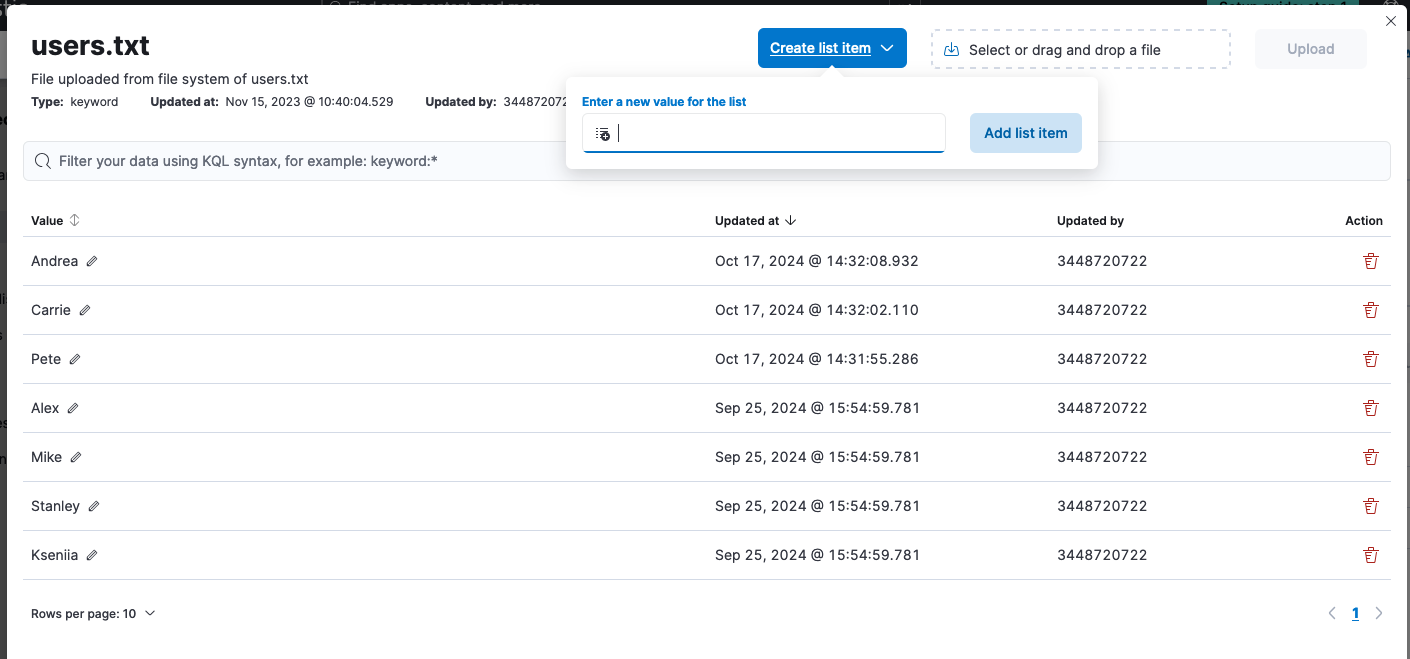
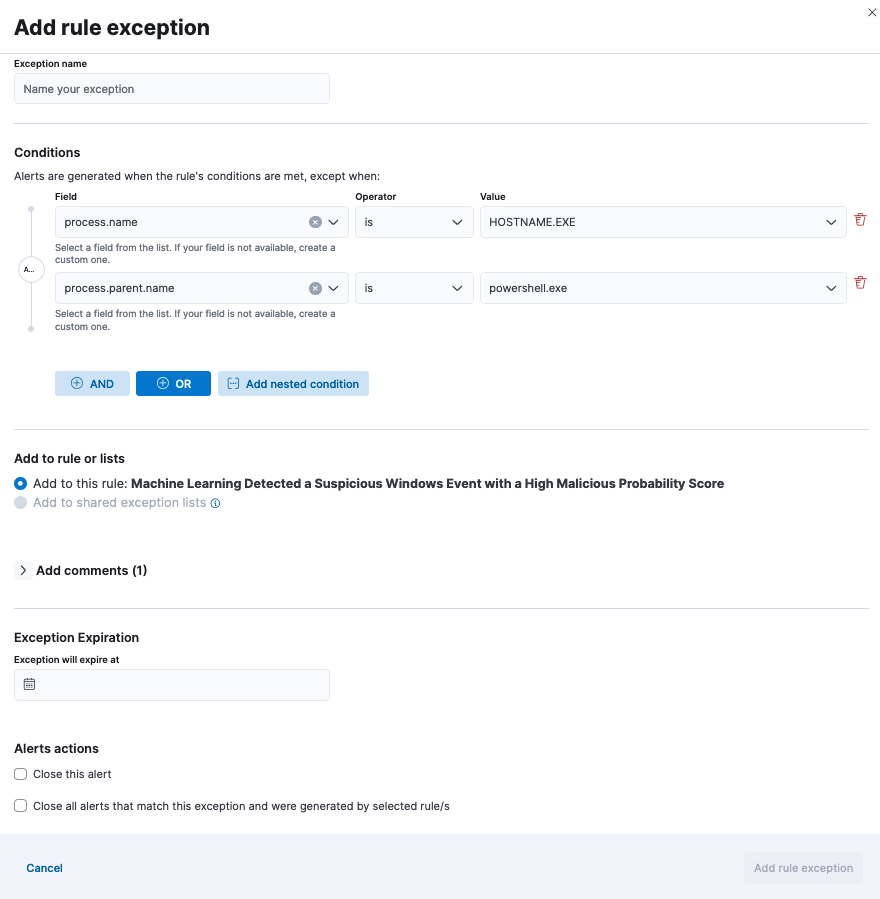
There are a few ways of addressing false positives, including using single rule exceptions, shared exception lists that apply to multiple rules, and value lists with exceptions.
Value lists and their values can be viewed and managed in Elastic Security. These are useful if you need to scale exceptions management or collect indicators of compromise to use in the indicator match rule.
Tip! You can prevent future false positives with simplified exceptions creation by implementing custom highlighted fields, as the exception fields will be prefilled for your convenience.
Rule monitoring and fixing issues
Get an overview of how the detection rules are performing in your environment using the detection rule monitoring dashboard available in the Dashboards tab of Elastic Security.
This dashboard provides visualizations of rule execution statuses and time taken for rule execution. It also helps identify rule candidates for performance and query optimizations.
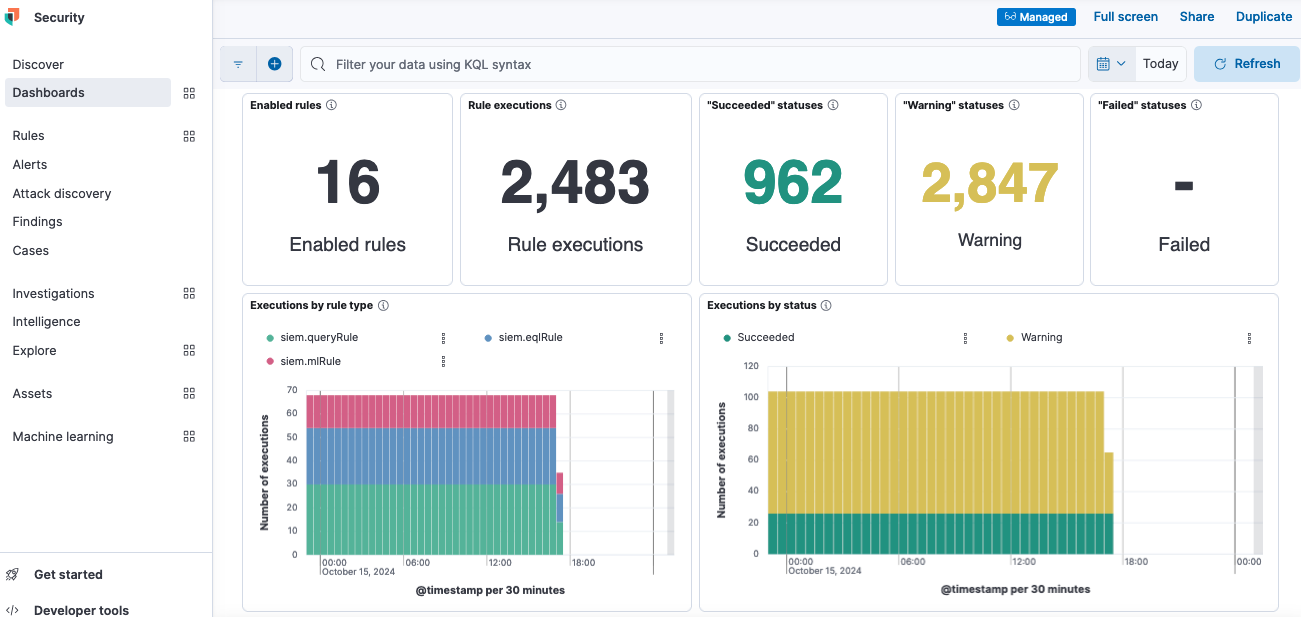
More information for monitoring and troubleshooting can be found in the Rule monitoring tab or in the Rule executions table of individual rules.
If you need to test rules over the past data or backfill missing alerts, you can do it with manual rule run. Manual run rule executions will happen with a lower priority when the system is not busy with scheduled rule runs. Once executed, the alerts will show up on the Alerts page, and if needed, you can filter for alerts from manual runs only.
Once the rules' performance monitoring is in place, detection teams should look to improve the quality of detection rules with rule reviews and automated testing and deployment. This is where Detection as Code concepts can be helpful.
Improving detection process maturity with Detections as Code
If you want to level up your detection processes, you may consider doing peer review and versioning your rules using an external version control system as well as automating rule deployment across your systems with a Detections as Code (DaC) approach.
We are working on opening and supporting DaC tooling within the detection rules repo, enabling you to import and export custom rules easily to and from Elastic Security as well as configure unit tests, validation, and schemas. This is especially useful if you need to scale rule deployments to multiple Elastic Security instances or follow a rigorous change review process.
Elastic’s DaC approach is very flexible and can accommodate different architectures. Extensive documentation with examples that highlight the pros and cons of different approaches is available for your convenience. You can also watch the Elastic DaC demo video to get a quick overview.
Wrapping up and putting this knowledge into practice
With all the information you’ve read, we hope we have shown how Elastic Security can help you:
Address your security use cases with flexible detection workflows
Detect threats with Elastic's Search AI Platform across data sources, locations, and tiers
- Extend your security team with Elastic’s in-house threat researchers and detection engineers by using a broad selection of out-of-the-box ML models alongside correlation rules that cover cloud, endpoint, network, and SaaS applications, all maintained by Elastic Security Labs
- Automatically implement regular content updates from Elastic Security
- Address your unique detections needs with prebuilt rules editing and custom rule creation and tuning capabilities, ES|QL, and multiple correlation rule types
- Focus and prioritize detection engineering work with MITRE ATT&CK coverage overview
- Gain deep visibility into detection performance with the rule monitoring dashboard
- Reduce MTTR by automating responses to detections and customizing security analyst triage and the investigation experience
- Scale and mature detection engineering practice with Detections as Code support
Try the new detection engineering capabilities on your deployment or start your free trial.
Connect with us on Elastic’s community Slack to give feedback or tell us what detection engineering practice you are building and how we can help! You can also sign up to participate in the user research program.
The release and timing of any features or functionality described in this post remain at Elastic's sole discretion. Any features or functionality not currently available may not be delivered on time or at all.
In this blog post, we may have used or referred to third party generative AI tools, which are owned and operated by their respective owners. Elastic does not have any control over the third party tools and we have no responsibility or liability for their content, operation or use, nor for any loss or damage that may arise from your use of such tools. Please exercise caution when using AI tools with personal, sensitive or confidential information. Any data you submit may be used for AI training or other purposes. There is no guarantee that information you provide will be kept secure or confidential. You should familiarize yourself with the privacy practices and terms of use of any generative AI tools prior to use.
Elastic, Elasticsearch, ESRE, Elasticsearch Relevance Engine and associated marks are trademarks, logos or registered trademarks of Elasticsearch N.V. in the United States and other countries. All other company and product names are trademarks, logos or registered trademarks of their respective owners.