An Elastic Stack Primer
This article describes my adventures while getting initiated into the Elastic Stack. We'll be building upon the elasticsearch index I've set up for search in an earlier post. We'll upgrade our stack to 5.x, incorporate logstash and kibana, so we can consume and visualize data – besides what our search interface allows; and we'll also hone and troubleshoot our understanding of the Elastic Stack along the way.
Getting started with the Elastic Stack can feel a bit overwhelming. You need to set up elasticsearch, Kibana, and logstash before you even can get to the fun parts – maybe even before you fully understand how the three synergize providing you with formidable and formerly untapped insights into your platform.
I have been running Pony Foo since late 2012, and, although I had set up Google Analytics and Clicky since the very beginning, these kinds of user tracking systems are far from ideal when it comes to troubleshooting. In the years since I launched the blog I tried a couple of instrumentation tools that would provide me with reporting and metrics from the Node.js application for my blog, but these solutions would require me to, well... instrument the Node apps by patching them with a snippet of code that would then communicate with a third party service. Visiting that service I could learn more about the current state of my production application. For a variety of reasons, – too expensive, makes my app too slow, etc. – I ended up ditching every one of these solutions not long after giving them a shot.
Not long ago I wrote about setting up search for a blog, and since I'm already working on the Kibana analytics dashboard team I figured it wouldn't hurt to learn more about logstash so that I could go full circle and finally have a look at some server metrics my way.
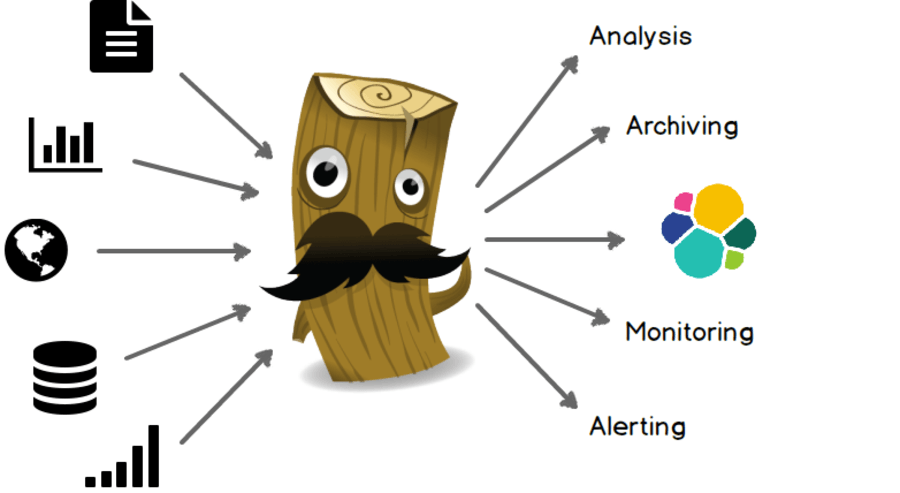
Logstash is, in short, a way to get data from one place to another. It helps stream events pulled out of files, HTTP requests, tweets, event logs, or dozens of other input sources. After processing events, Logstash can output them via Elasticsearch, disk files, email, HTTP requests, or dozens of other output plugins.
The above graph shows how Logstash can provide tremendous value through a relatively simple interface where we define inputs and outputs. You could easily use it to pull a Twitter firehose of political keywords about a presidential campaign into Elasticsearch for further analysis. Or to anticipate breaking news on Twitter as they occur.
Or maybe you have more worldly concerns, like streaming log events from nginx and node into elasticsearch for increased visibility through a Kibana dashboard. That's what we're going to do in this article.
Installing the Elastic Stack
I had used Elasticsearch 2.3 for my previous blog post. This represented a problem when it came to using the Elastic Stack, because I wanted to use the latest version of Kibana – 5.0.0-alpha3, at the time of this writing.
As mentioned in the earlier article, we'll have to download and install Java 8 to get Elasticsearch up and running properly. Below is the piece of code we used to install Java 8. Keep in mind this code was tested on a Debian Jessie environment, but it should mostly work in Ubuntu or similar systems.
# install java 8
export JAVA_DIST=8u92-b14
export JAVA_RESOURCE=jdk-8u92-linux-x64.tar.gz
export JAVA_VERSION=jdk1.8.0_92
wget -nv --header "Cookie: oraclelicense=accept-securebackup-cookie" -O /tmp/java-jdk.tar.gz http://download.oracle.com/otn-pub/java/jdk/$JAVA_DIST/$JAVA_RESOURCE
sudo mkdir /opt/jdk
sudo tar -zxf /tmp/java-jdk.tar.gz -C /opt/jdk
sudo update-alternatives --install /usr/bin/java java /opt/jdk/$JAVA_VERSION/bin/java 100
sudo update-alternatives --install /usr/bin/javac javac /opt/jdk/$JAVA_VERSION/bin/javac 100
Next, we'll install the entire pre-release Elastic Stack – formerly ELK Stack, for Elasticsearch, Logstash and Kibana. The following piece of code pulls all three packages from packages.elastic.co and installs them.
# install elasticsearch + logstash + kibana
wget -qO - https://artifacts.elastic.co/GPG-KEY-elasticsearch | sudo apt-key add -
sudo apt-get install apt-transport-https
echo "deb https://artifacts.elastic.co/packages/5.x/apt stable main" | sudo tee -a /etc/apt/sources.list.d/elastic-5.x.list
sudo apt-get update
sudo apt-get -y install elasticsearch logstash kibana
After installing all three, we should turn on their services so that they run at startup. This is particularly desirable in production systems. Debian Jessie relies on systemd for services, so that's what we'll use to enable these services.
# elasticsearch + logstash + kibana as services
sudo /bin/systemctl daemon-reload
sudo /bin/systemctl enable elasticsearch.service
sudo /bin/systemctl enable logstash.service
sudo /bin/systemctl enable kibana.service
You want to reduce your "hands on"👏 production experience as much as possible. Automation is king, etc. Otherwise, why go through the trouble?
Lastly, we start all of the services and log their current status. We pause for ten seconds after booting Elasticsearch in order to give it time to start listening for connections, so that Logstash doesn't run into any trouble.
# firing up elasticsearch
sudo service elasticsearch restart || sudo service elasticsearch start
sudo service elasticsearch status
# giving logstash some runway
sleep 10s
# firing up logstash
sudo service logstash restart || sudo service logstash start
sudo service logstash status
# firing up kibana
sudo service kibana restart || sudo service kibana start
sudo service kibana status
Great, now we'll need to tweak our nginx server.
It's important to note that we'll be expecting the access.log file to have a specific format that Logstash understands, so that we can consume it and split it into discrete fields. To configure nginx with the pattern we'll call metrics, add this to the http section of your nginx.conf file.
log_format metrics '$http_host '
                   '$proxy_protocol_addr [$time_local] '
                   '"$request" $status $body_bytes_sent '
                   '"$http_referer" "$http_user_agent" '
                   '$request_time '
                   '$upstream_response_time';
Next, in the server section of your site.conf for the site you want to be parsing logs for, just tell nginx to use the metrics logging format we've defined earlier.
access_log /var/log/nginx/ponyfoo.com.access.log metrics;
After exposing the Kibana web app on my nginx server and pointing a DNS CNAME entry for analytics.ponyfoo.com (currently password protected) to my load balancer, I was good to go.
From nginx to Elasticsearch via Logstash
Logstash relies on inputs, filters applied on those inputs, and outputs. We configure all of this in a logstash.conf config file that we can then feed logstash using the logstash -f $FILE command.
Getting Logstash to read nginx access logs is easy. You specify an event type that's later going to be used when indexing events into Elasticsearch, and the path to the file where your logs are recorded. Logstash takes care of tailing the file and streaming those logs to whatever outputs you indicate.
input {
  file {
    type => "nginx_access"
    path => "/var/log/nginx/ponyfoo.com.access.log"
  }
}
When it comes to configuring Logstash to pipe its output into Elasticsearch, the configuration couldn't be any simpler.
output {
  elasticsearch {}
}
An important aspect of using Logstash is using filters to determine the fields and field types you'll use when indexing log events into Elasticsearch. The following snippet of code tells Logstash to look for grok patterns in /opt/logstash/patterns, and to match the message field to the NGINX_ACCESS grok pattern, which is defined in a patterns file that lives in the provided directory.
filter {
  grok {
    patterns_dir => "/opt/logstash/patterns"
    match => { "message" => "%{NGINX_ACCESS}" }
  }
}
The contents of the file containing the grok patterns are outlined below, and they should be placed in a file in /opt/logstash/patterns, as specified in the patterns_dir directive above. Logstash comes with quite a few built-in patterns and the general way of consuming a pattern is %{PATTERN:name} where some patterns such as NUMBER also take a type argument, such as %{NUMBER:bytes:int}, in the piece of code below.
NGINX_USERNAME [a-zA-Z\.\@\-\+_%]+
NGINX_USER %{NGINX_USERNAME}
NGINX_ACCESS %{IPORHOST:http_host} %{IPORHOST:client_ip} \[%{HTTPDATE:timestamp}\] \"(?:%{WORD:verb} %{NOTSPACE:request}(?: HTTP/%{NUMBER:http_version:float})?|%{DATA:raw_request})\" %{NUMBER:status:int} (?:%{NUMBER:bytes:int}|-) %{QS:referrer} %{QS:agent} %{NUMBER:request_time:float} %{NUMBER:upstream_time:float}
NGINX_ACCESS %{IPORHOST:http_host} %{IPORHOST:client_ip} \[%{HTTPDATE:timestamp}\] \"(?:%{WORD:verb} %{NOTSPACE:request}(?: HTTP/%{NUMBER:http_version:float})?|%{DATA:raw_request})\" %{NUMBER:status:int} (?:%{NUMBER:bytes:int}|-) %{QS:referrer} %{QS:agent} %{NUMBER:request_time:float}
Each match in the pattern above means a field will be created for that bit of output, with its corresponding name and type as indicated in the pattern file.
Going back to the filter section of our logstash.conf file, we'll also want a date filter that parses the timestamp field into a proper date. a geoip filter so that the client_ip field gets the geolocation treatment.
filter {
  grok {
    patterns_dir => "/opt/logstash/patterns"
    match => { "message" => "%{NGINX_ACCESS}" }
  }
  date {
    match => [ "timestamp" , "dd/MMM/YYYY:HH:mm:ss Z" ]
  }
  geoip {
    source => "client_ip"
  }
}
You can run logstash -f $FILE to test the configuration file and ensure your pattern works. There's also a website where you can test your grok patterns online.
If you're running Logstash as a service, or intend to, you'll need to place the logstash.conf file in /etc/logstash/conf.d – or change the default configuration directory.
My preference when configuring globally-installed tools such as Logstash is to keep configuration files in a centralized location and then create symbolic links in the places where the tool is looking for those files. In the case of Logstash there's two types of files we'll be using: grok patterns and Logstash configuration files. I'll be keeping them in $HOME/app/logstash and creating links to the places where Logstash looks for each of these kinds of files.
sudo ln -sfn $HOME/app/logstash/config/*.conf /etc/logstash/conf.d/
sudo ln -sfn $HOME/app/logstash/patterns/* /opt/logstash/patterns/
By the way, I had an issue where nginx logs wouldn't be piped into Elasticsearch, and Logstash would fail silently, but only when run as a service. It turned out to be a file permissions issue, one that was easily fixed by ensuring that the logstash user had execute permissions on every directory from / to /var/log/nginx.
You can verify that by executing the following command, which interpolates getfacl / all the way through to the /var/log/nginx directory.
getfacl /{,var/{,log/{,nginx}}}
You'll get output such as this:
getfacl: Removing leading '/' from absolute path names
# file: var/log/nginx
# owner: www-data
# group: adm
user::rwx
group::r-x
other::---
You'll note that in this case, user logstash of group logstash wouldn't have execute rights on /var/log/nginx. This can be easily fixed with the following command, but it gave me quite the headache until I stumbled upon this particular oddity.
sudo chmod o+x /var/log/nginx
Naturally, you'll also need to grant read access to the relevant log files.
I didn't just want to stream nginx logs to Elasticsearch, I also wanted node application level logs to be here. Let's do this!
Throwing node Logs into the Mix
To add Node logs into the mix, we don't need to change the output section of our Logstash file. It has all we needed. We do need to change the input and filter sections. First, we'll add another file to the input section. This should point to the file where your Node.js app is streaming its logs into. In my case that file was /var/log/ponyfoo-production.log, which is where the service running my node app redirected its output.
input {
  file {
    type => "node_app"
    path => "/var/log/ponyfoo-production.log"
  }
}
Now, the node_app log is a bit different. Sometimes, there are multi-line log entries. That happens when I log a stack trace. That's easily fixed by adding a multiline codec to my input processor, where each log entry must start with a NODE_TIME pattern-matching string, or otherwise is merged into the current log entry. Effectively, this means that lines that don't start with a timestamp will be treated as part of the last event, until a new line that matches a timestamp comes along, creating a new entry.
input {
  file {
    type => "node_app"
    path => "/var/log/ponyfoo-production.log"
    codec => multiline {
      patterns_dir => "/opt/logstash/patterns"
      pattern => "^%{NODE_TIME} "
      what => "previous"
      negate => true
    }
  }
}
My Node.js logs are quite compact, containing a date and time, a level marker and the logged message.
8 Jun 21:53:27 - info: Database connection to {db:ponyfoo-cluster} established.
08 Jun 21:53:27 - info: Worker 756 executing app@1.0.37
08 Jun 21:53:40 - info: elasticsearch: Adding connection to http://localhost:9200/
08 Jun 21:53:40 - info: cluster listening on port 3000.
08 Jun 21:56:07 - info: Database connection to {db:ponyfoo-cluster} established.
08 Jun 21:56:07 - info: Worker 913 executing app@1.0.37
08 Jun 21:56:07 - info: elasticsearch: Adding connection to http://localhost:9200/
08 Jun 21:56:08 - info: Database connection to {db:ponyfoo-cluster} established.
08 Jun 21:56:08 - info: Worker 914 executing app@1.0.37
08 Jun 21:56:08 - info: elasticsearch: Adding connection to http://localhost:9200/
08 Jun 21:56:08 - info: app listening on ip-10-0-69-59:3000
08 Jun 21:56:09 - info: app listening on ip-10-0-69-59:3000
As a result, my Node.js patterns file is much simpler. The NODE_TIME was exacted into its own pattern for convenience.
NODE_TIME %{MONTHDAY} %{MONTH} %{TIME}
NODE_APP %{NODE_TIME:timestamp} - %{LOGLEVEL:level}: %{GREEDYDATA:description}
In order for the filter section to play nice with two different input files under different formats, we'll have to update it using conditionals. The following piece of code is the same filter section we had earlier, wrapped in an if that checks whether we are dealing with an event of type nginx_access.
filter {
  if [type] == "nginx_access" {
    grok {
      patterns_dir => "/opt/logstash/patterns"
      match => { "message" => "%{NGINX_ACCESS}" }
    }
    date {
      match => [ "timestamp" , "dd/MMM/YYYY:HH:mm:ss Z" ]
    }
    geoip {
      source => "client_ip"
    }
  }
}
For node_app events, we'll do something quite similar, except there's no geolocation going on, and our main message pattern is named NODE_APP instead of NGINX_ACCESS. Also, make sure that the filter matches the new document type, node_type.
filter {
  if [type] == "node_app" {
    grok {
      patterns_dir => "/opt/logstash/patterns"
      match => { "message" => "%{NODE_APP}" }
    }
    date {
      match => [ "timestamp" , "dd MMM HH:mm:ss" ]
    }
  }
}
Purrrfect!
If you restart logstash, – either using the service or by executing the logstash -f logstash.conf command again – it should start streaming logs into Elasticsearch, from both nginx and node, as soon as the Logstash service comes online.
How do we interact with those logs in a friendly manner then? While it's okay for search to be mostly accessible through the web interface of the blog, it'd be pretty pointless to go through all of this trouble just to dump the logs into a table again on the web front-end.
That's where Kibana comes in, helping us visualize the data.
Getting Started with Kibana
Having already installed the Elastic Stack, and after having set up Logstash to channel our logs into Elasticsearch, we're now ready to fire up Kibana and gain some insights into all our data.
The default port Kibana listens on is 5601. I use nginx as a reverse proxy in front of Kibana. You can use proxy_pass to forward requests to the back-end Kibana node app. Here's the full server entry for nginx I use for ponyfoo.com.
server {
  listen 8080 proxy_protocol;
  server_name analytics.ponyfoo.com;
  set_real_ip_from 172.31.0.0/20;
  real_ip_header proxy_protocol;
  access_log /var/log/nginx/analytics.ponyfoo.com.access.log metrics;
  location / {
    proxy_pass http://127.0.0.1:5601;
    proxy_redirect off;
    proxy_http_version 1.1;
    proxy_set_header Host $http_host;
    proxy_set_header Upgrade $http_upgrade;
    proxy_set_header Connection $connection_upgrade;
    proxy_set_header X-Real-IP $remote_addr;
    proxy_cache one;
    proxy_cache_key nx$request_uri$scheme;
  }
}
Now you should be able to visit your Kibana dashboard at either http://localhost:5601 or your designated port and hostname.
open http://localhost:5601
The first time you load Kibana, you will be greeted with a message about configuring a default index pattern. Kibana suggests we try the logstash-* index pattern. Logstash defaults to storing events on indices named according to the day the event is stored on, such as logstash-2016-06-17, and so on. The * in the pattern acts as a wildcard so that every index starting with logstash- will match.
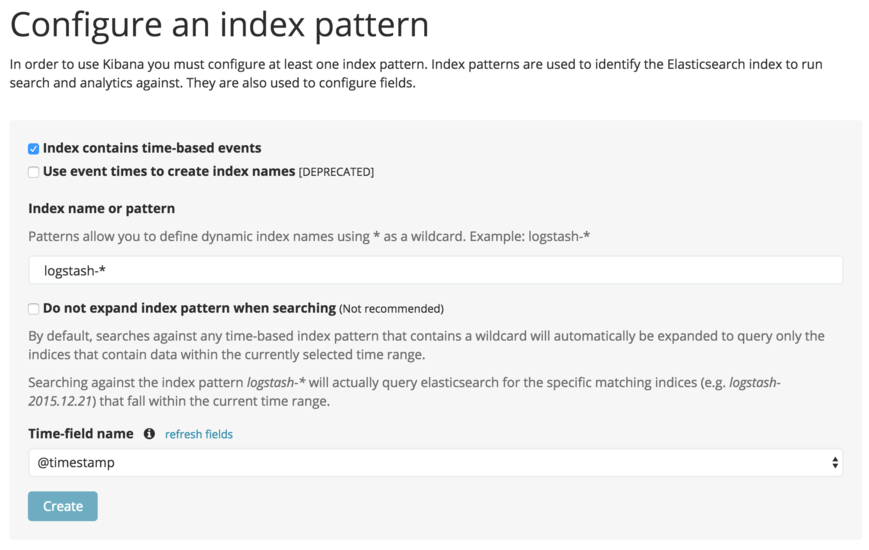
Once we've set up the index pattern, we might want to visit the Discover tab. Here, we'll be able to pull up Elasticsearch records as data rows, as well as a simple time-based chart displaying the amount of events registered over time. You can use the Elasticsearch query DSL to perform any queries and you can also apply filters on top of that query.
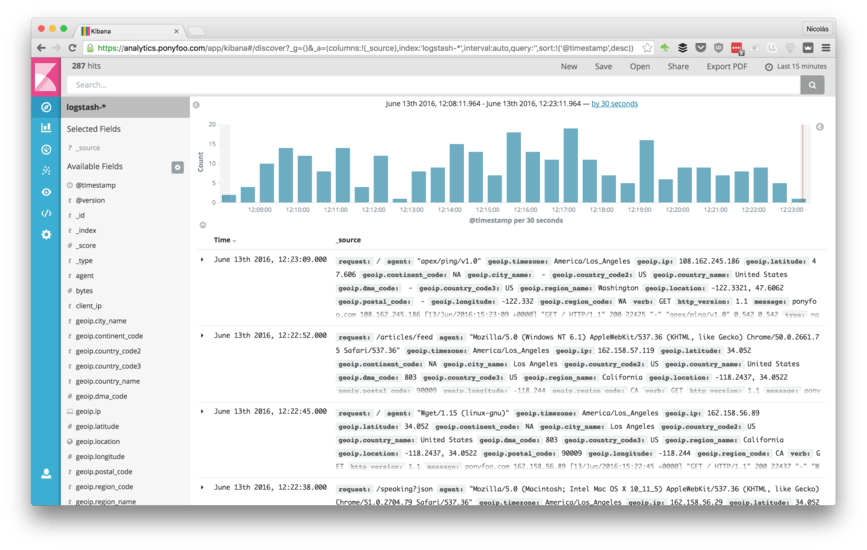
Data tables are nowhere near the most exciting kind of thing you can do in Kibana, though. Let's take a look at a few different charts I've set up, and while we're at it I'll explain the terminology used by the Kibana interface as well as a few statistics terms in layman's language. Articles have been written before that describe in detail everything you can do with Kibana visualizations, but I'll favor a real-world example-based approach.
Let's head to the Visualize tab for our first visualization.
Charting Status Codes and Request Volume
Create a pie chart and select logstash-* for the index pattern. You'll note that the default pie chart visualization is a whole pie containing every matching document and displaying the total count. Fair enough.
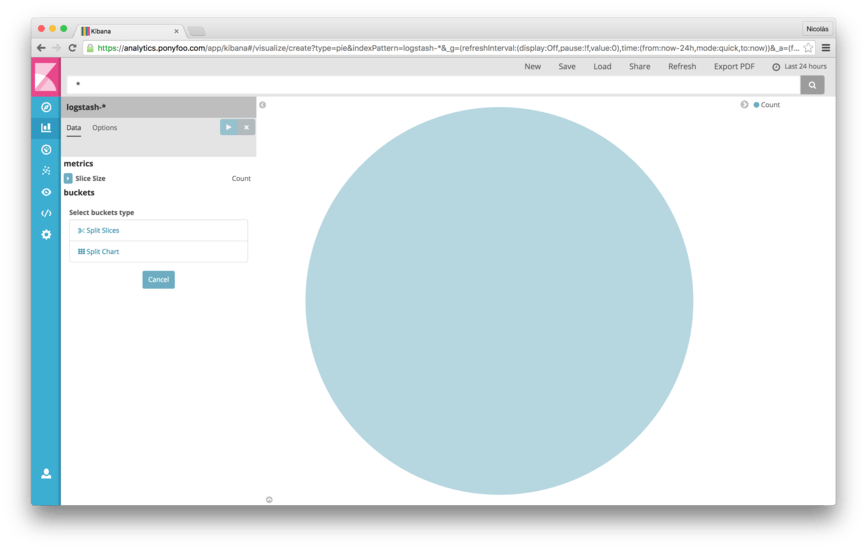
Add a Split Slices bucket with a Terms aggregation and choose the status field – then hit Enter. That sentence was overcharged with technical terms. Let's break it down. We are splitting the pie into several slices, using the Terms aggregation type to indicate that we want to identify distinct terms in the status field, such as 200, 302, 404, and grouping documents by that aggregation. We'll end up with an slice for documents with a status code of 200, another slice for documents with a 302 status code, and so on.
Generally speaking, a healthy application should be returning mostly 2xx and 3xx responses. This chart makes it easy to visualize whether that's the case.
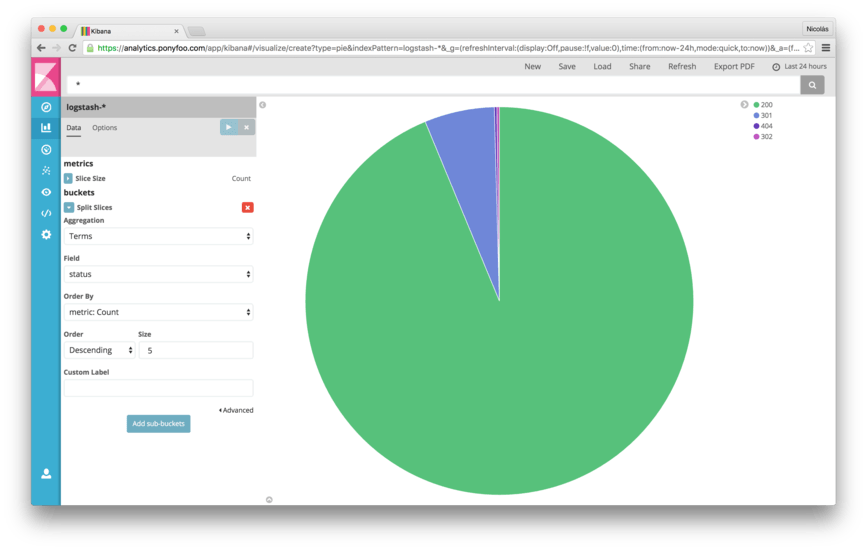
You can further specialize the graph by adding a sub-bucket, aggregating again using Terms, this time by the request.raw field. That way, you'll not only get a general ratio of status codes, but you'll also gain insight into which requests are the most popular, as well as which ones are the most problematic, all in one chart.
In the screenshot found below, you can see that the /articles/feed route is getting even more traffic than the home page.
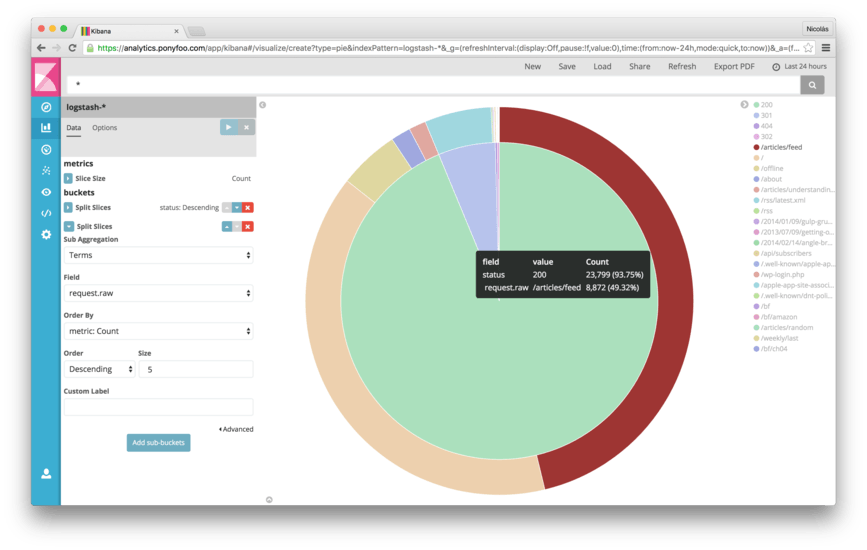
Maybe a little bit of caching is in order, since the RSS feeds don't change all that often. In the same light, earlier on these pie charts helped me identify and fix a bunch of requests for icons and images that were yielding 404 errors. That's something that would've been harder to spot by looking at the dense and raw nginx logs, but it's really easy to take action based on visualizations that help us work with the data.
Save the pie chart using the Save link on the top bar and give it a name such as "Response Stats".
Plotting Responses Over Time, By Status Code
Go back to the Visualize tab and create a new line chart. You'll see that we only get a single dot graphed, because there's no x axis by default. Let's add an X-Axis, using a Date Histogram of @timestamp. This is a fancy way of saying we want to group our data points into 30 minute long buckets. All events within a 30-minute window are grouped – aggregated – into a single bucket displaying the Count (that's the y axis). A Date Histogram makes it possible to render a large dataset into a line chart without having to render several thousands of individual data points. The Date Histogram aggregation allows you to define the time lapse you want to use to group events, or you can use the default Auto value of 30 minutes, as with the example below.

While it's useful to render requests over time, particularly when it comes to determining whether our server is functioning properly under load, experiencing a sudden surge of requests, or not responding to a single request, it's even more useful to understand the underlying sub-segments of data. What are the status codes for each of those responses over time? Was the spike that we saw in the earlier chart the product of 500 errors or just a spike in traffic?
Add a Split Lines aggregation by Terms using the status field. After hitting Enter (or the Play button), we'll note that the chart is now divided into several different lines, each line representing all responses that ended with a given status code. Now it'll be much easier to spot error spikes and discern them from spikes in traffic.
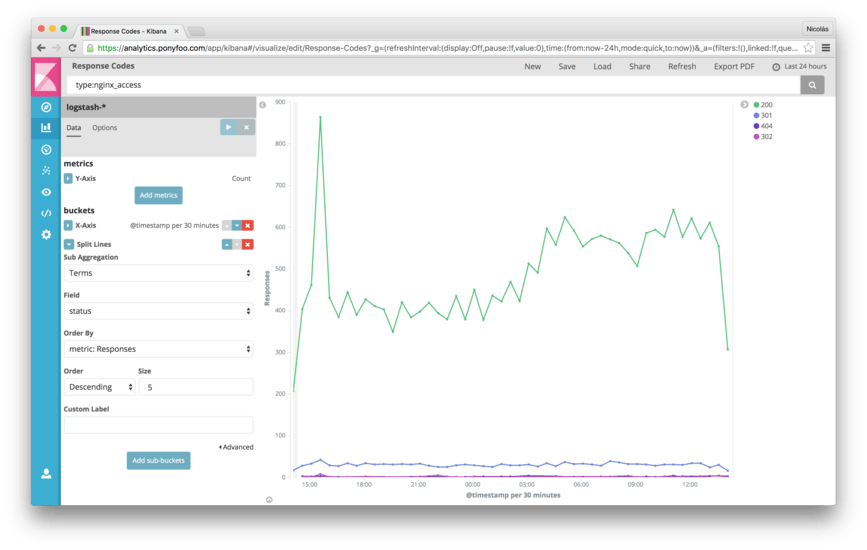
Save this chart as "Response Times", and let's create something else.
Charting Geographic Data
It's really easy to chart geographic data into a map using Kibana, provided that you've set up the geoip filter in Logstash as indicated earlier, so that the IP addresses found in nginx logs are transformed into geolocation data that can be charted into a map. Given that, it's just a matter of going to the Kibana Visualize tab, creating a Tile Map, and adding a Geo Coordinates bucket using the field computed by Logstash.
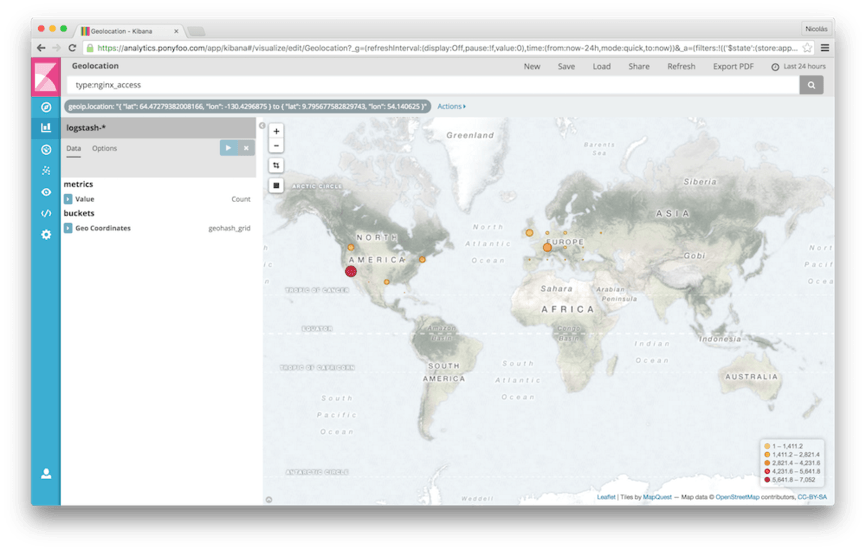
Save the map as "Request Locations".
Stitching It All Together
Now that we've created three different visualizations, where we have a rough overview of status codes and the hottest endpoints, time-based plots of each of the status codes, and a map showing where requests are coming from, it'd be nice to put all of that in a single dashboard.
Visit the Dashboard tab in Kibana, pick Add from the top-bar navigation and add all of our saved charts. After some rearranging of the charts, you'll get a dashboard like the one below. You can save this one as well, naming it something like "Overview". Whenever you want to get a glimpse into your operations now you can simply visit the Overview dashboard and you'll be able to collect insights from it.
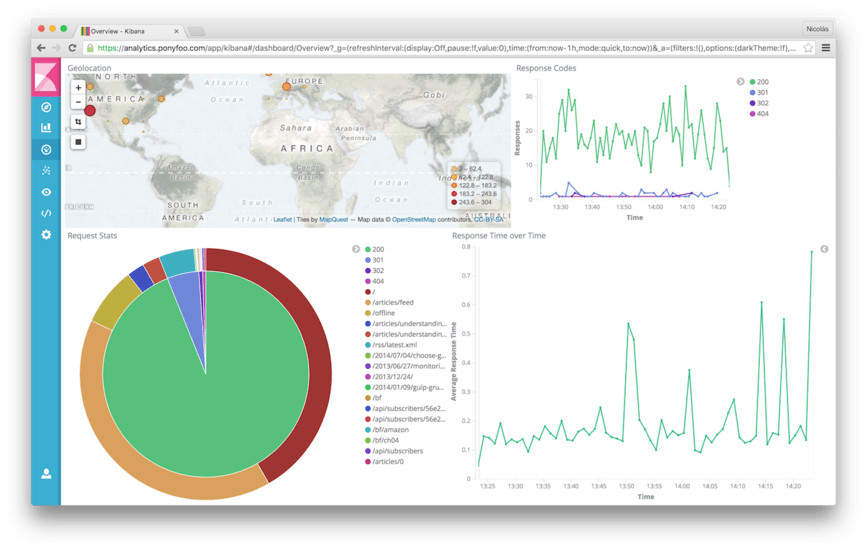
I've also included an "average response time" over time chart in my dashboard, which wasn't discussed earlier. You can plot that on a line chart with a y axis of a Date Histogram with minute or second resolution, and an x axis using an Average aggregation of request_time.
Securing access to your data and Kibana instance would be a most welcome and wise addition. We can do that using security features in X-Pack. Other X-Pack features include cluster health monitoring, alerting on changes in your data, reporting, and graph exploration.
I've set it up myself for my blog, and I must say that X-Pack is pretty awesome. Check out my deployment scripts to learn more about setting it up. In this article, I've decided against providing a more detailed description of the installation process and features in X-Pack. If you want to give it a shot, we offer a month-long trial where you can take all of these extra awesome features for a ride.
This post originally appeared on Pony Foo and the author built upon the Elasticsearch index set up for search in an earlier post.
