Monitoring Elasticsearch index lifecycle management with the history index
.jpg)
Howdy, all! In a previous blog, we outlined common index lifecycle management (ILM) issues and their resolutions. We’ve since added these common scenarios into our Elasticsearch documentation with example walkthrough videos. Here, we’ll expand on the ILM history index to demonstrate how to use it during troubleshooting and to set up proactive alerting when intervention is needed.
ILM theory
ILM automates common administrative tasks through logic and time delays, like rotating ingest to a new index, aging indices through hardware temperatures, and removing data after its retention period.
To protect data integrity, ILM sequentially performs these requested phases and their actions. Unlike some other industry tools, this means that if an index catches on a step, ILM will not proceed the index to a sequential step until the current issue has been resolved. This avoids midstates for advanced actions and is protective, for example, when an index’s ILM policy is marked to wait for snapshot before deletion in order to guarantee data is captured in a backup for compliance.
History index
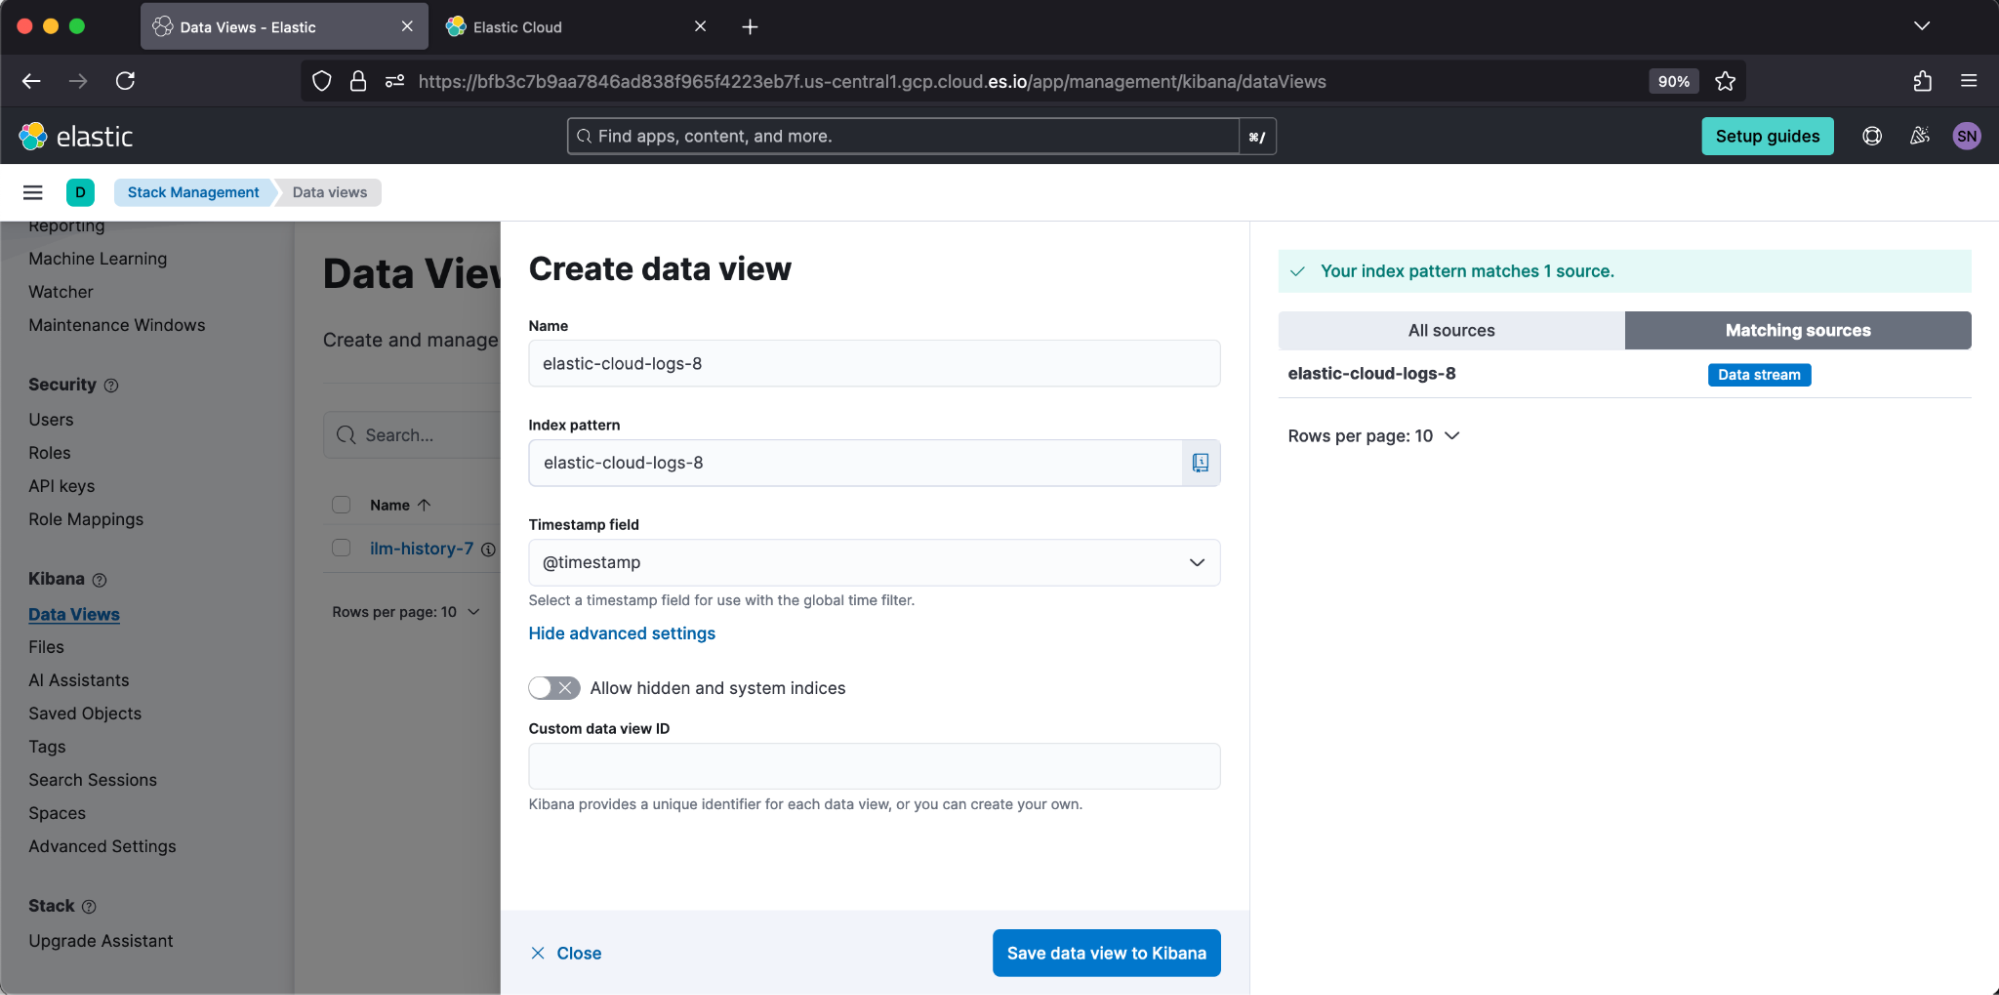
The ILM history index ilm-history-* stores the historical summary of indices’ ILM explain data. It is enabled by default under the setting indices.lifecycle.history_index_enabled. You can view this data in Kibana by creating a data view against this index pattern. For example, under Create data view, we will target the index pattern ilm-history-7.

Once created, we can review data under Discover. I prefer to browse the created index pattern by toggling the table columns: [index, policy, state.phase, state.action, state.step, success,error_details].
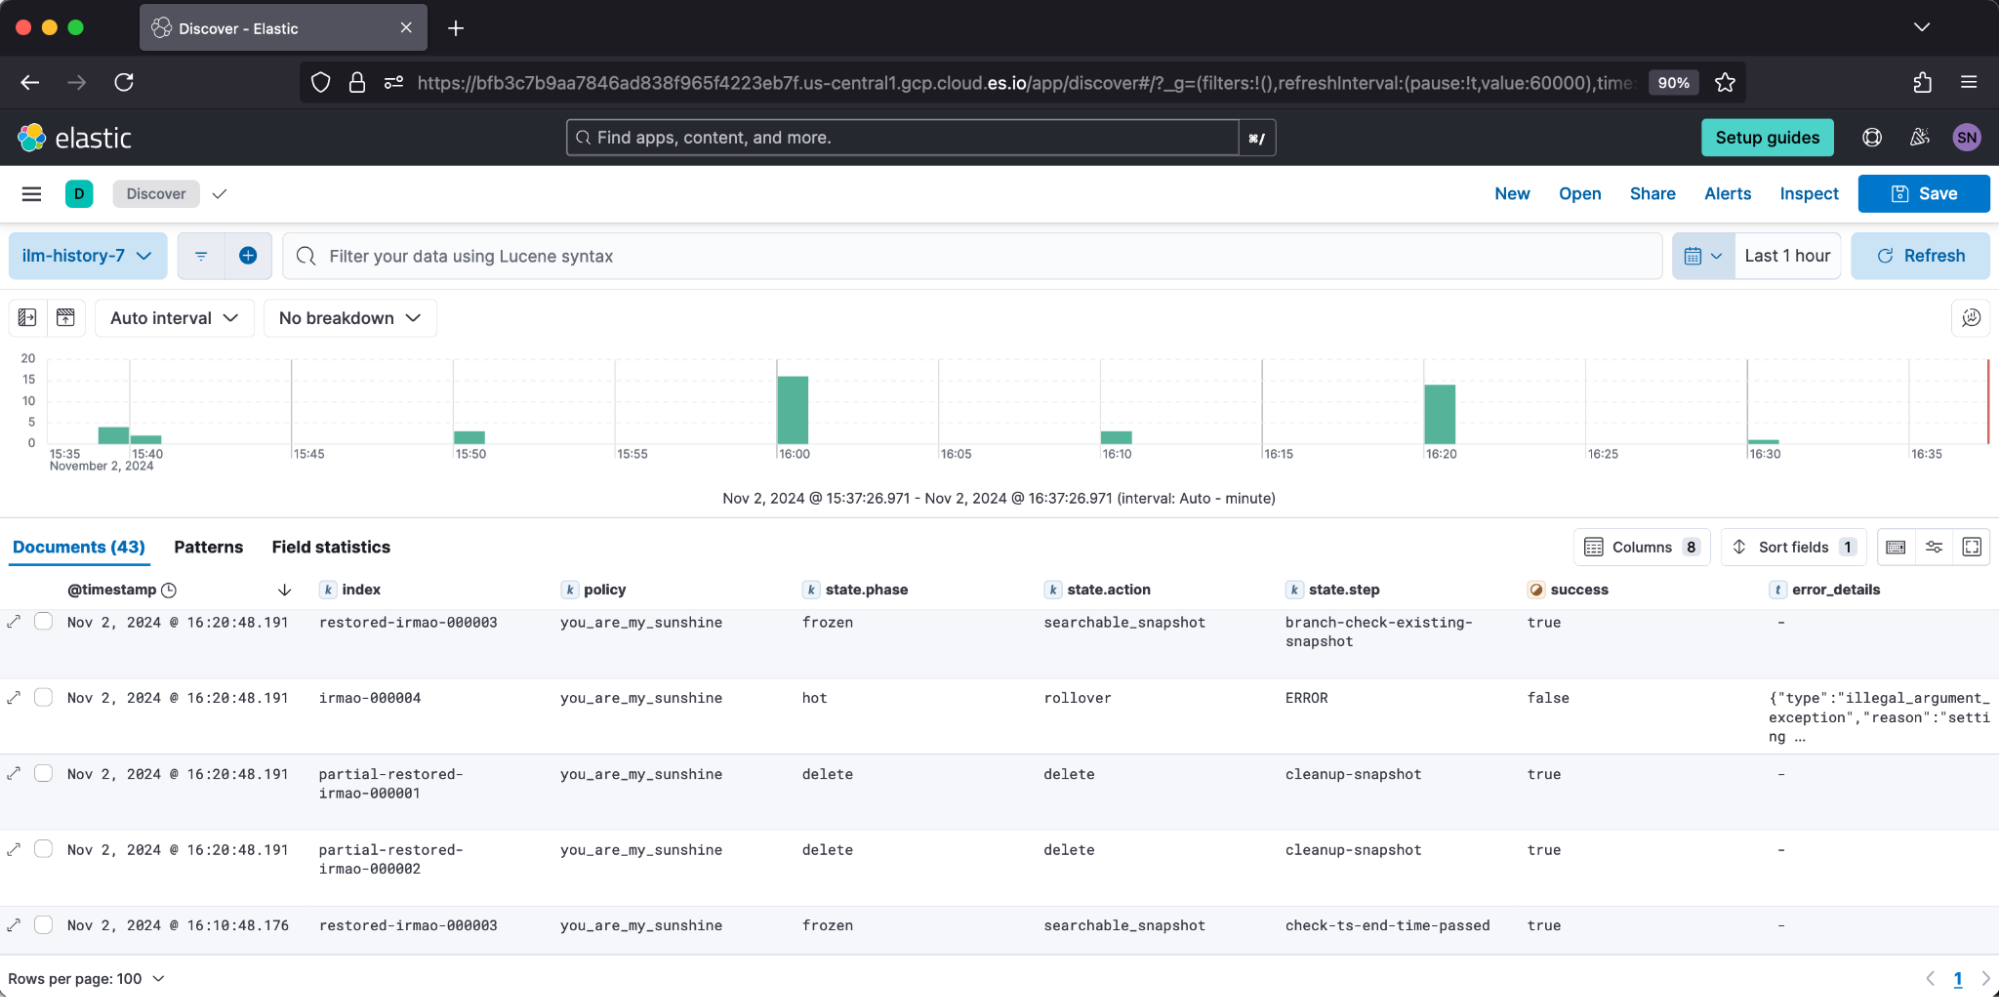
This log is helpful when troubleshooting why indices historically were experiencing issues performing their step, such as a rollover encountering error setting [index.lifecycle.rollover_alias] for index [x] is empty or not defined.
This can also be helpful to review if indices stayed on particular subactions longer than expected. For example, extended duration on migrate may indicate cluster or network strain. Alternatively, extended time in wait for snapshot may indicate repository health issues.
Similar ILM information is logged into Elasticsearch cluster logs but in a different format. Both are equally valid for troubleshooting. I find users prefer to retain ILM history longer than cluster logs for compliance reasons. Let’s show the similarities! Under Elastic Cloud, I enabled logs and metrics so that I can create a data view against elastic-cloud-logs-8.
Then, in Discover, I can filter to log.logger: "org.elasticsearch.xpack.ilm.IndexLifecycleRunner".
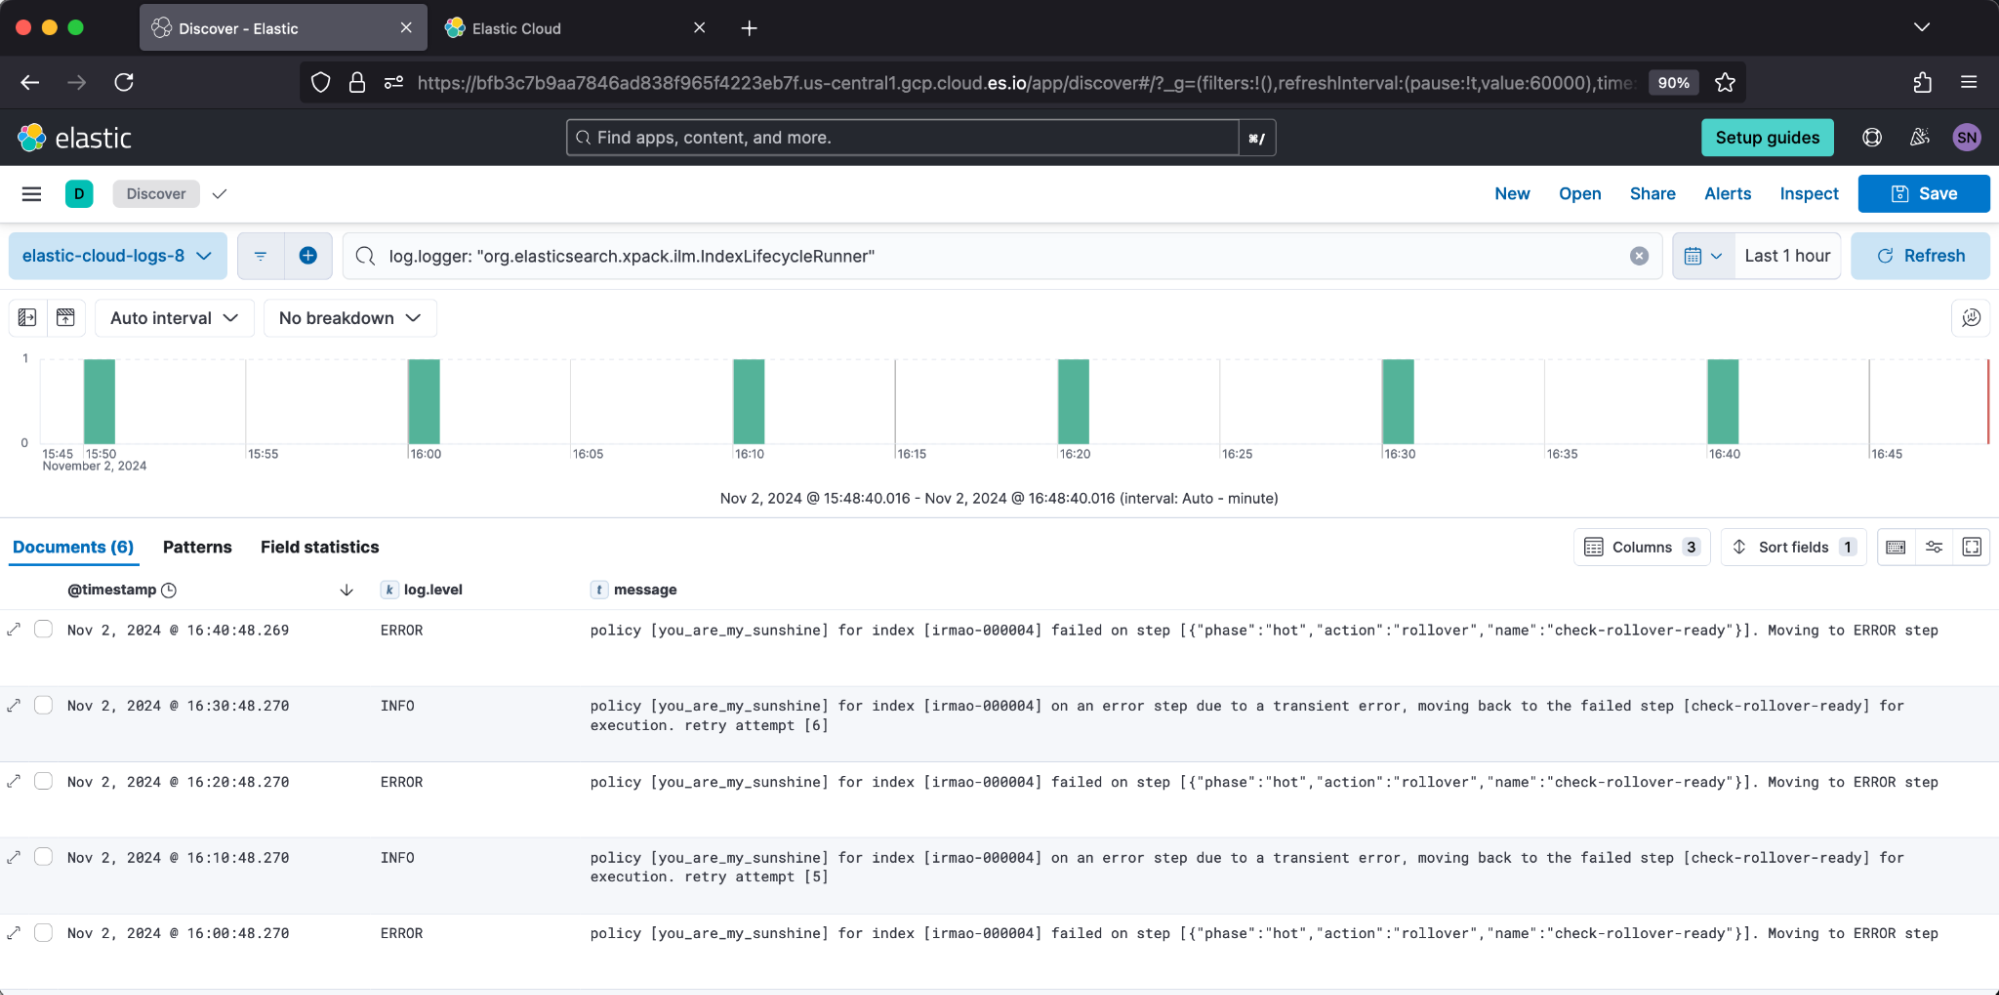
You’ll notice the 10-minute periodicity, which is answered by ILM’s setting indices.lifecycle.poll_interval value.
Check for issues
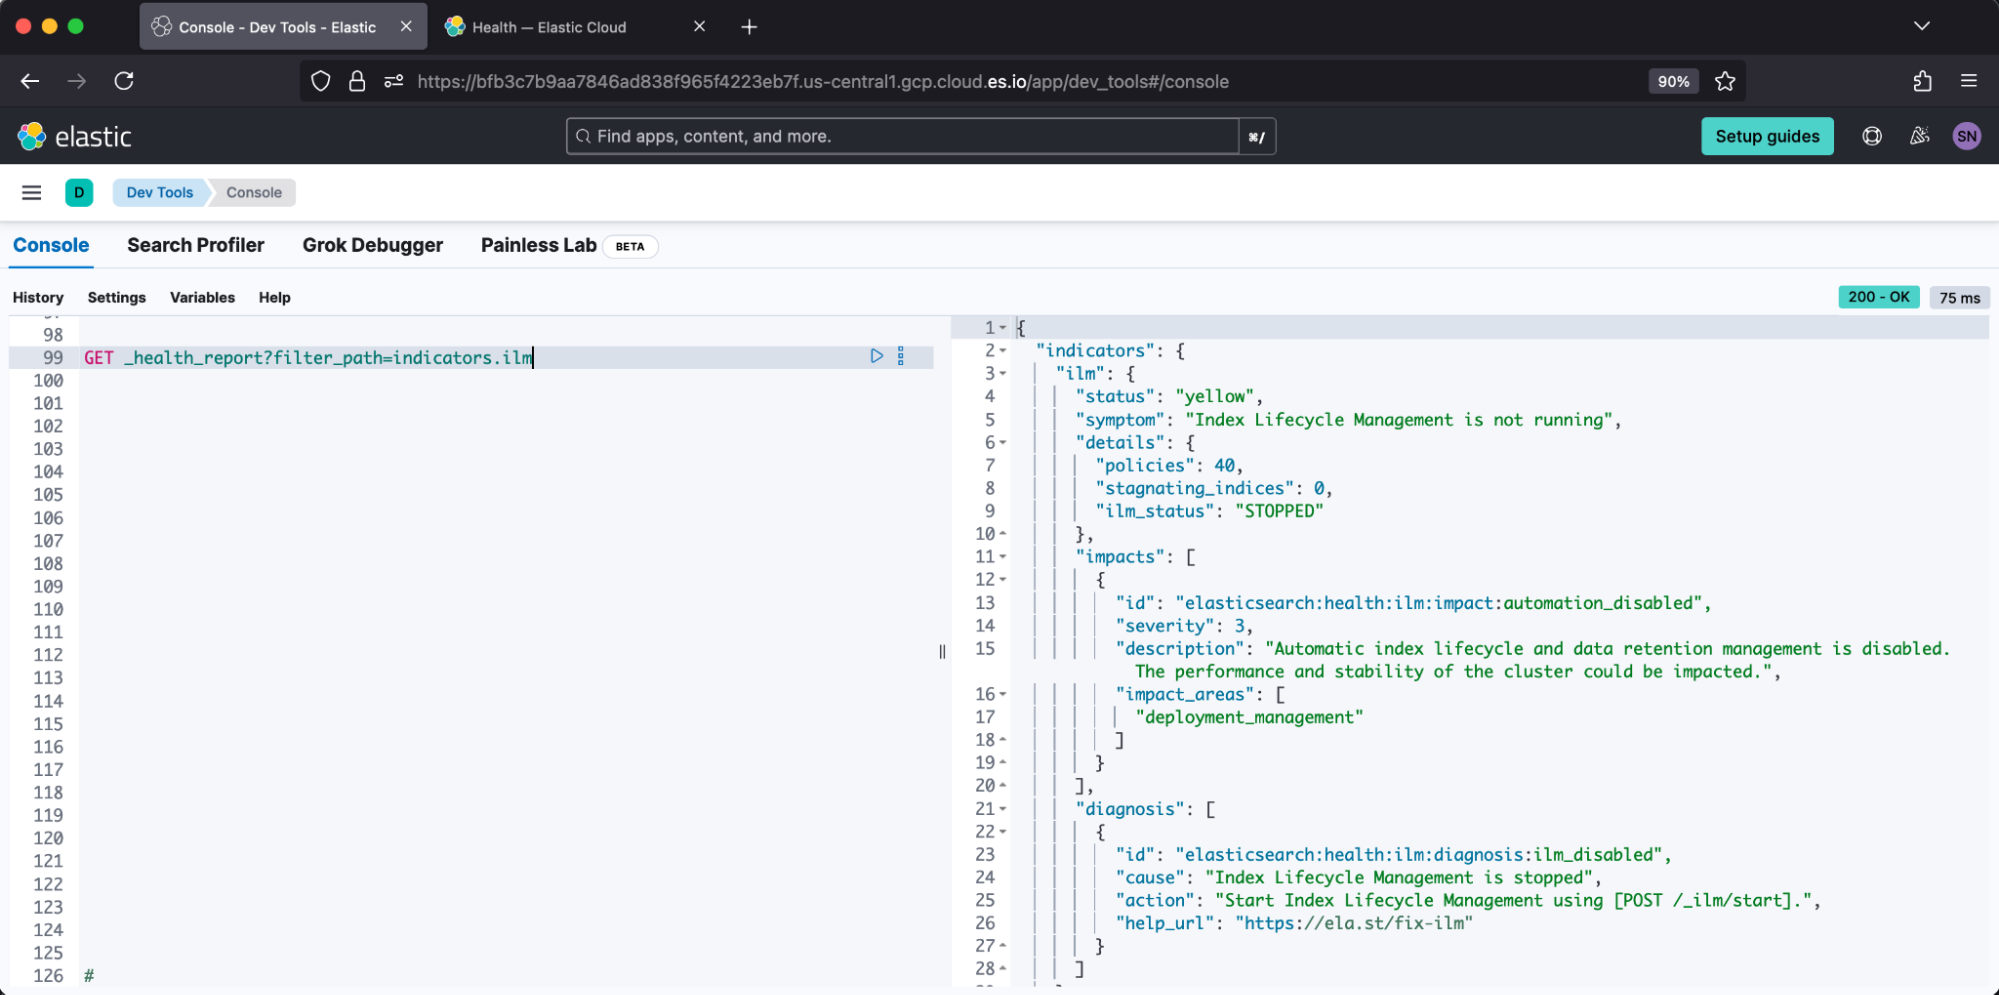
We recommend using the Health API introduced in v8.7 to check for active ILM issues. This reports against both errors and stagnated steps, so it is more thorough than scrolling through ILM explain. A healthy result from Dev Tools appears:
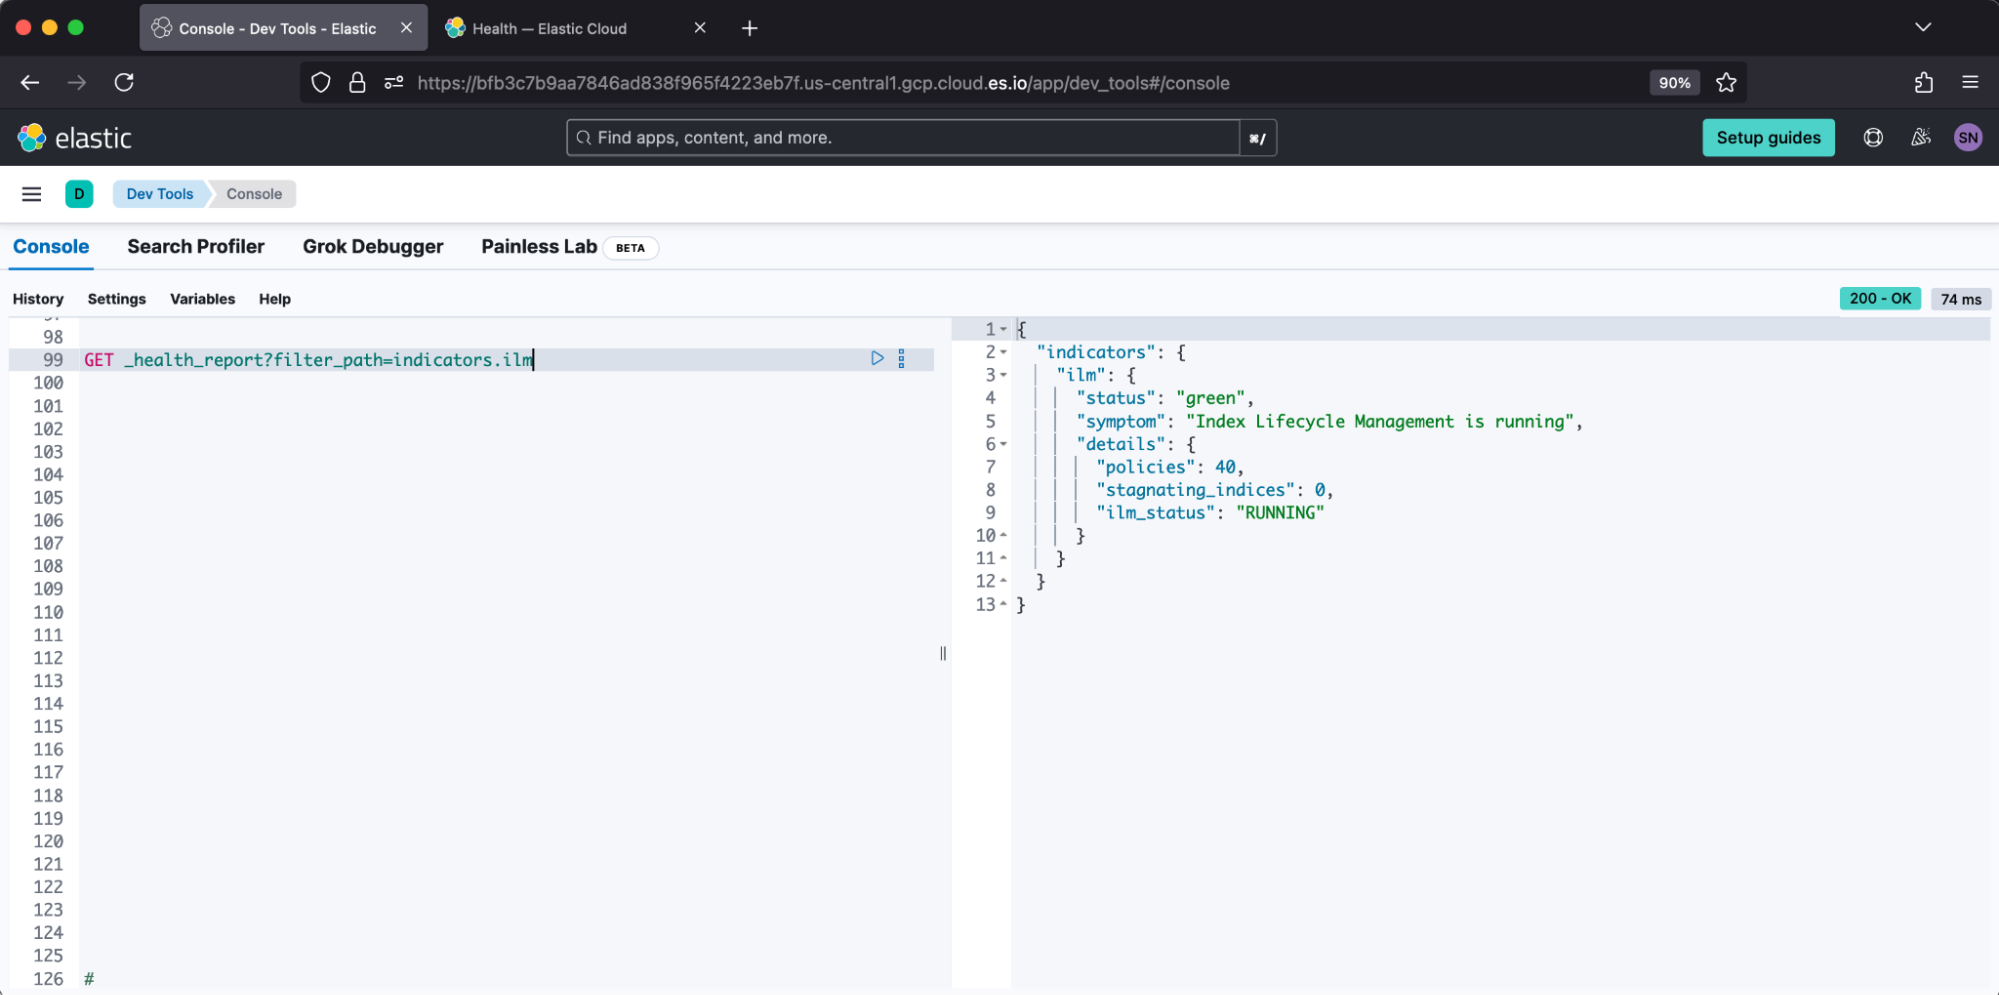
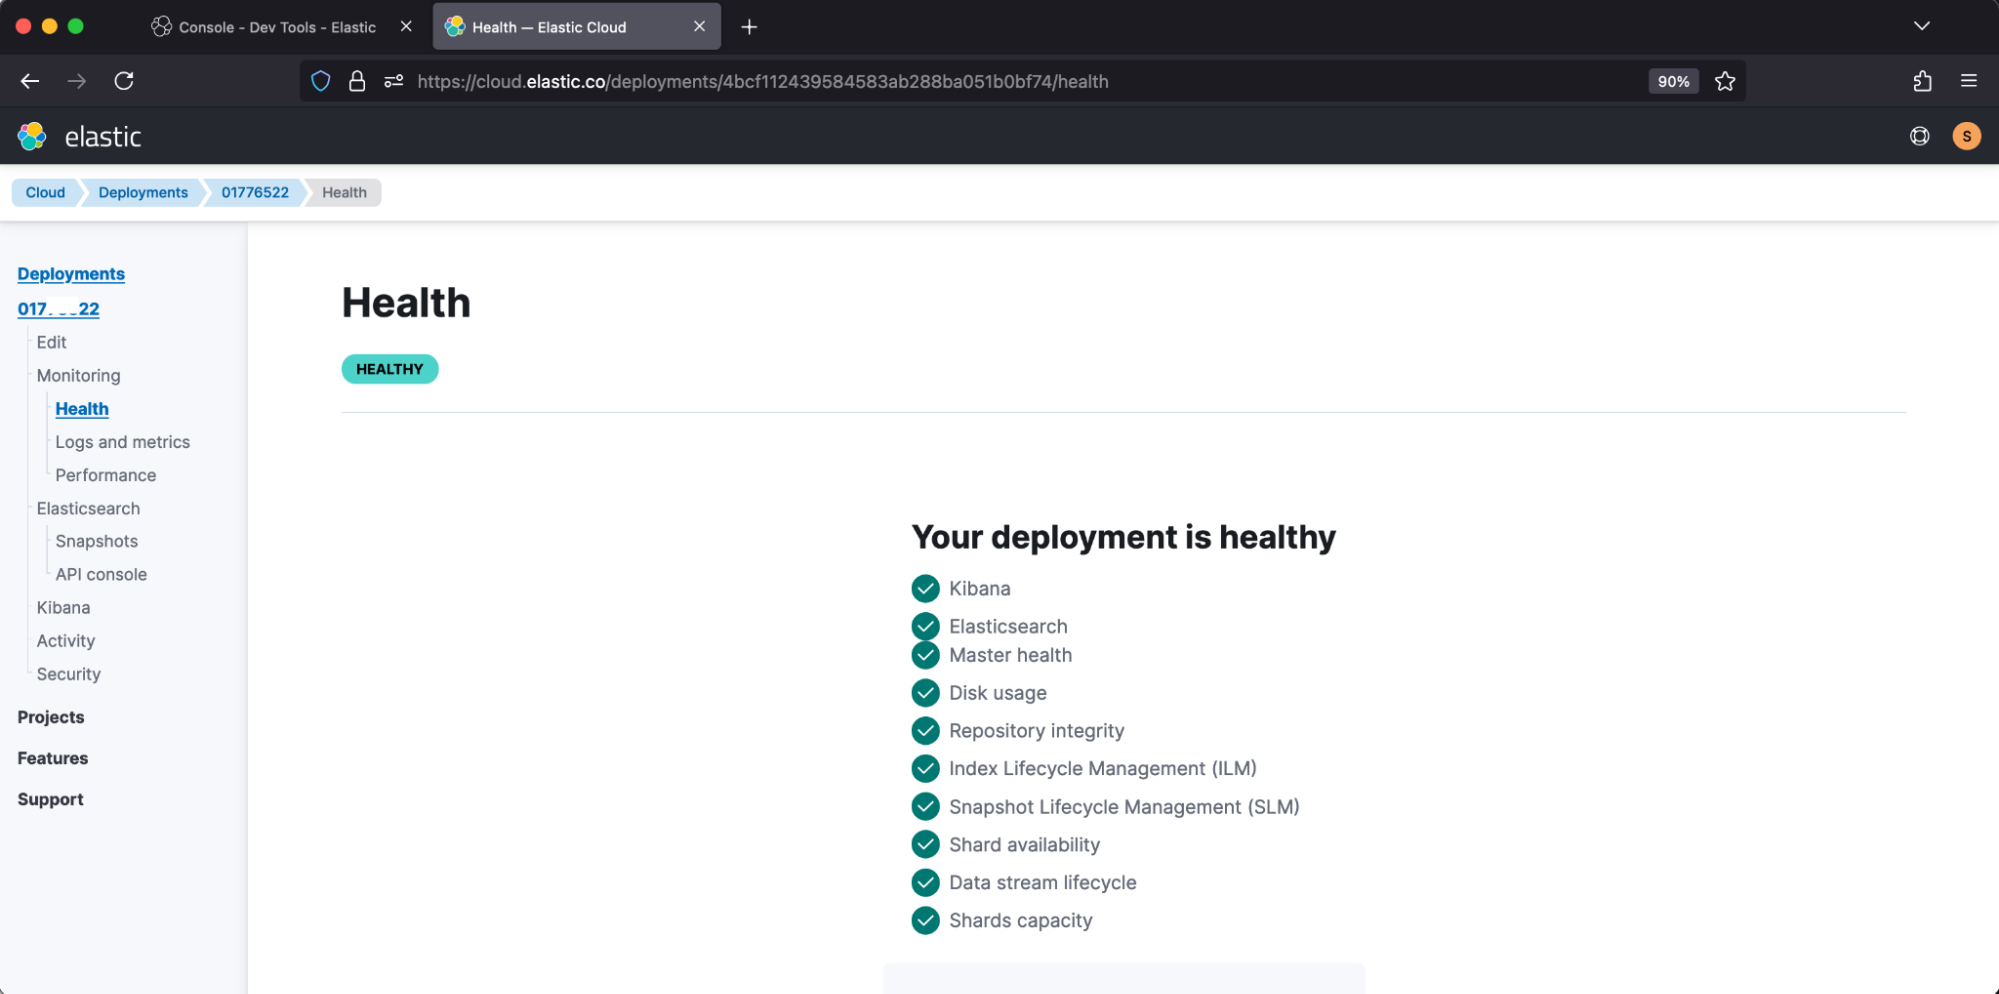
Elastic Cloud loads this information into its deployment health, which reports:
An example of an unhealthy report from Dev Tools appears:
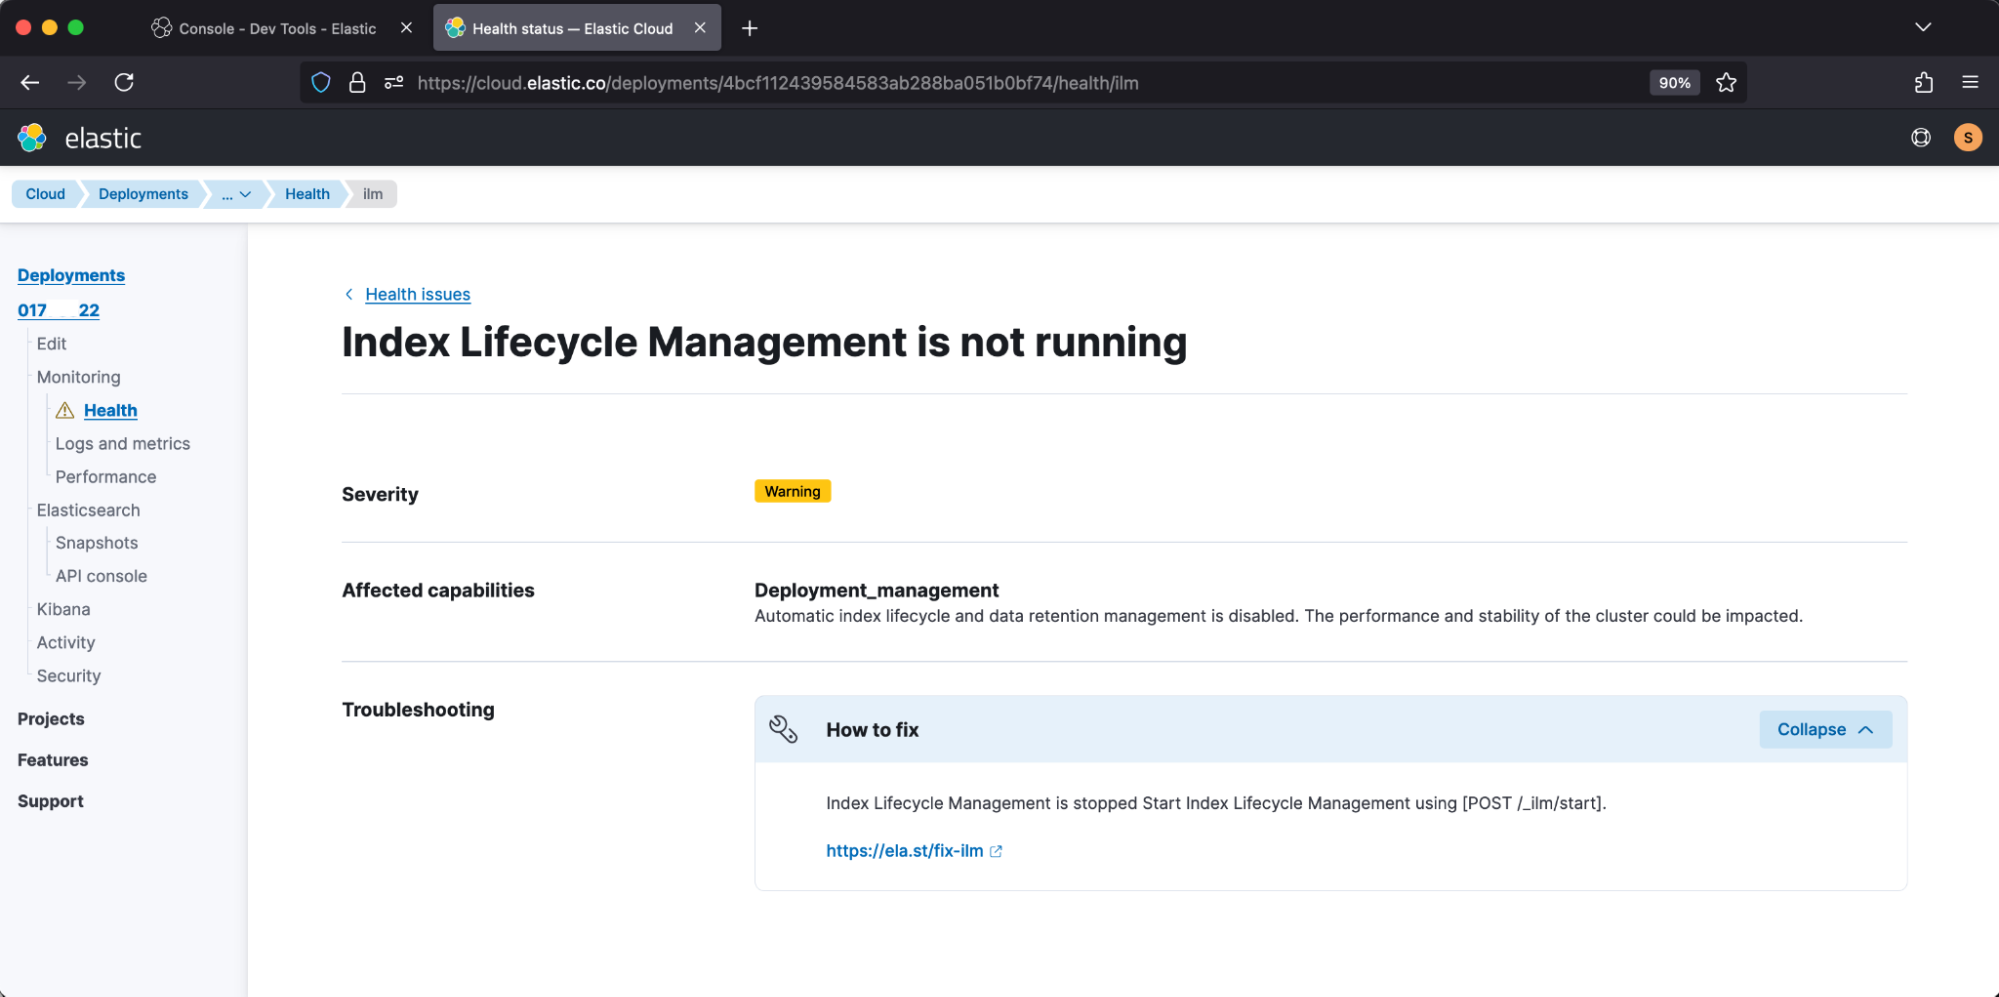
Elastic Cloud correspondingly reports:
Monitor errors
We recommend setting up monitoring Kibana rules to be notified when intervention is needed to rectify an index’s ILM error, so it can then proceed through its lifecycle. This setup is on top of Stack Monitoring and its other performance alerts.
As an example, under Create Rule, we’ll select Stack Alerts, then choose type Elasticsearch query.
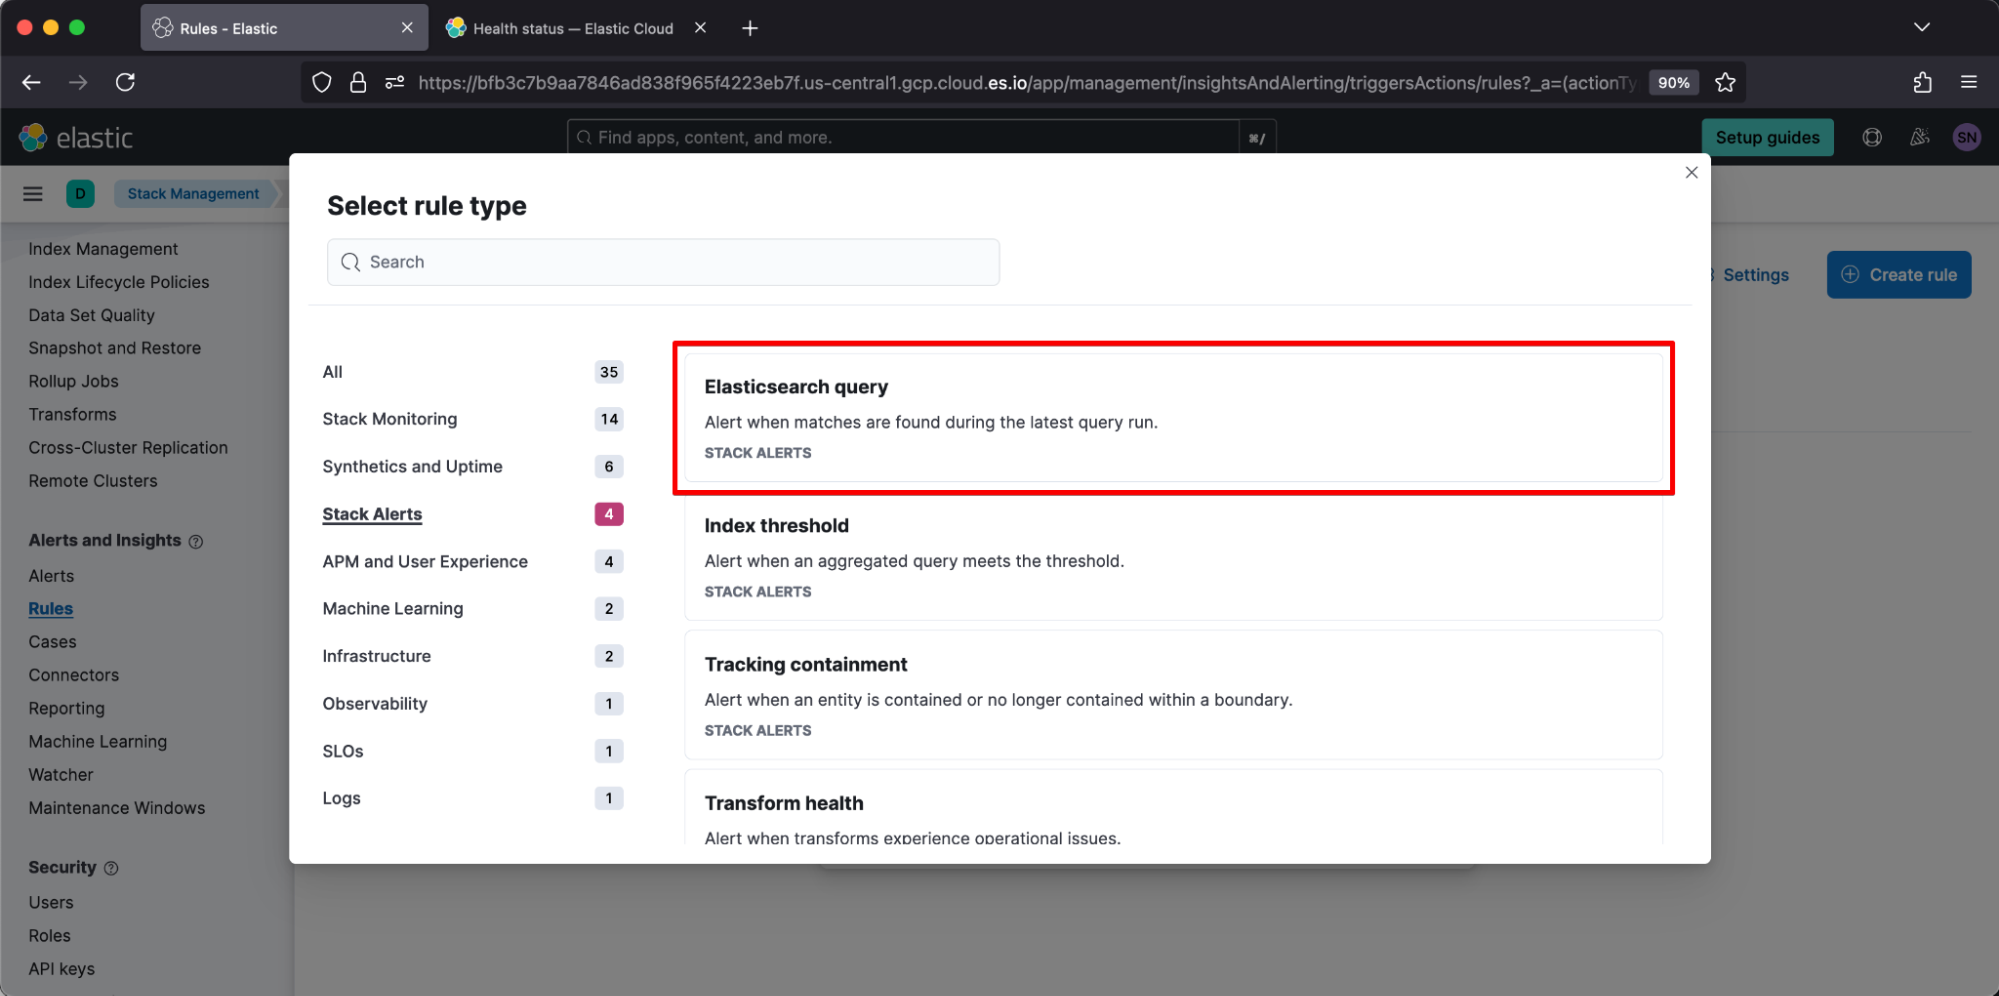
We’ll give our rule a name “ILM erring.” Scrolling down, we’ll target data view ilm-history-7 with Lucene query error AND log.logger:"org.elasticsearch.xpack.ilm.IndexLifecycleRunner". For our example, we want to be notified for any matches, so we will set the threshold to “is above 1.”
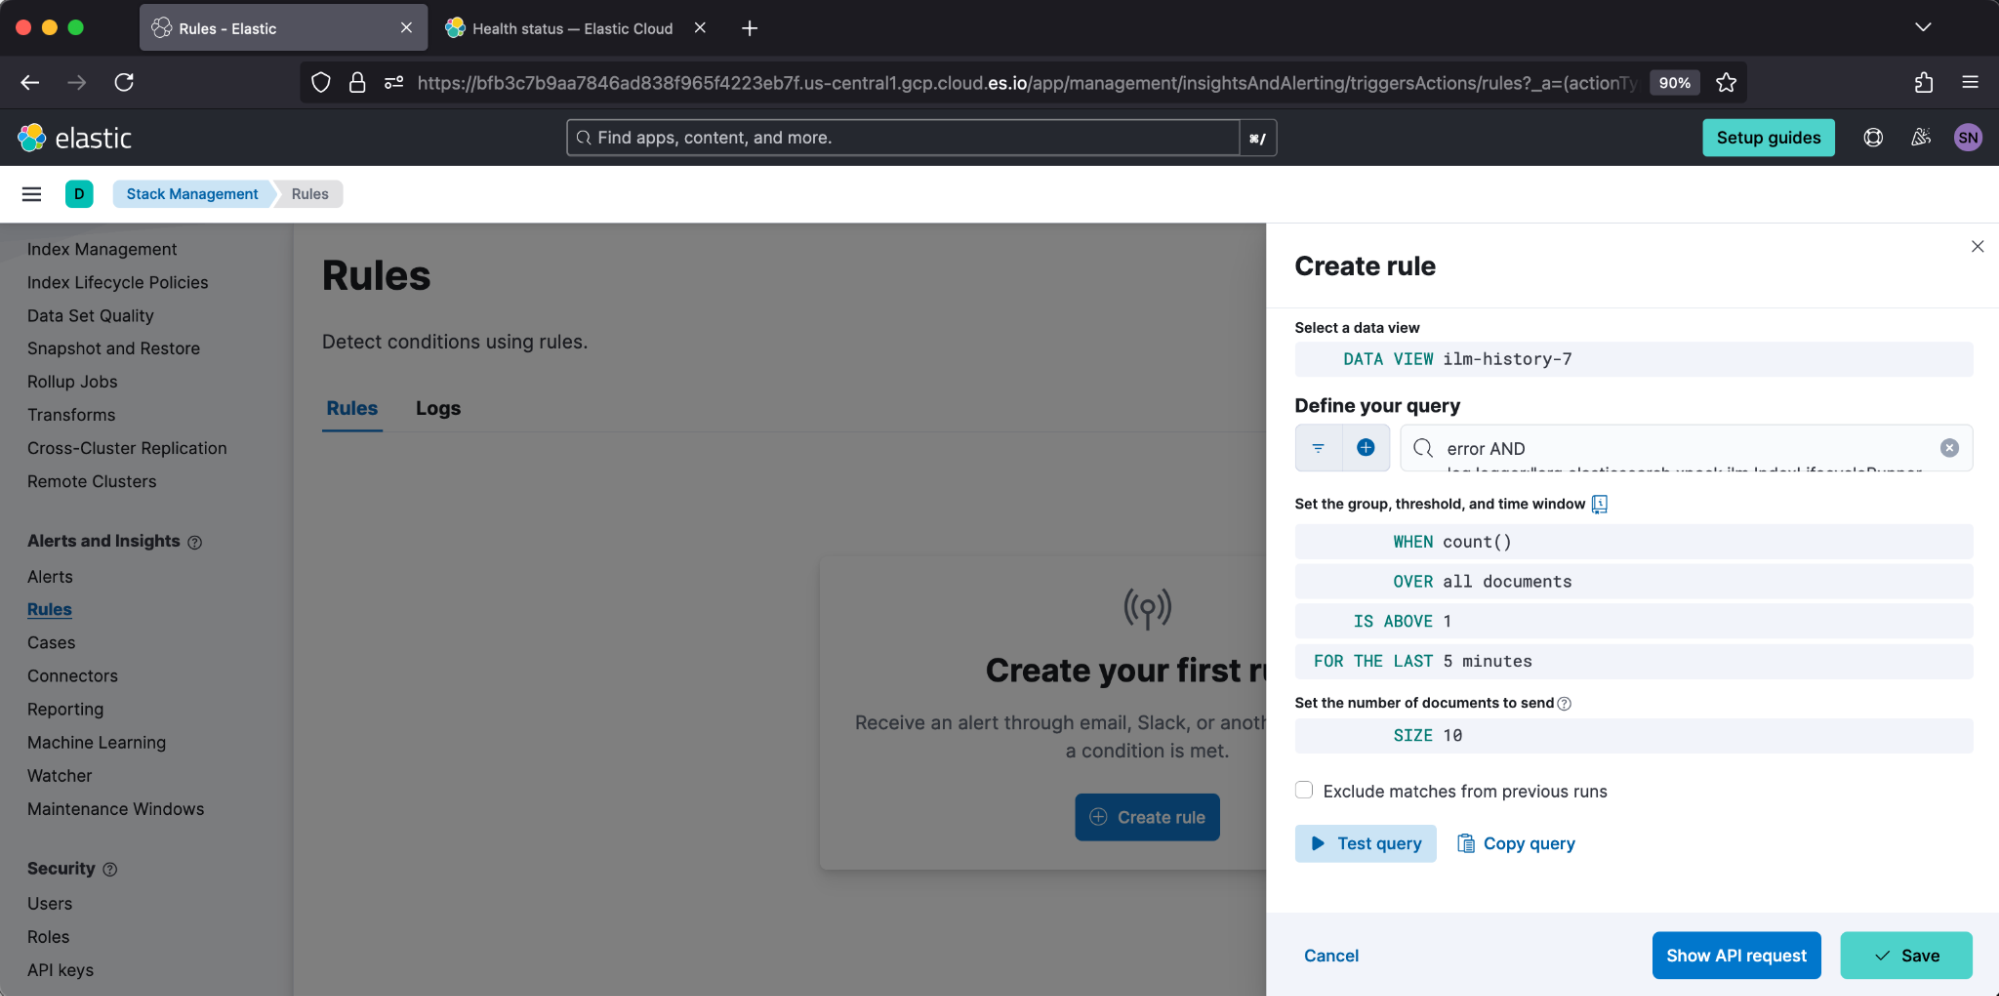
Further down, we’ll enable a notification action. For our example, we’ll use Elastic Cloud’s built-in SMTP server to email our on-call distribution email.

And that’s it! The example team will now be notified when intervention is required to keep ILM healthy by using the ILM history index. When your team is notified, they may be interested in our walkthrough video on checking ILM Health and our common setup issues and resolutions. Here’s to a quiet on-call for us all!
The release and timing of any features or functionality described in this post remain at Elastic's sole discretion. Any features or functionality not currently available may not be delivered on time or at all.