External collection for Elastic Stack Monitoring is now available via Metricbeat
We are pleased to announce the general availability of external collection for Elastic Stack Monitoring. With this announcement comes the ability to monitor Elasticsearch, Kibana, Logstash, APM server, and Beats all via Metricbeat modules.
Using external collection, users now have the capability to collect and send monitoring data for their Elastic Stack without having to depend on the health of the monitored services. This release dramatically improves the reliability and flexibility of options for monitoring the Elastic Stack. Using external collection is a recommended approach for all users of Elastic Stack Monitoring.
Background
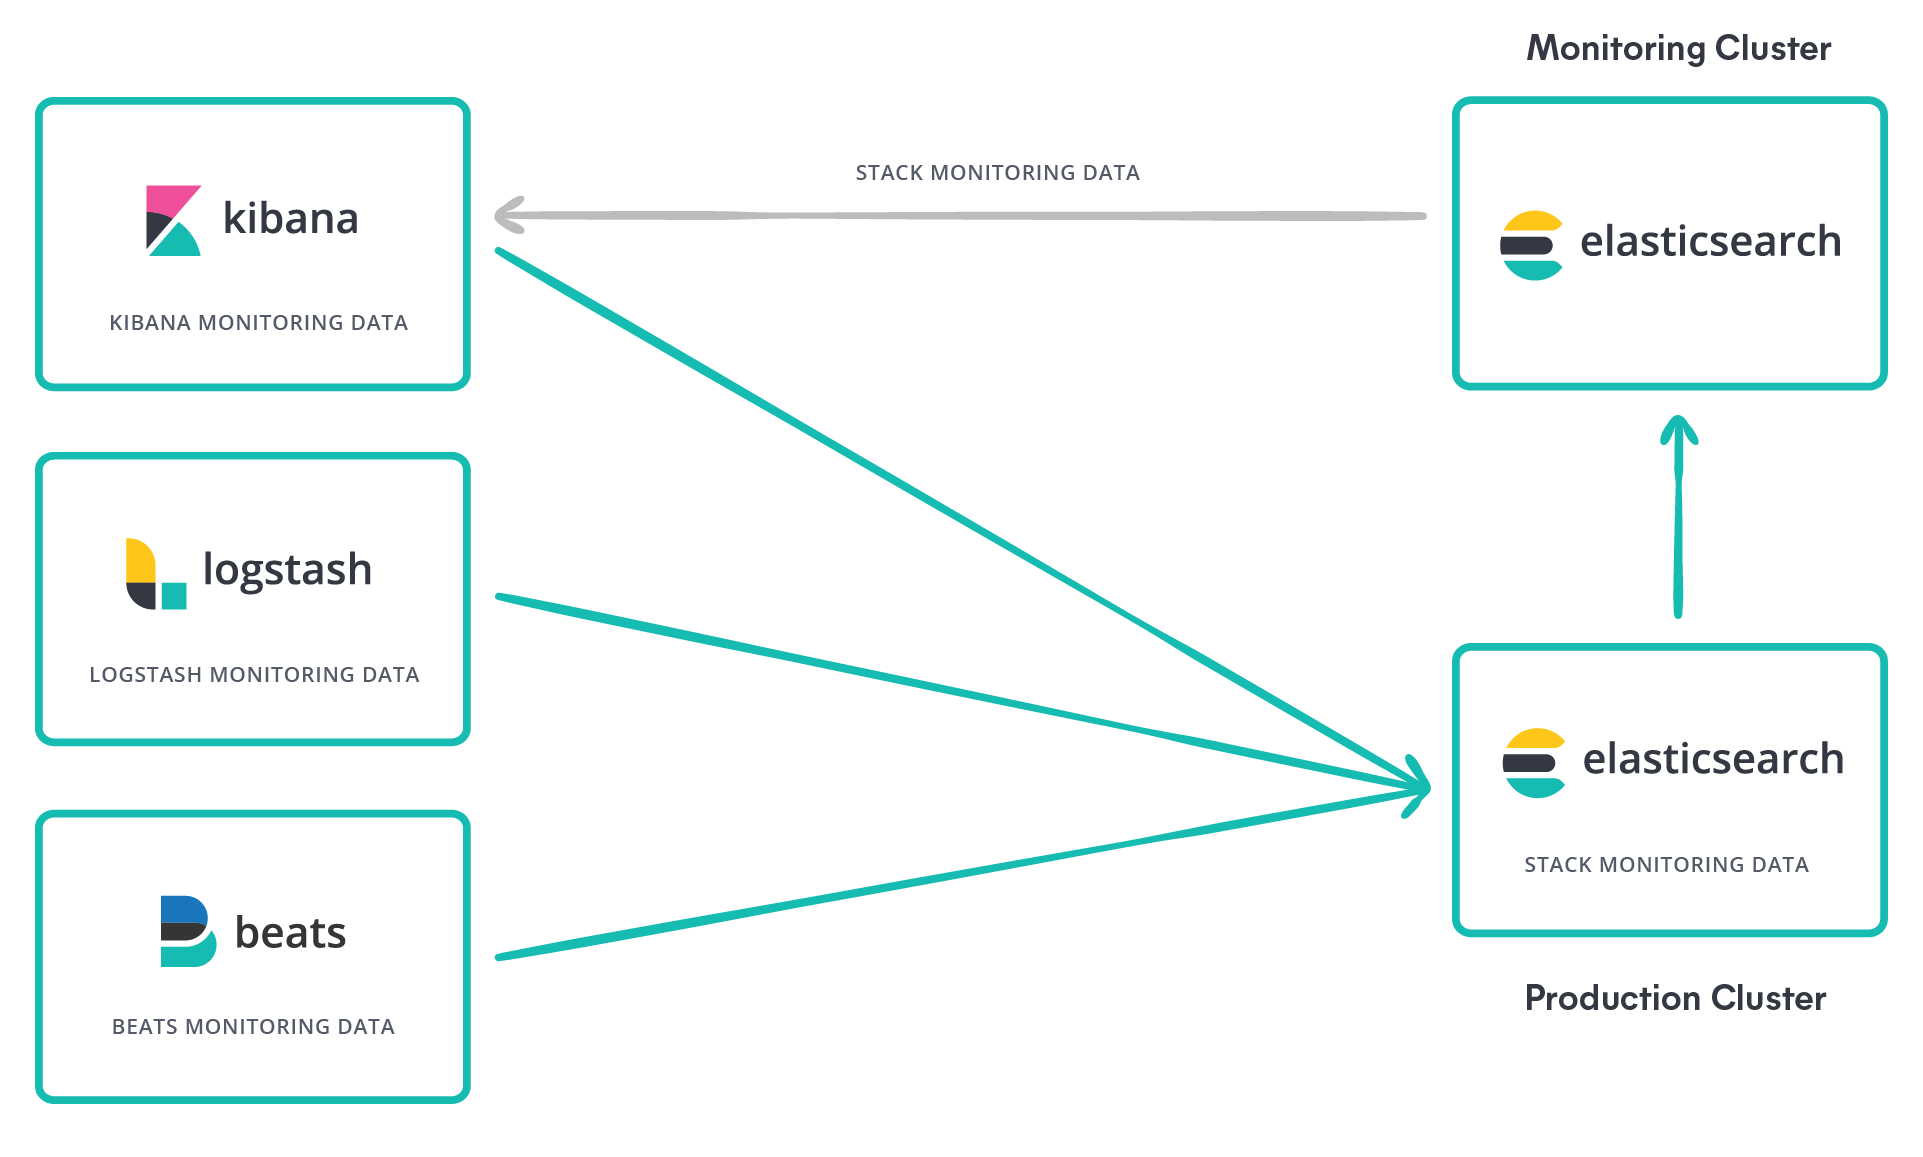
Previously, services in the Elastic Stack gathered and shipped their own monitoring data — a process known as internal collection.
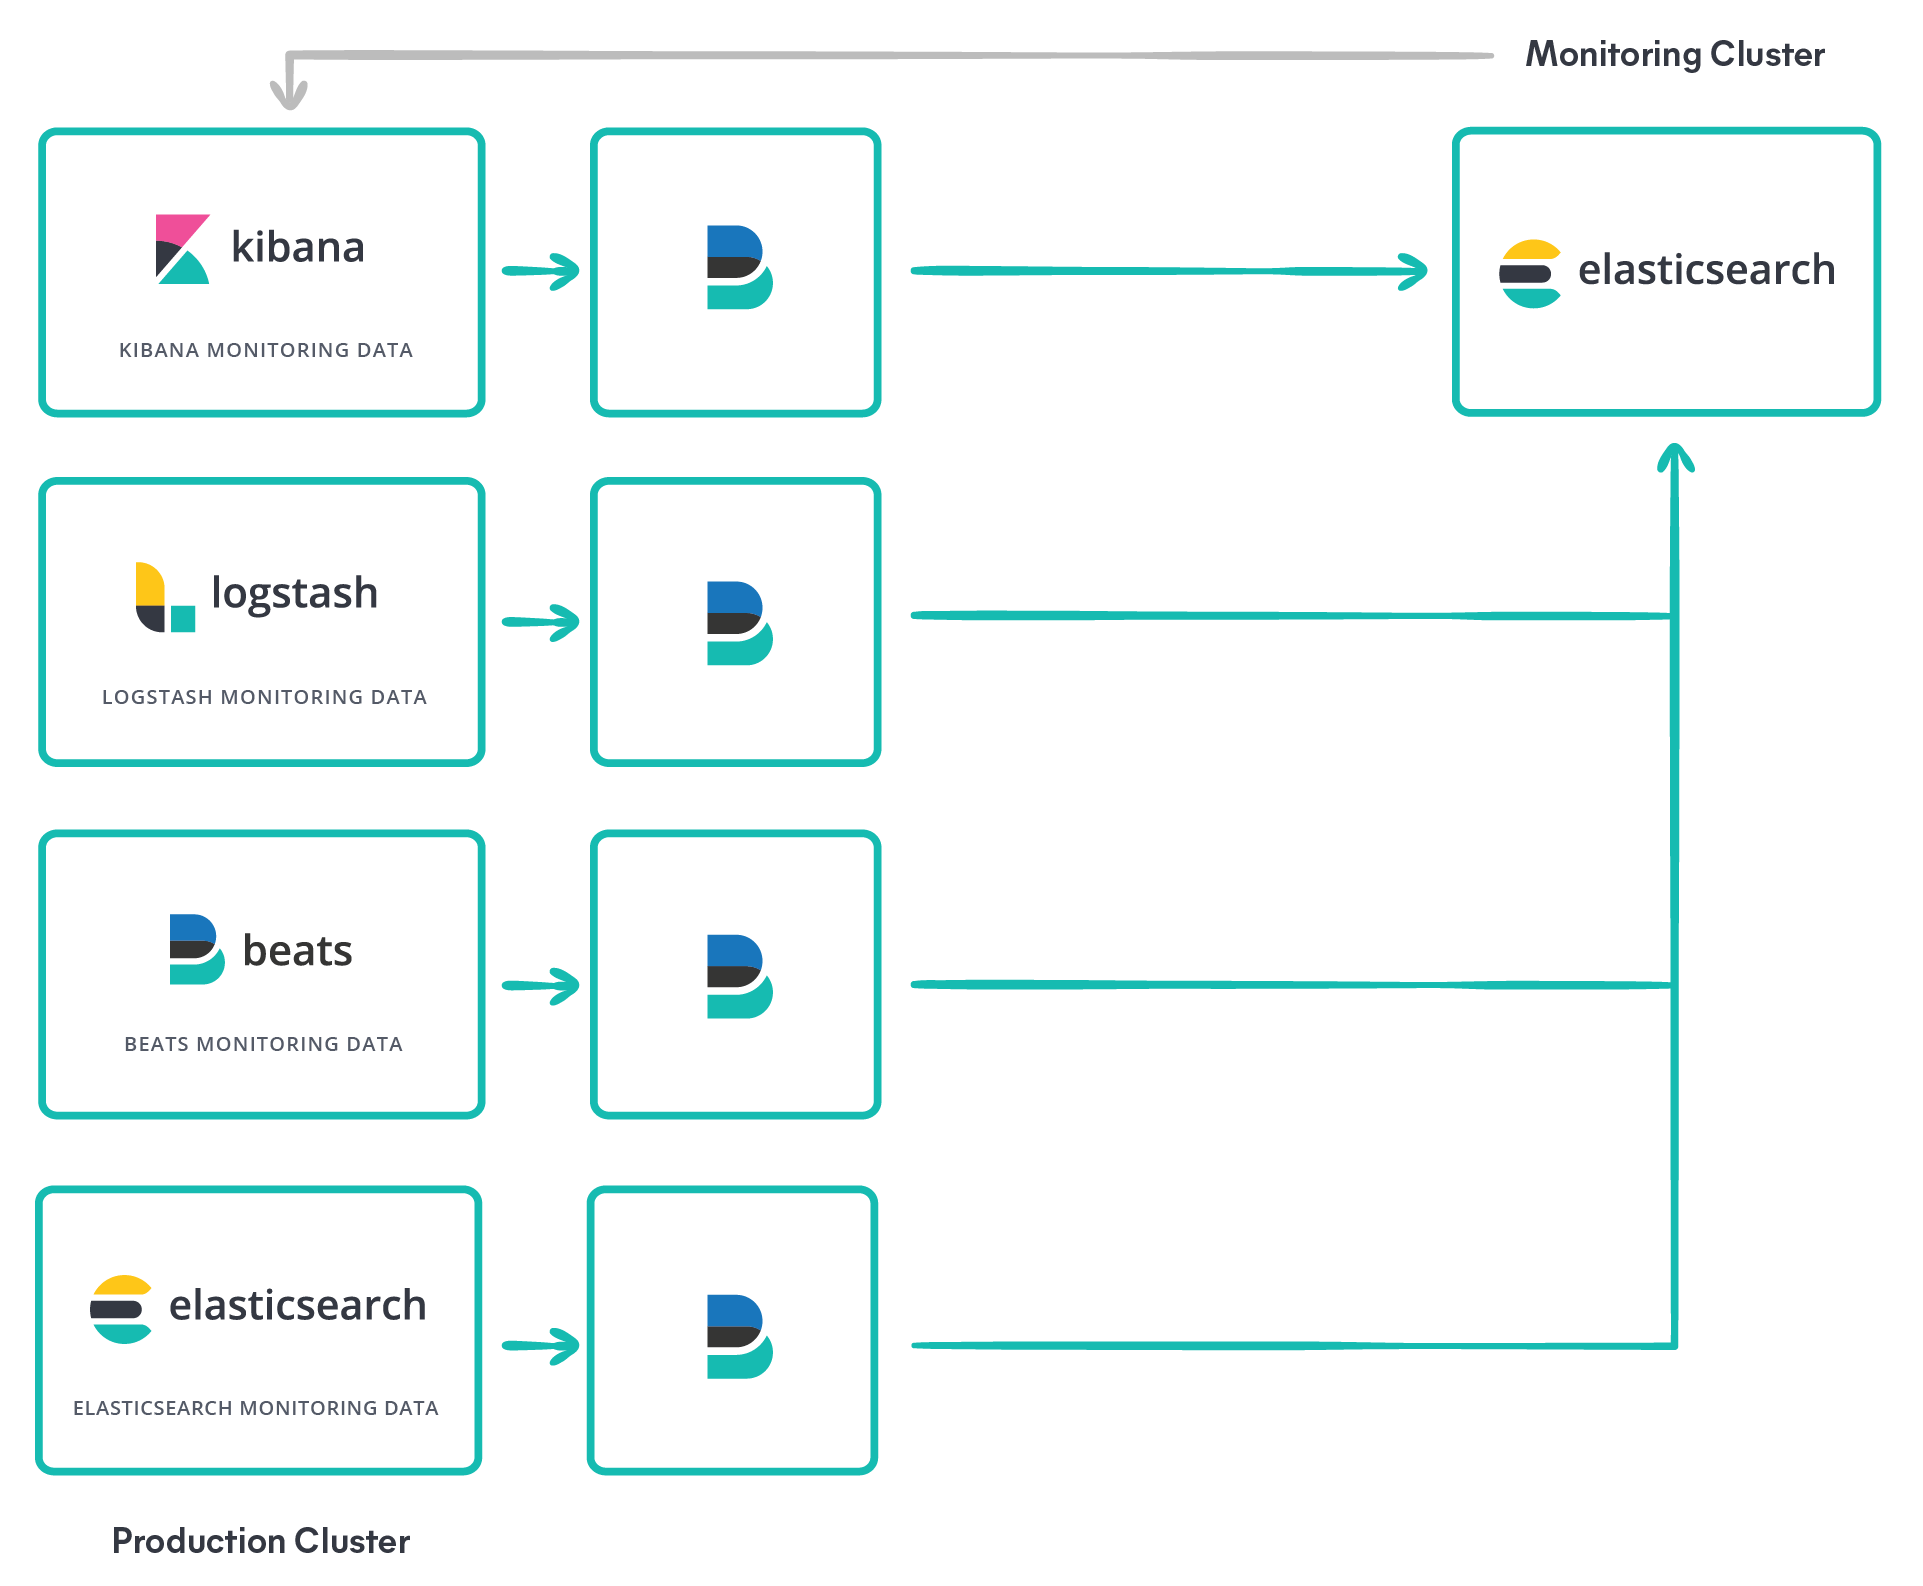
With the introduction of external collection, users gain the ability to run Metricbeat alongside each type of monitored services, such as Elasticsearch, to gather and ship monitoring data about its health and performance directly to the monitoring cluster.
In the past, Stack Monitoring has required that one send all monitoring data first to the production cluster where it would then be forwarded to the monitoring cluster. This requirement was undesirable because, of course, monitoring is of the most value when the production cluster is suspected to be under duress!

With the introduction of Metricbeat as the agent for collecting and shipping monitoring data, the need to route monitoring data through the production cluster has been removed. Monitoring data can now be collected by an independent, lightweight monitoring agent and sent directly to the monitoring cluster.

Using Metricbeat for monitoring collection means less work for the production cluster and more resilience for your monitoring setup.
How do I use it?
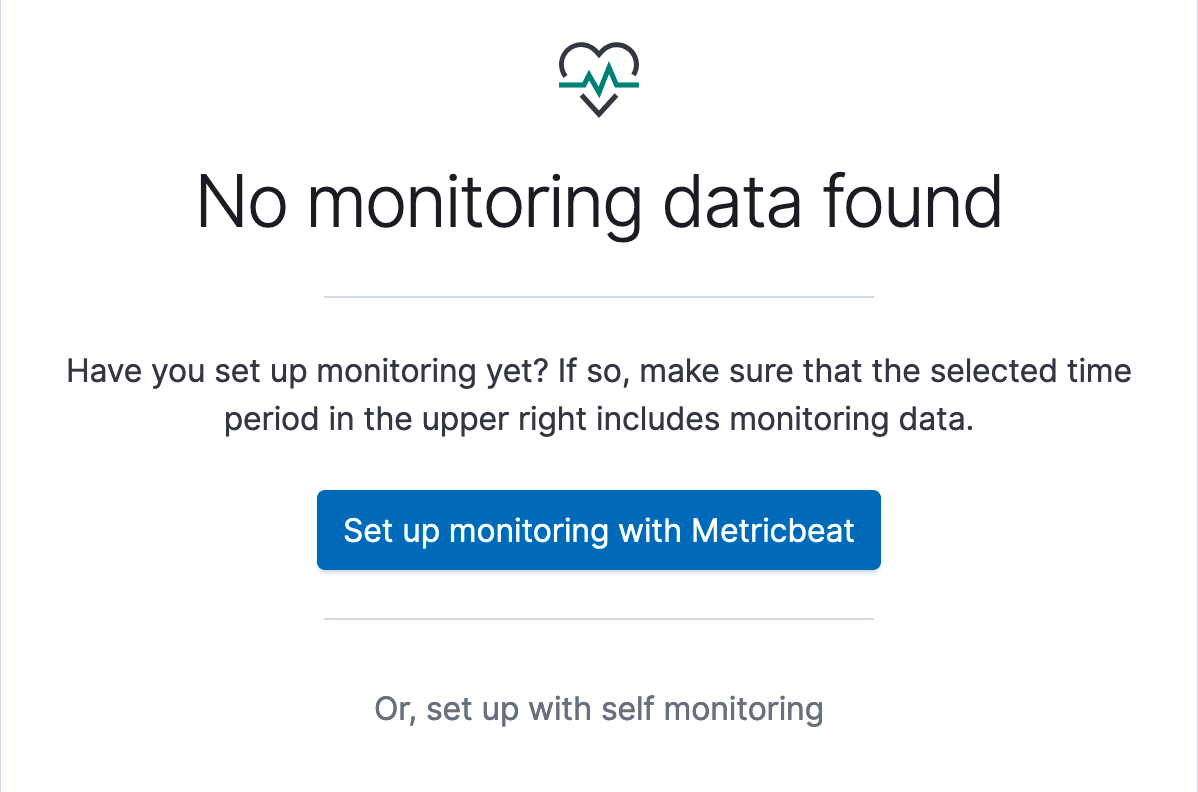
If you’ve never used Stack Monitoring to track the health and performance of your Elastic Stack services, now is a great time to try! To get started with Stack Monitoring, follow the instructions. When prompted in the Kibana interface, choose Set up with Metricbeat.

From there, you’ll be walked through step-by-step instructions on how to configure Metricbeat for external collection and a configuration will be generated for you which you can simply copy and paste into a configuration file on your system!
If you’ve set up Stack Monitoring in the past, you’ve likely used internal collection, which was enabled via a single button-click in the Stack Monitoring interface.
Luckily, migrating from internal collection to external collection for Stack Monitoring is very simple.
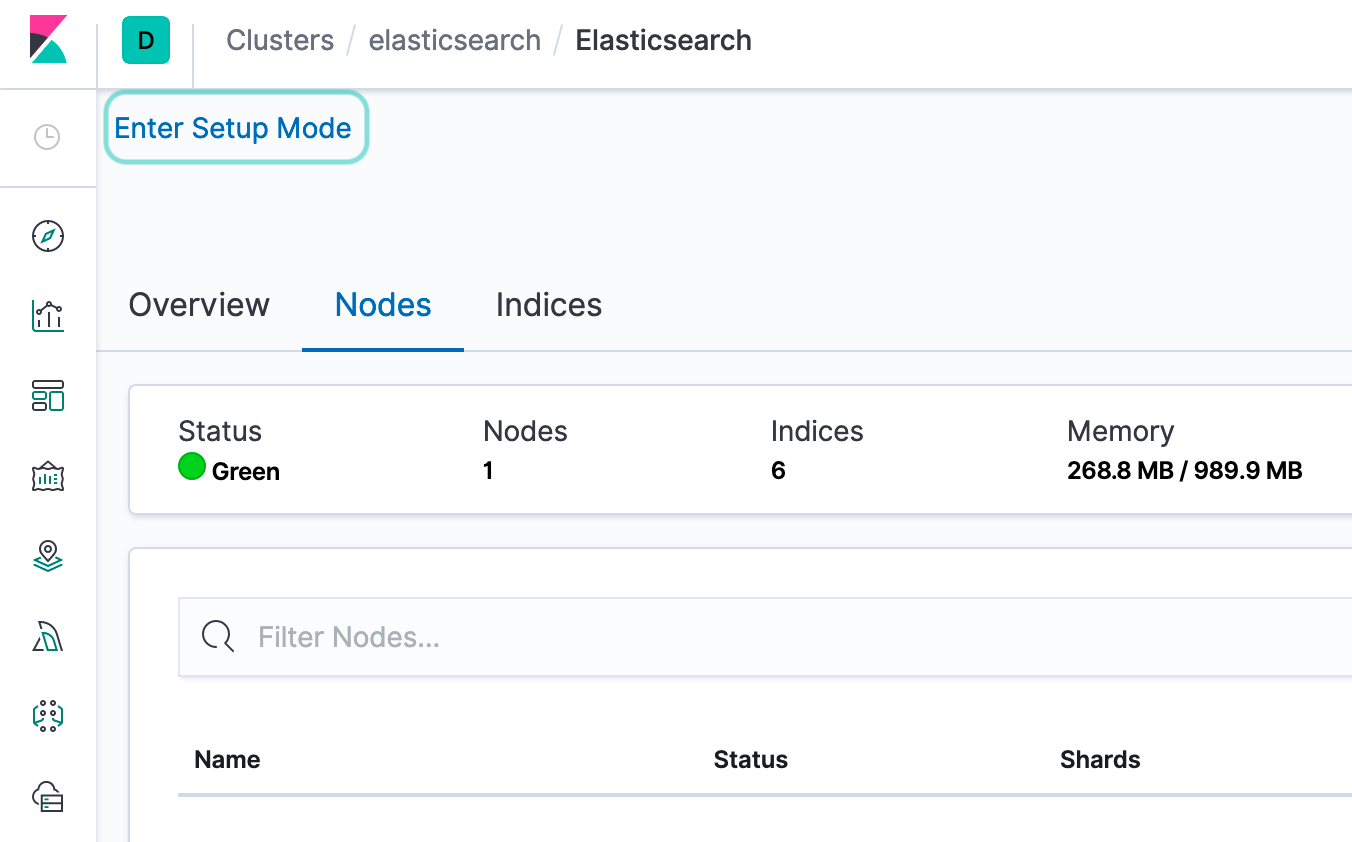
With the 7.5 release of the Elastic Stack, a new Migration Wizard is available in Stack Monitoring for users of internal collection. Using the Migration Wizard, users are guided through the various steps necessary for moving from internal collection to external collection with Metricbeat.

Current Stack Monitoring users can enable Setup Mode for existing, simply click on the link in the upper-right corner of the Stack Monitoring application.
Important upcoming changes
A future major version release of the Elastic Stack will remove internal collection entirely. All users are encouraged to switch to external collection to ensure that they are well-prepared for the transition away from internal collection. Of course, Elastic will keep users well-informed about the upcoming changes along the way so that there is plenty of time to prepare but with the release of external collection there is no reason to wait! Elastic encourages all users to migrate to Metricbeat for Stack Monitoring as soon as they are able to.
Conclusion
Users can see significant gains in the reliability of monitoring by switching from internal collection to external collection. Using either the Migration Wizard or the directions available in the Elastic Stack documentation, it’s easy to see immediate gains from the change and to be well-prepared for the future!