Reducing false positives with automated SIEM investigations from Elastic and Tines


 Share on Twitter
Share on Twitter

 Share on LinkedIn
Share on LinkedIn

 Share on Facebook
Share on Facebook

 Share by Email
Share by Email

 Print this page
Print
One of the biggest SIEM management problems SOC teams face is that they are often overwhelmed by false positives, leading to analyst fatigue and visibility gaps. In addition to that, one of the toughest challenges in security is detecting when SaaS access tokens are compromised without adding to the false positive problem.
At Elastic, the InfoSec team tackles both of these issues by automating SIEM alert investigations with tools like Tines. This blog post shares how we've streamlined our workflows, reduced false positives, and empowered our analysts to focus on real threats.
Automating SIEM alert initial investigation
In a previous blog post, we wrote about how the Elastic InfoSec team created rule packages that detected user and entity behavior analytics (UEBA). As we expanded these alert packages to include more data sources, we found that we were overloading SOC analysts with a high level of false positives caused by anomalous but benign activity — for example, API token activity that only happened once per month or from a known scanner. This led to a problem where we had to decide whether to create a detection rule that may be noisy from false positives, or accept that there will be a visibility gap from not having that detection. A noisy detection that has a lot of false positives creates its own type of visibility gap due to analyst fatigue. But this problem sparked a new thought: what if we could automate the initial investigation of an alert, closing the known false positives and escalating those we can’t close?
We found that for many of our SaaS provider and UEBA detection rules, we could close the rule if the activity came from a trusted device such as one of our managed workstations. The initial investigation playbook action in many cases is to use a piece of information from the original alert, such as the source.ip, and then query other index patterns in Elasticsearch for that source.ip. If there are any results to the query, the alert can be closed as a false positive. For example, if you see a UEBA alert for AWS Secret Key activity we would then run the following group of queries to triage the alert to see if the activity is from a trusted device:
Are there proxy logs showing the Elastic Agent successfully connecting to our fleet server from a workstation or server with that source.ip?
Does that source.ip belong to the public IP range of one of the AWS, GCP, or Azure network zones that we manage and control?
Does the source.ip belong to an authorized third-party application such as Okta, Terraform, Tines, Qualys, or Snyk?
Have there been any successful FIDO2 SSO logins from that source.ip in the past 2 hours?
If any of these follow-on Elasticsearch queries returns results, then we can assume that this AWS API key activity is likely to be authorized and we can close the alert. If all of these queries return zero results, we believe that the activity is suspicious so we escalate it to a SOC team member for further investigation. All of the above Elasticsearch queries can be completed using the _search API, and we can use the Signals API to close and tag the alerts, which allows us to automate the whole process.
By sending our SIEM detections from Elastic to a security orchestration, automation, and response (SOAR) system using the Alert Actions feature, we can use our SOAR to automatically run these investigation queries for every applicable alert. Based on the results of the queries, we can automatically close the alert or escalate it to an analyst.
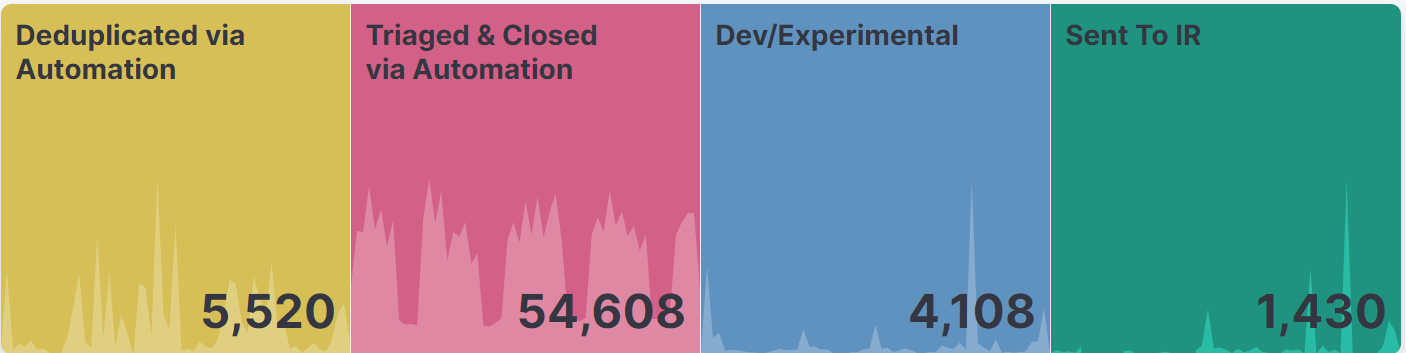
This automated triage capability allows us to create entire classes of detections that would normally be far too noisy to investigate without a dramatic increase in the number of SOC personnel. Our automated workflow is currently triaging and closing over 3,000 alerts per day without any human interaction. It would take an experienced analyst over 15 minutes per alert to triage in the same way. If we wanted to have the same detections without this automation, we would need an additional 94 full-time employees. This chart shows our numbers for the last 30 days of alerts in our SIEM:
This automated triage workflow could be created using custom scripts, but this blog will show you how to build this automation with Tines. We’ve decided to explore it this way because it’s what the Elastic InfoSec team uses and, simply put, it’s easier than scripting. We have found that Tines makes it easy to build and modify automations without having a dedicated development team.
Sending the alerts to any SOAR
As mentioned above, the first step is to get the alert content out of Elastic Security and over to your SOAR solution of choice. To do this we use the Alert Actions feature in Elastic Security, which will take a custom action every time an alert is triggered.
When configuring a detection rule there is an option to add a Rule Action. From here you can select the desired connector type.
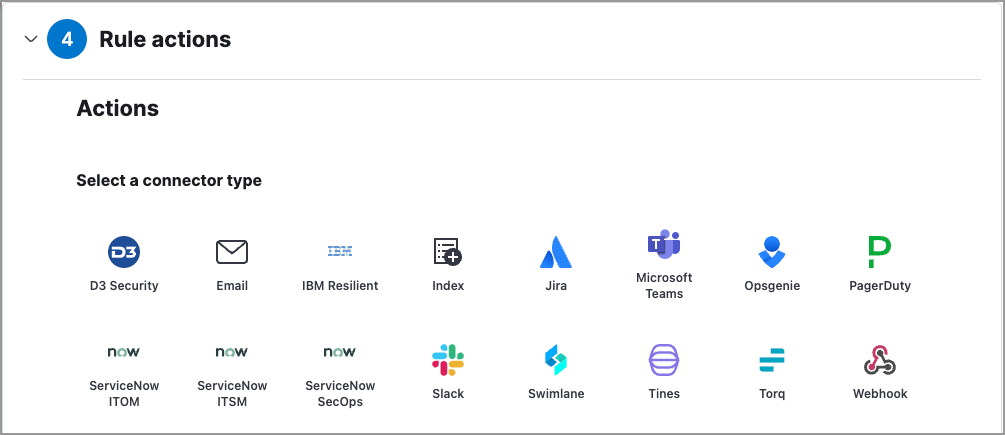
The easiest way to send your alerts to Tines is to configure and use the built-in Tines connector in Elastic, which sends your alerts to a Tines story for processing.
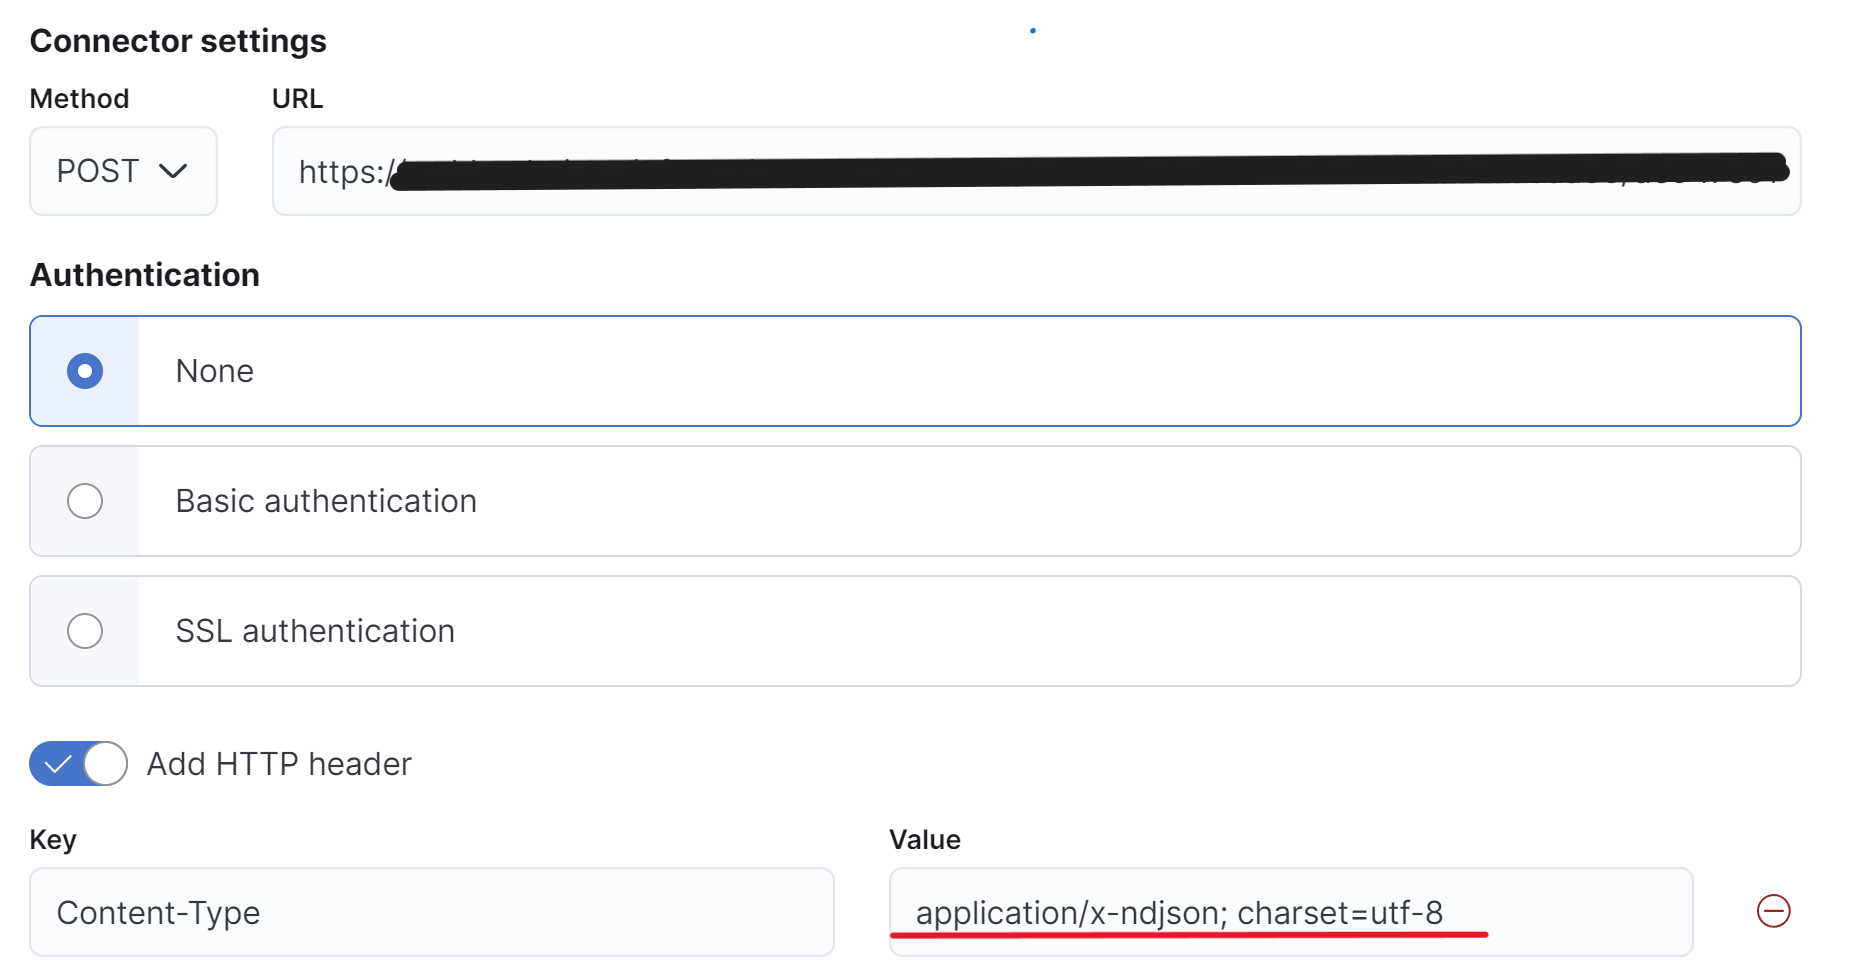
The other option is to use the Webhook connector, which is very flexible because it allows you to send a portion of the alert or the entire contents of the alert in an ndjson format to a listening Webhook. We have been using Tines internally at Elastic since before the Tines connector existed, so most of our automations still use the Webhook connector. You can send the alerts one at a time to the Webhook or all together in a single ndjson. If you are using custom scripts, you can use this connector to receive and process the alerts, and it also works with the Tines Webhook action. To send the full contents of the alert to a Webhook, you will need to configure a Webhook connector to use a POST action with the content type set to application/x-ndjson; charset=utf-8.
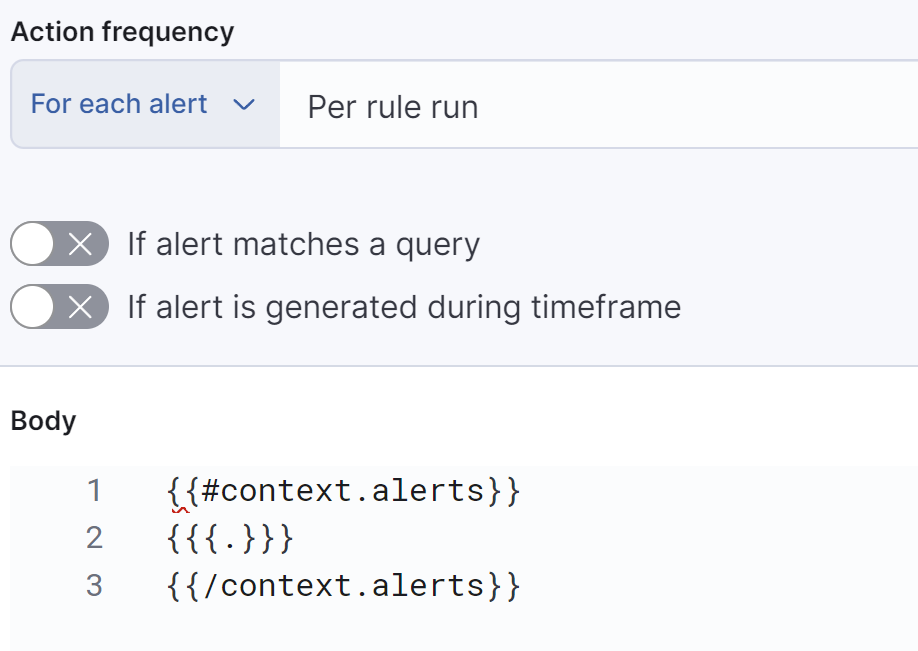
When adding the actions to your rules, select the configured Webhook connector and use the following mustache syntax in your configuration to send the full alert as an ndjson to the Webhook.
Using tags to route the automation
When building these automations, we started by building a custom automation path for each alert individually, but we found very quickly that this doesn’t scale. Our solution to this was to instead use custom tags in our detection rules to route the rule to the appropriate triage path. We are sending the full alert to Tines, which includes the tags as an array in the signal.rule.tags field. We decided to use a naming convention of Triage:{option} to describe which automated checks will be taken on a rule. Detection rules can have multiple different tags.
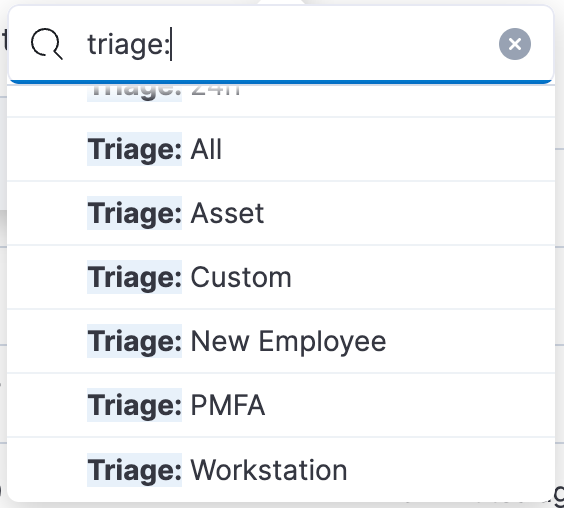
Here is a description of the automated triage tags we are using:
Triage: All will route the alert through the Asset, PMFA, and workstation automated triage paths, and if any queries return true the alert is closed. If none of the queries return true the alert is escalated.
Triage: Asset will check various index patterns to determine if the source IP is coming from an asset that Elastic owns or manages in some way. This includes our internal Asset Database that we store in Elastic, internal network zones, our Elastic Cloud public IPs, CI/CD systems, and public IP space of authorized third-party systems such as Okta or Tines.
Triage: PMFA will look at our Okta audit logs for a successful authentication using phishing-resistant MFA such as a passkey using Okta Verify or Windows Hello. We use the Okta integration to collect our Okta audit logs.
Triage: Workstation will check our nginx proxy logs for successful connections from Elastic Defend to our fleet server from the IP address. Elastic is a distributed company and employees can work from anywhere in the world, but their Elastic Defend agents are connecting regularly, so we can usually see that an Elastic employee’s managed workstation was connected from the same IP that generated the alert.
Triage: New Employee will check our asset database, which contains a daily report of all employees exported from our HR system to see if the user is a new employee. This is important for certain categories of detection rules such as Slack UEBA that usually go off when a new employee is configuring their accounts but rarely alert for existing employees.
Triage: 1h will instruct Tines to pause the alert triage for 1 hour before doing the rest of the triage actions. This can be useful for events such as a user configuring a brand new workstation where the alert can be closed if the workstation is properly enrolled and registered with our endpoint management systems that install Elastic Defend.
Triage: 24h will instruct Tines to pause the alert triage for a full 24 hours before processing. This may be required for some triage paths where the data is only updated daily, such as parts of our asset database that collect a daily inventory of all computers, users, and cloud accounts.
Triage: Custom is for any custom triage paths that may be required for an alert. A good example of this is a scenario where we provided a third party such as Okta with a highly privileged API key used to create or disable accounts in Azure and we want to be alerted if that API token is ever used from an IP address that doesn’t belong to Okta. This alert and automated triage lets us “Trust but Verify” in case Okta’s storage of our API key is compromised and used outside of Okta IP spaces.
Building blocks for the automation
Now that we are sending the full alert as a JSON to our SOAR, we can send it through our triage path and then on to other sources such as Slack or Pagerduty. In Tines, there are seven different types of actions that can be used to build your stories:
The Webhook action will emit events it receives through Webhooks (HTTP callbacks). This is the primary method for sending events to a story in Tines.
The Send Email action sends emails to recipients specified in the action options.
The Receive Email action, formally known as the IMAP Action, emits Events when it detects new emails on an IMAP server or when emails are sent to a uniquely generated email address.
Event Transformation action has several modes that modify the contents of received events. These actions are extremely flexible and powerful.
The HTTP Request action sends HTTP requests using a variety of methods to a specified URL.
The Trigger action compares the contents of a field from an incoming Event with predefined rules, and when the rules match, an event emit is triggered. This can be thought of as an “If Then” logic action.
The Send to Story action sends events to another Tines story (the sub-story). After the sub-story has completed its action, the Send to Story action will emit an event. Send to Story actions are similar to functions or libraries in code where you want to re-use actions in multiple places.
Using these actions, we can build automations that save us thousands of hours of work per month.
Example simplified automated triage workflow:
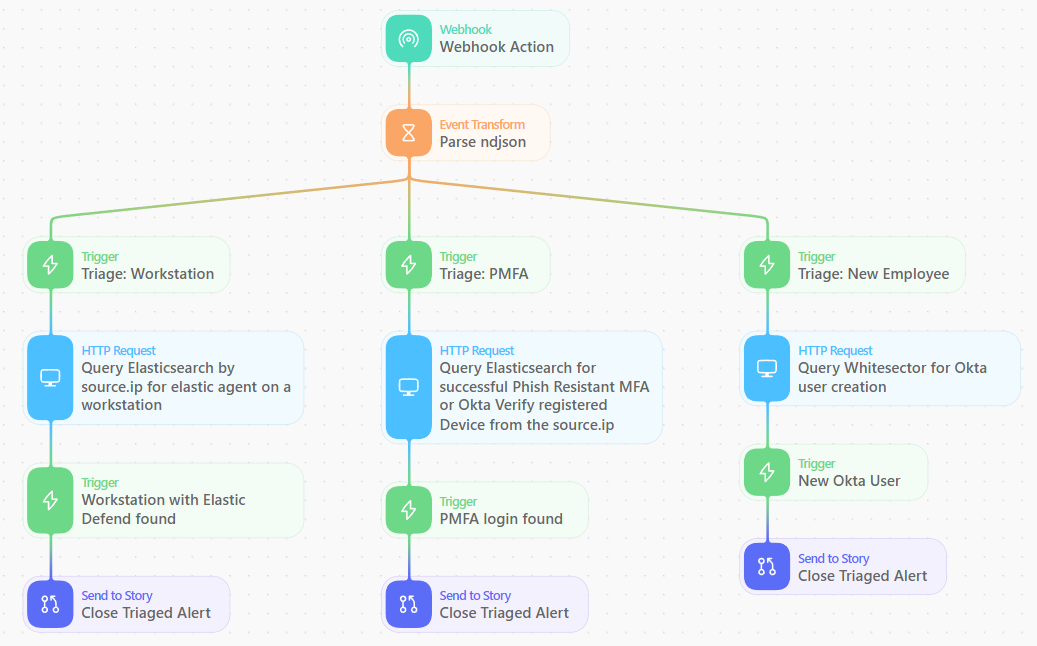
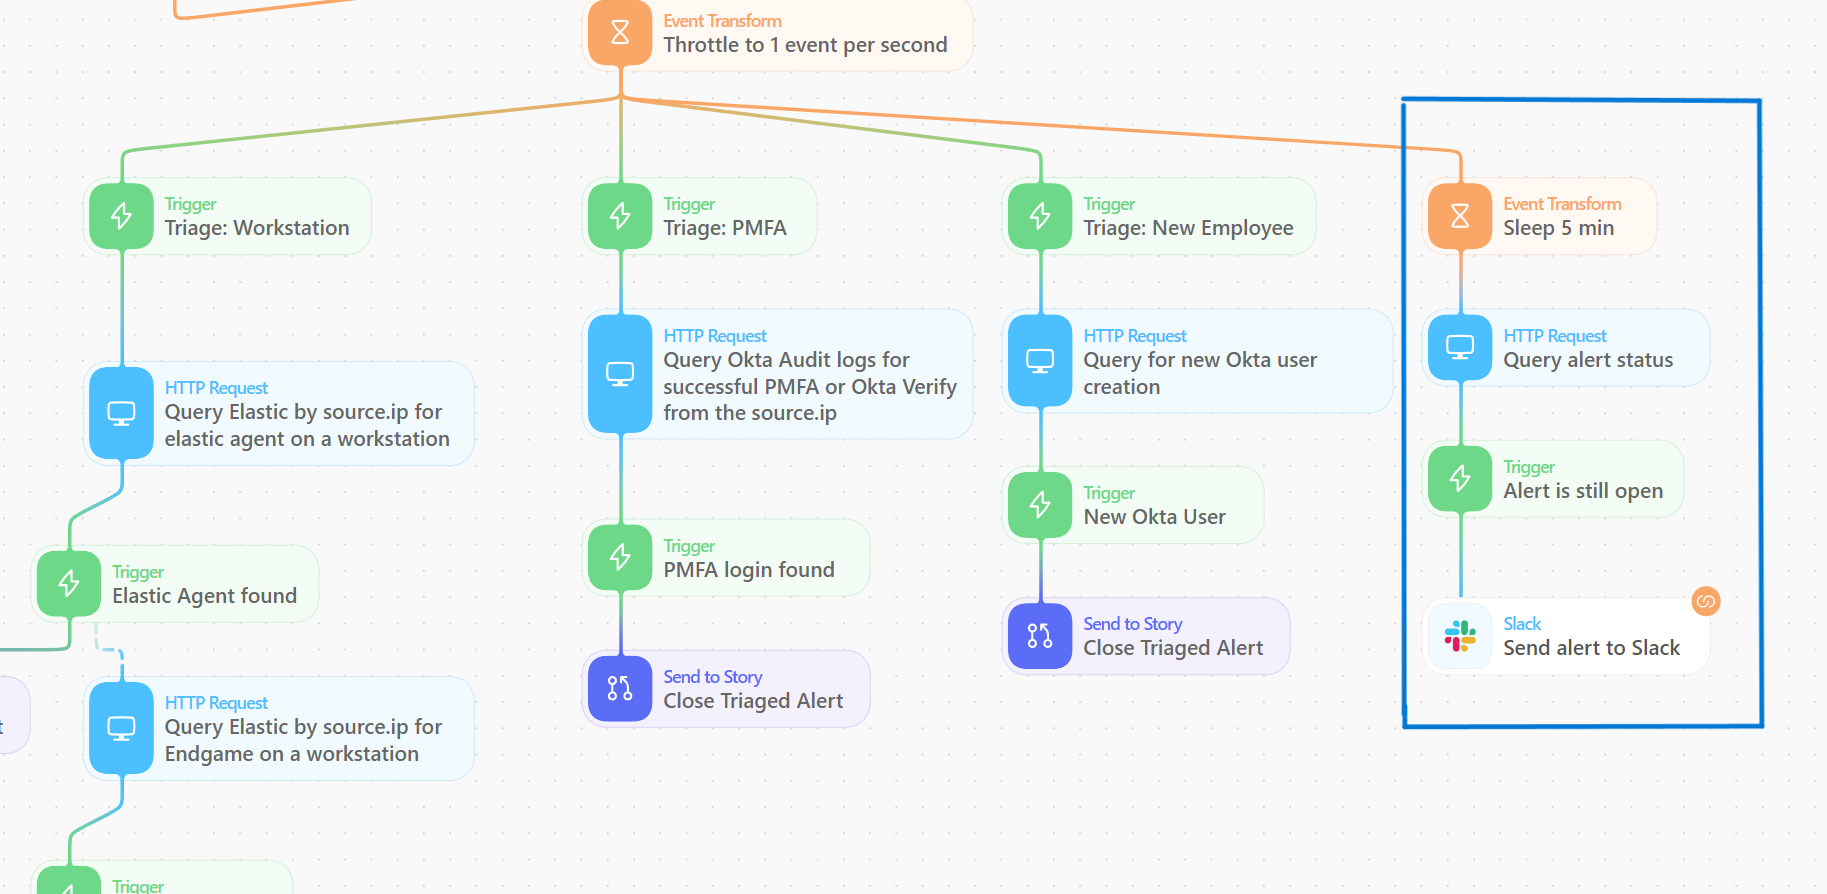
In this automation story, we process new alerts as they come into the Webhook, use an event transform action to parse the ndjson into an object that we can more easily reference, and then use trigger actions to determine which triage paths the alert should go down.
Most of the HTTP request actions are queries to the Elasticsearch _search API. In these follow-on queries, we use fields from the original alert such as the source.ip or the user.email to triage the alerts.
Tines comes with hundreds of prebuilt action templates, including several for interacting with Elasticsearch. You can use the ’Query an Elasticsearch index for all records’ template and then modify the payload to add your query using the source IP from the alert. Because most of the queries are looking for any events from a specific source.ip. I recommend adding the ”size”: 1 option to your queries to improve the speed and performance. This will return if Elasticsearch finds a result matching the source.ip within the last 4 hours.
{
  "size": 1,
  "query": {
    "bool": {
      "must": [],
      "filter": [
        {
          "bool": {
            "should": [
              {
                "match_phrase": {
                  "source.ip": "<<extract_source_ip.source_ip>>"
                }
              }
            ]
          }
        },
        {
          "range": {
            "@timestamp": {
              "format": "strict_date_optional_time",
              "gte": "now-4h",
              "lte": "now"
            }
          }
        }
      ],
      "should": [],
      "must_not": []
    }
  }
}Following each query action, we have a trigger action to check if any results were found. If the number of hits is greater than zero, we use the Signals API to close the alert. If there are zero results, we continue processing and go on to the next action. If all actions return zero results, we then send the alert to Slack to notify the analysts for investigation.
These are the example settings for a Trigger action that checks for any results to a query:
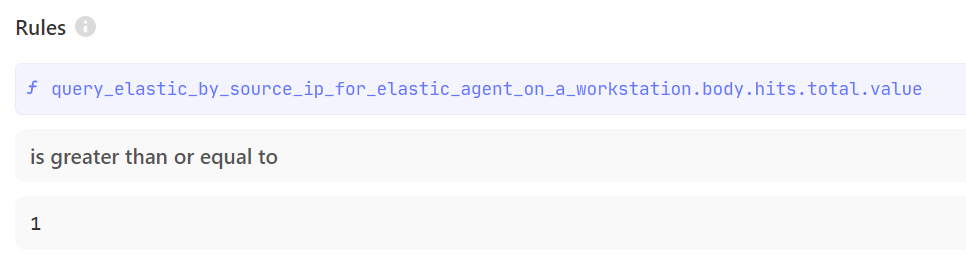
By using the logic of running an Elasticsearch query and then closing the alert if there are any results, we can chain several of these actions together to build comprehensive stories that close alerts coming from known good IP addresses.
Managed workstation triage example
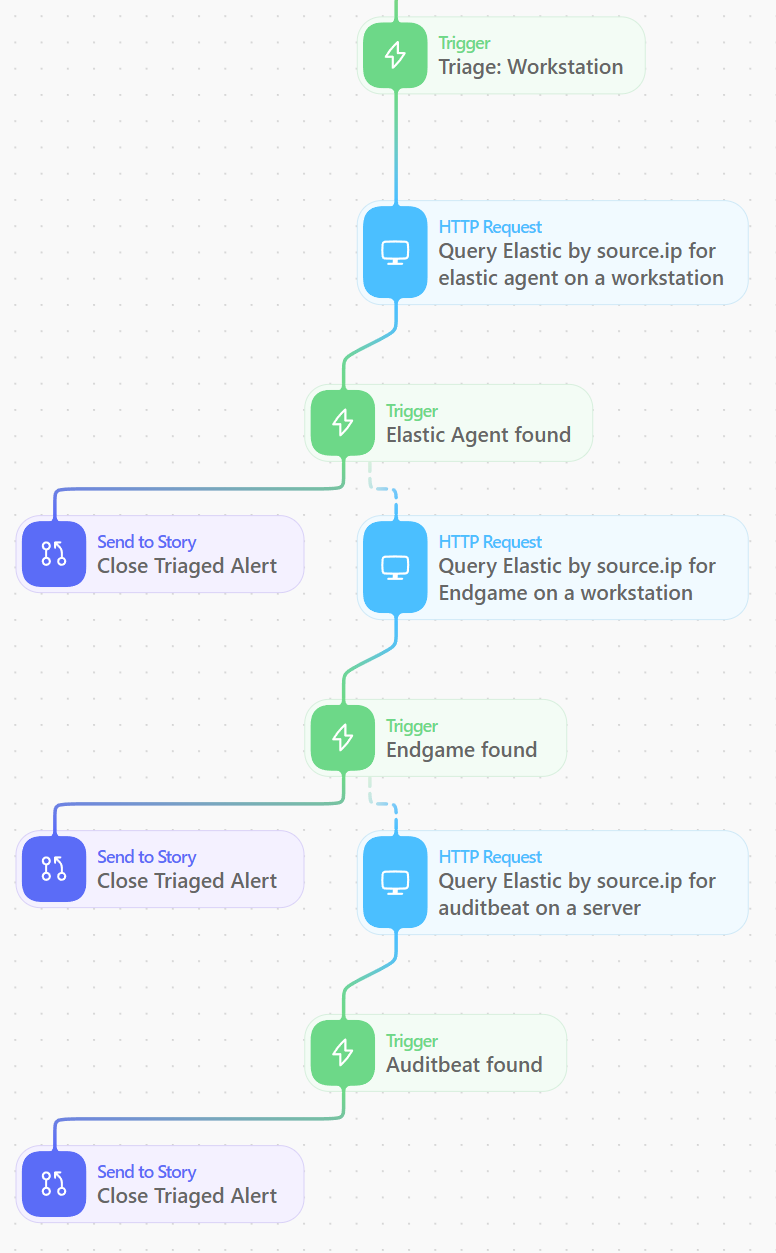
In the example story branch below, we are closing any alert that is coming from a workstation or server that we manage. Elastic is a globally distributed company and the majority of our employees work from home, so we have no way of predicting which IP address they will be connecting to the internet from, and in many cases their public IP address can change multiple times per day. Our solution to reliably finding the public IPs of these workstations as they travel around the world is to deploy the Elastic Agent to the nginx proxies that sit in front of our InfoSec infrastructure.
Using this data, we can now identify successful connections through the proxy sending Elastic Agent, Auditbeat, or Endgame traffic to our clusters. All of our cloud server systems have Auditbeat or Elastic Agent installed, so these queries will also detect the public IP addresses of our server systems that regularly use secret keys to run CI/CD and DevOps pipelines.
Below is the path in the Tines story that we use to check for a managed workstation or server from a source ip. The dashed lines from the Trigger actions is the path that the story flows through if a trigger action does not return true.
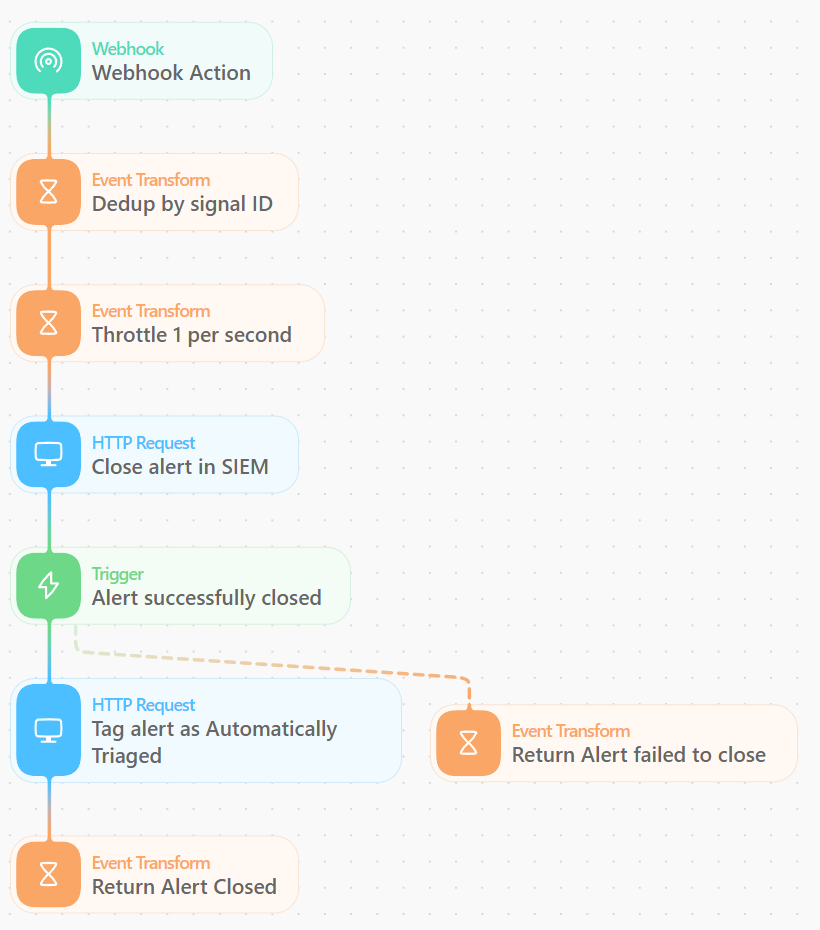
The close alert Send to Story
You may have noticed that each time we want to close the alert we use a Send to Story action in Tines. This action will send the fields we chose to a new story in Tines via a Webhook where we then close and tag the alert. By using a Send to Story, we keep our main story easier to maintain, and we can add additional functionality such as deduplicating by the signal ID so we don’t try to close the same alert twice from two different branches of triage, and using a throttle action so we don’t overwhelm the API if a lot of alerts come in at once.
We also use the Signals API to update the rule tags, which can be useful for metrics and tracking the status of alerts. All of the alerts that we close with our automated triage workflow are also tagged as Automated Triage so we can track the number of triaged alerts per month and easily see in the SIEM UI if an alert was closed by the automation or by an analyst.
Escalating open alerts to Slack
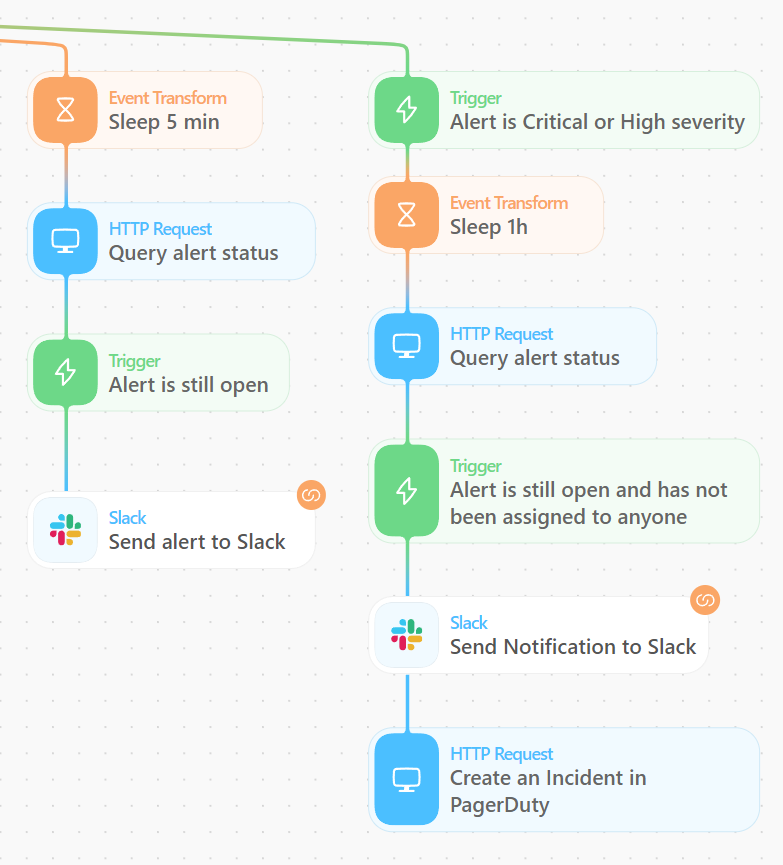
As we are sending the alerts through the various automated triage paths in parallel, we also send the story down a path where we pause processing for 5 minutes. This 5-minute pause allows the other branches time to complete and close any alerts that are found to come from a trusted source IP. After the 5-minute pause, we send a request to the signals search API to check to see if the alert is still open. If the alert is still open, we send a message to our alerts Slack channel to inform the SOC analysts that an alert was not automatically triaged.
If you want to add more functionality to this story, Tines makes it easy to create another branch to the story to add additional capabilities. For example, if you have an SLA requiring you to acknowledge critical or high severity alerts in a certain amount of time, you could add logic to wait for an hour and then check to see if the alert has been acknowledged in the Elastic SIEM. If the alert is still open and hasn’t been assigned to anyone, you can escalate by sending an alert to PagerDuty or a second Slack message to a different team.
Tines also includes templates for working with Cases in Elastic Security — with a couple extra actions in this branch you could open a new case, assign it to the on-call analyst, and add the alert details to the case.
Challenges we’ve encountered
Nothing in security is perfect, and for every security control there are ways for threat actors to bypass them. But just because something isn’t perfect doesn’t mean that it isn’t worth the effort. One of the obvious weaknesses is that these alerts have limited effectiveness for insider threats, and if a threat actor is pivoting through a compromised workstation, server, or corporate VPN connection, they can then come from a known good IP address and for rules with automated triaged workflows, alerts would be closed automatically.
I have two arguments for that: the first is that without this automation in place, most of these detections are impossible to deploy without hundreds of additional employees. Even with their weaknesses, these automated detections provide better visibility than without. The triaged alerts can be used for threat hunting and included in detections that alert on multiple distinct detection rules for a host or user so they can still provide value.
Second, if we can force threat actors to change their tactics — like forcing them to compromise and pivot through one of our workstations or servers — that dramatically increases the chances of detection. Our workstations and servers are highly instrumented with Elastic Defend and contain over a thousand detection rules in place. We’ve seen that most of the time when a threat actor compromises SaaS credentials or an API secret token, they are usually going to connect to the service directly from their own infrastructure and not through a compromised host.
The other big challenge while building these detections is Shadow IT and all of the interconnections and trusts with third parties in a modern IT system. Shadow IT is a term used to describe when a team in the company sets up their own IT systems without going through all of the proper channels to add the systems to the asset inventory and install Elastic Agent or auditbeat.
When you build these triage workflows and you are defining what is a “known good IP,” you will also inevitably find that there are API tokens being used in an authorized way from IP addresses that don’t belong to your company. These tokens are usually used for various third-party automations such as GitHub Actions or by scanning applications such as Qualys or Snyk. Tracking these down and building the exceptions can take time, but it can also be very valuable as you identify and remove Shadow IT.
In some cases, the third-party providers such as Okta, GitHub, or Elastic Cloud will have their public IP spaces published so you can build additional checks to filter out activity from those IPs. If you are using a Tines cloud tenant, you can retrieve the current public IP of your tenant from https://<tenant-domain>/info.
Example detections
These automations originally started as a solution for a single detection rule, but we’ve found that they are extremely valuable for many different scenarios. For many of your detection rules, you can ask yourself, “If this alert is triggered by an IP address that we confirmed belongs to us, would our SOC close the alert?” We’ve found this to be true for most of the behavior-based detection rules for third-party services, making them good candidates for automated triage.
Here is a list of some of the detections we automate the initial triage for to give you some ideas for detections you can build with this workflow. Some of these detections are custom detections that are built to work with this automated triage workflow, but many of them are existing detections that we added the Triage tags to in order to eliminate some false positives.
Okta high risk authentication
Okta Support activity from a non-Okta IP
Okta API activity from a new IP
Okta UEBA: multiple different alerts for the same email and ip
Okta: multiple email addresses seen with a single dt hash
Okta successful user login without phishing-resistant MFA
Okta Authentication by MFA Exempt account from new IP
Multiple Okta User Auth Events with Same Device Token Hash Behind a Proxy
Slack UEBA: multiple different alerts for a Slack user
GCP Portal login from a new IP
GCP IAM activity from a new IP
Buildkite web activity from a new IP
Buildkite API activity from a new IP
GitHub: Multiple UEBA alert for a GitHub PAT
GitHub: Spike in user cloning private repos
Hashicorp Vault: Multiple UEBA alerts for a Vault user
Azure Active Directory high risk authentication
Azure Portal login from a new IP
Azure Active Directory powershell sign-in from a new IP
Azure Active Directory Device Code authentication
Azure Active Directory successful login without MFA
AWS IAM activity from a new IP
AWS Key UEBA: multiple different alerts for an aws key
AWS User UEBA: Multiple different alerts for an AWS account
AWS console authentication from a new IP
Achieving new levels of protection
In this blog post, I showed you how the Elastic InfoSec team uses Tines to automate the initial triage of many of our alerts. This automation enables us to have much better visibility while boosting efficiency, and it lets us spend our time investigating the real threats. Using Tines, we were able to fully investigate and close over 50K alerts in the last 30 days. Each of these alerts were thoroughly investigated and closed out within seconds of being triggered. It would be impossible to have the same level of protections in our network without this.
If you want to try this for yourself, you can do it for free with a 14-day trial of Elastic Cloud and the always free community edition of Tines to see how powerful these workflows can be for you.
The release and timing of any features or functionality described in this post remain at Elastic's sole discretion. Any features or functionality not currently available may not be delivered on time or at all.
Share
- Share on Twitter
Share on Twitter
- Share on LinkedIn
Share on LinkedIn
- Share on Facebook
Share on Facebook
- Share by Email
Share by Email
- Print this page
Print